. 2022 Jun 29;13(1):3760.
doi: 10.1038/s41467-022-31526-7.

Structural and electrophysiological basis for the modulation of KCNQ1 channel currents by ML277

Affiliations

Structural and electrophysiological basis for the modulation of KCNQ1 channel currents by ML277

Katrien Willegems et al. Nat Commun. .

Abstract

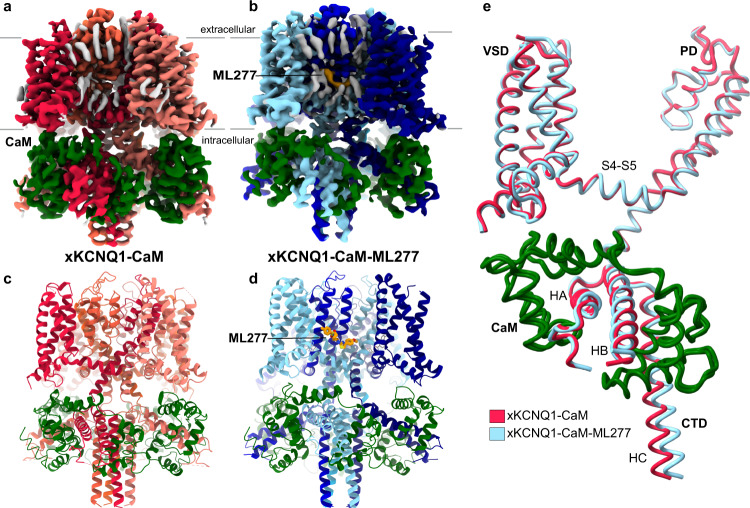
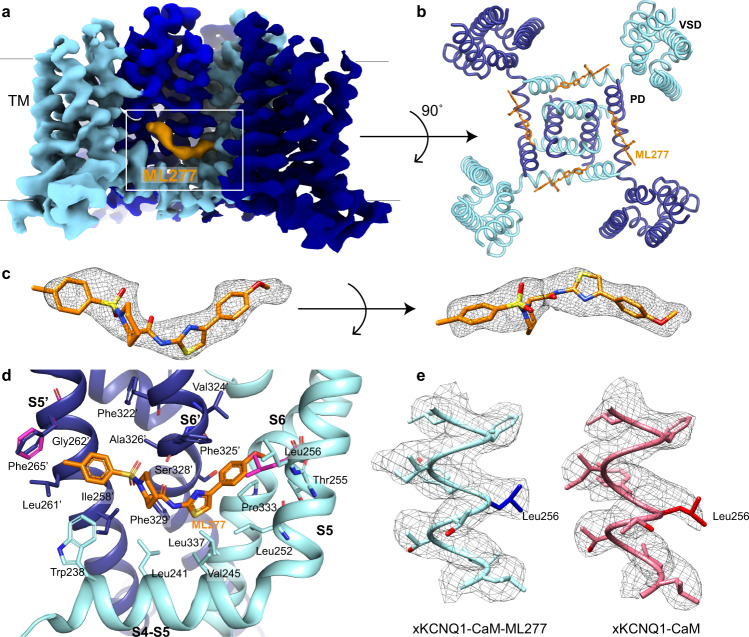
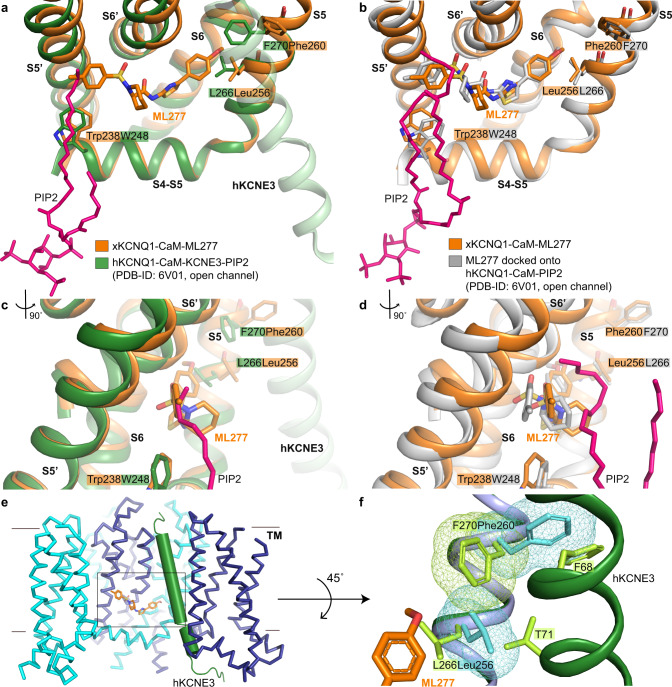
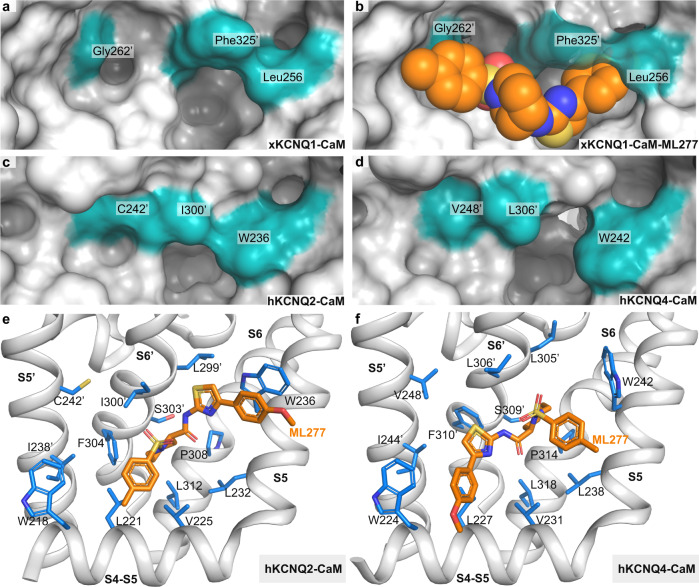
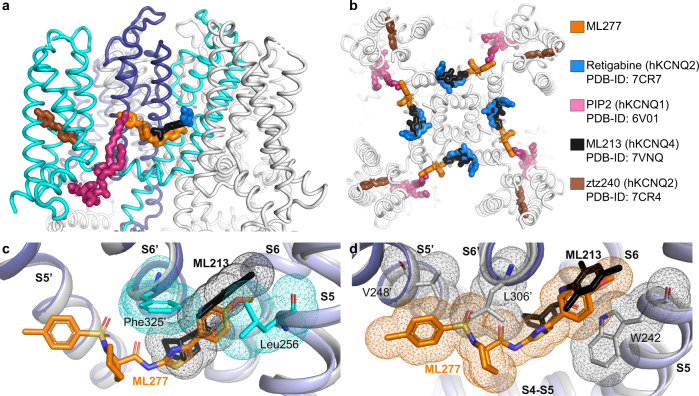
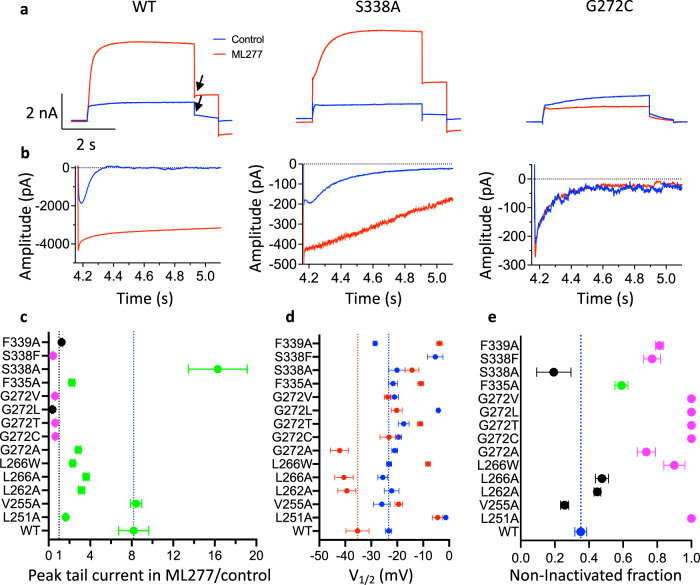
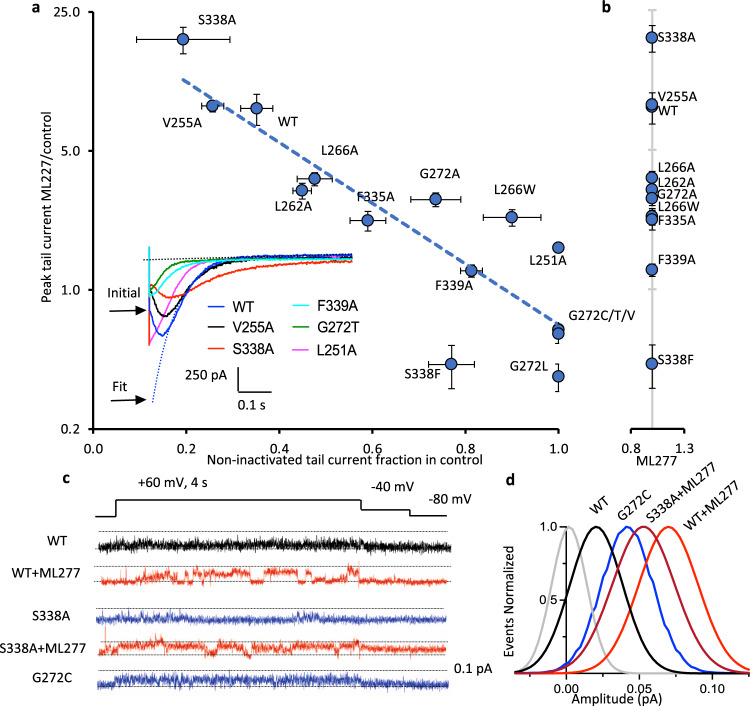
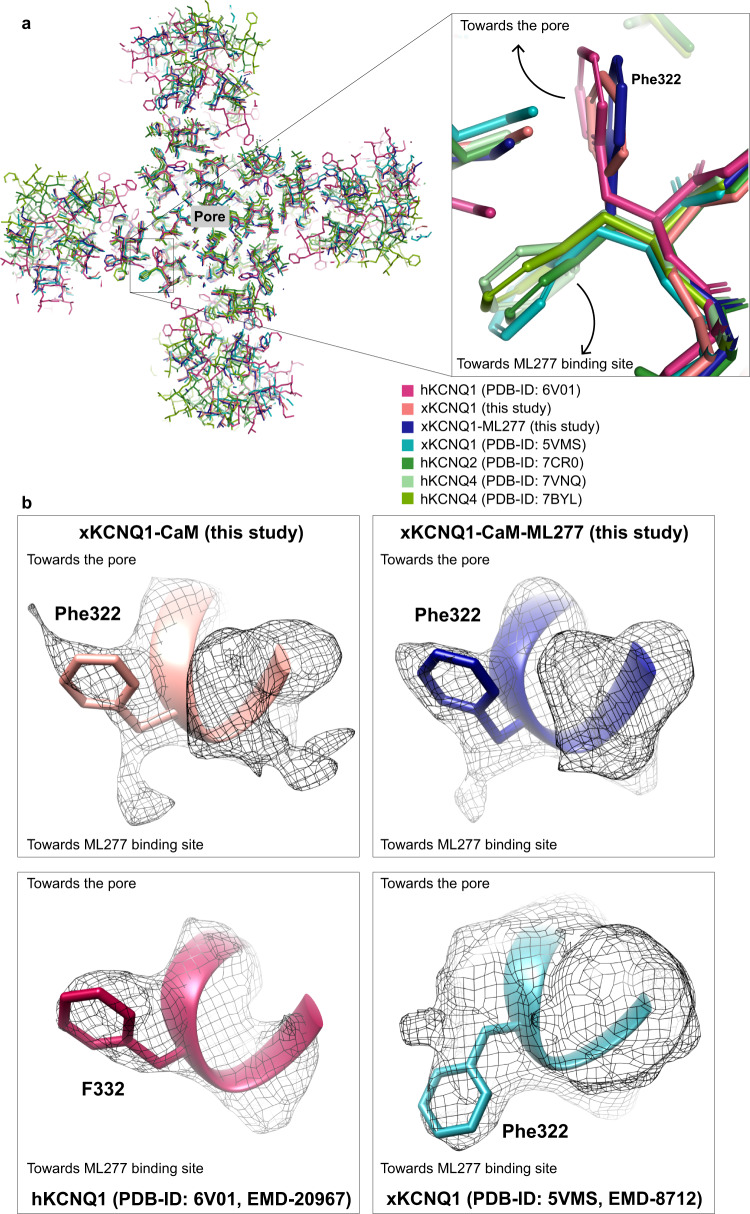
The KCNQ1 ion channel plays critical physiological roles in electrical excitability and K+ recycling in organs including the heart, brain, and gut. Loss of function is relatively common and can cause sudden arrhythmic death, sudden infant death, epilepsy and deafness. Here, we report cryogenic electron microscopic (cryo-EM) structures of Xenopus KCNQ1 bound to Ca2+/Calmodulin, with and without the KCNQ1 channel activator, ML277. A single binding site for ML277 was identified, localized to a pocket lined by the S4-S5 linker, S5 and S6 helices of two separate subunits. Several pocket residues are not conserved in other KCNQ isoforms, explaining specificity. MD simulations and point mutations support this binding location for ML277 in open and closed channels and reveal that prevention of inactivation is an important component of the activator effect. Our work provides direction for therapeutic intervention targeting KCNQ1 loss of function pathologies including long QT interval syndrome and seizures.


Conflict of interest statement

The authors declare no competing interests.

Figures

Fig. 1
Fig. 1. Cryo-EM maps of Xenopus KCNQ1-CaM alone and in complex with ML277.
a Cryo-EM density map of Xenopus KCNQ1-CaM (xKCNQ1-CaM), and its model structure (c). CaM is colored dark green and KCNQ1 subunits are in shades of red. b xKCNQ1-CaM in complex with ML277 and its model structure (d). CaM and ML277 are colored dark green and orange, respectively. KCNQ1 subunits are in shades of blue. Additional densities, likely representing unmodeled detergent or lipid molecules are shown in gray. For further analysis of these densities, see Supplementary Fig. 7. e Overall superposition of a single subunit of xKCNQ1-CaM and xKCNQ1-CaM-ML277 shows a visible twist in the C-helix coiled-coil domain (CTD). HA-HC refers to helices within the C-terminal domain of KCNQ1.
Fig. 2
Fig. 2. ML277 binding to xKCNQ1-CaM.
a The cryo-EM density map for xKCNQ1-CaM-ML277 with the density for ML277 indicated in orange. The density map is cut off at the TM region for clarity. b Top view of xKCNQ1-CaM-ML277 from the extracellular side is shown with ML277 (orange) bound in its hydrophobic pocket. The structure is clipped in the frontal plane at the level of the binding site for clarity. c Isolated density (5x rmsd) for ML277 is shown as a mesh with the ML277 docked inside in the orientation with the highest map-to-model correlation coefficient. d Enlarged side view of the ML277 binding pocket formed by the S4-S5 linker helix, the transmembrane spanning S5 and S6 helices from one protomer (light blue) and the S5′ and S6′ from an adjacent protomer (dark blue). The position of the side chain of Leu256 and the possible rotation of the phenyl ring of Phe265′ in the xKCNQ1-CaM structure are shown in pink. e Comparison of the density map (contour level at 5x rmsd) for xKCNQ1-CaM and xKCNQ1-CaM-ML277 focused on the S5 helix.
Fig. 3
Fig. 3. xKCNQ1-CaM-ML277 shows a twisted coiled-coil C-terminal domain.
a Heterogeneous refinement (K = 4) of xKCNQ1-CaM-ML277 data set 1 showed three KCNQ1 classes (see Supplementary Fig. 3). Two classes with similar twist were pooled and refined shown here as class I whereas the third class is shown as class II for clarity. Both classes have different CTD twist degrees between them, and compared to our native and previously studied xKCNQ1-CaM map (PDB-ID: 5VMS), indicating a flexibility in the ML277-induced twist of the coiled-coil CTD. The native structure which was determined in this work is shown in light blue. This twist was also observed for the xKCNQ1-CaM-ML277 data set 2. b The twist of the CTD in the ML277-bound xKCNQ1-CaM (light green) compared to our and previously studied native structures (blue and brown, respectively) shows a displacement of the backbone by ~1 Å at the top of the CTD (Asp526) and due to the propagated twist up to ~3 Å around the last modeled residue, Leu556.
Fig. 4
Fig. 4. ML277 binding to the open hKCNQ1 structure in the presence of PIP2 and KCNE3.
a, c Superposition of xKCNQ1-CaM-ML277 structure (orange) onto the open pore hKCNQ1-CaM-KCNE3-PIP2 (PDB-ID: 6V01, green) via the S4-S5 linker and S5 helix. hKCNE3 is shown as pale green for comparison. c Side view of PIP2 tail and ML277. b, d Superposition of xKCNQ1-CaM-ML277 structure (orange) onto the modeled hKCNQ1-PIP2-ML277 structure (gray, PDB-ID: 6V01, KCNE3 was omitted). Binding free energy for ML277 was −54.5 ± 0.65 kcal/mol. d Side view of PIP2 tails and ML277. e Superposition of KCNE3 (green) from hKCNQ1-CaM-PIP2-KCNE3 (PDB-ID: 6V01), onto the xKCNQ1-CaM-ML277 complex (cyan and blue). f Conformations of T71 and F68 in KCNE3 and F270 in hKCNQ1 do not allow L266 to rotate and ML277 to bind. Residues on KCNQ1-CaM-PIP2-KCNE3 (green) are lime green and corresponding residues Leu256 and Phe260 in xKCNQ1-CaM-ML277 are shown in cyan. VDW surfaces of Leu256, Phe260 in xKCNQ1, and F270 in hKCNQ1 are shown as mesh to indicate potential clashes.
Fig. 5
Fig. 5. Binding of ML277 to xKCNQ1, hKCNQ2, and hKCNQ4.
ad Surface representation of the ML277 binding pocket in xKCNQ1 (a, b), hKCNQ2 (PDB-ID: 7CR3) and hKCNQ4 (PDB-ID: 7BYL). Docking score for ML277 to xKCNQ1 was −31.1. e MD docking of ML277 onto KCNQ2 (7CR3). ML277 is shown in orange. Docking score was −16.6. f MD docking of ML277 onto hKCNQ4 (7BYL). Docking score was −9.42.
Fig. 6
Fig. 6. Binding of ML277 and other KCNQ regulators to xKCNQ1 and hkCNQ4.
a, b Overview of published KCNQ-ligand binding plotted on the xKCNQ1-CaM-ML277 structure. Different isoform structures were aligned based on the pore-forming domain. a View from within the plane of the membrane. Cyan and blue for the two subunits comprising the ML277 binding pocket. b Top view from the extracellular side clipped at the level of the ML277/ML213/retigabine binding sites for clarity. c Superposition of hKCNQ4-CaM-ML213 (gray) onto xKCNQ1-CaM-ML277 (different shades of blue for different subunits, xKCNQ1 residue side chains shown in cyan) ML277 is shown in orange, and ML213 in black. Van der Waals surfaces indicate potential clashes. d Superposition of xKCNQ1-CaM-ML277 onto hKCNQ4-CaM-ML213 (ML213 in black and hKCNQ4 residue side chains in gray). Van der Waals surfaces indicate potential clashes between ML277 and hKCNQ4 residues W242, L306′ and V248′.
Fig. 7
Fig. 7. Mutations to ML277 binding site residues reduce or eliminate drug effects on hKCNQ1.
a Current traces in control (blue) and after addition of 1 μM ML277 (red) for WT and mutant channels. Cells were held at −90 mV, pulsed to +60 mV for 4 s, then −40 mV for 0.9 s. The interpulse interval was 15 s. Arrows show peak tail measurements for graph in panel c. b Tail currents at −120 mV after 4 s pulses to +60 mV in control (blue) and in ML277 for different mutants as indicated in a. Note: residue numbering in hKCNQ1 is +10 compared with xKCNQ1. c KCNQ1 tail current amplitudes in ML277 divided by initial control tail, protocol as in panel a. Error bars denote mean ± SEM, n = 3–8 cells, (see Supplementary Table 2 for exact n values). Black indicates no drug effect; magenta indicates a significant decrease, and green indicates a significant increase from control (see Supplementary Table 2). Only V255A is not significantly different from WT, otherwise P = 0.008–>0.001 using one-way ANOVA. d Mean V1/2 of activation before (blue) and after (red) exposure to 1 μM ML277. Protocol as in panel a. See Supplementary Table 3 for n and mean values and significance tests. For S338F, tail currents in ML277 were too small to measure. e Initial tail current amplitude in control divided by extrapolated fit to tail current decay, as a measure of channels that are not inactivated at the start of the tail, values represent the mean ± SEM. WT is blue, not significantly different from WT is black, significantly less inactivated than WT, P < 0.05 (green) and P < 0.01 (magenta). Where no hook was observed, a value of 1 is given for non-inactivated fraction, e.g., L251A and G272C (b). Note that in some cases error bars fall within plotted symbols. n = 4 cells for L262A, L266A and F335A, n = 5 cells for L266W, G272V and S338F, for all others n = 3 cells. Source data are provided as a Source Data file for panels ce.
Fig. 8
Fig. 8. Tail current increase in ML277 vs. inactivation of KCNQ1 mutants is reflected in single channels.
a Tail current response to ML277, data from Fig. 7c, on a log ordinate vs non-inactivated tail current fraction in the absence of ML277 (see inset) from Fig. 7e. Fitted correlation rs = −0.86, P = 0.0001, Spearman rank coefficient. Linear trend line is shown. Inset panel shows control tail currents at −120 mV for WT and stated mutants. As an example, the initial peak of the WT tail (blue) is indicated, and also the fit back to the tail start to extract the fitted peak value. Values represent the mean ± SEM, n values as for Fig. 7c and e. b As for panel a except non-inactivated fraction was obtained in the presence of 1 μM ML277. L251A and G272C/T/L/V were unchanged from control solution (panel a) and for clarity are not replotted. Note that in some cases vertical and horizontal error bars fall within plotted symbols. c Voltage protocol and representative single-channel recordings of WT, S338A, and G272C KCNQ1 in control and 1 μM ML277 as indicated. Data filtered at 2 kHz at acquisition, and 200 Hz for presentation. Dotted lines denote zero pA (baseline) and 0.1 pA. No ML277 data were obtained for G272C. d Gaussian fits of amplitude event distributions for a blank sweep (gray), WT, S338A, and G272C sweeps, in control and ML277 as indicated. For WT, peaks were 0.02 in control, and 0.069 ± 0.003 pA in ML277, n = 4 cells. For S338A, peaks were 0.022 ± 0.002 in control (not shown) and 0.049 ± 0.003 pA in ML277, n = 3 cells. For G272C peaks were 0.040 ± 0.002 pA in control, n = 3 cells.
Fig. 9
Fig. 9. Conformation of Phe322 in xKCNQ1-CaM.
a Superposition of xKCNQ1-CaM and xKCNQ1-CaM-ML277 with hKCNQ1 (PDB-ID: 6V01), xKCNQ1 (PDB-ID: 5VMS), hKCNQ2 (PDB-ID: 7CR0) and hKCNQ4 (PDB-ID: 7VNQ, PDB-ID: 7BYL) structures showing detail around Phe322 (xKCNQ1) in a top view from the extracellular side. The previously published xKCNQ1-CaM and hKCNQ2 and hKCNQ4 structures show a corresponding Phe322 side-chain orientation pointing towards the ML277 binding site, while hKCNQ1 and our structures show a Phe322 oriented toward the pore. b Cryo-EM densities for Phe322 in xKCNQ1-CaM and xKCNQ1-CaM-ML277 (above) from this study, and from hKCNQ1 (F332, PDB-ID: 6V01) and xKCNQ1-CaM (Phe322, PDB-ID: 5VMS), below. The contour level cut offs were: maps from this study 8x rmsd, EMD-20967 6x rmsd, EMD-8712 1x rmsd.

Similar articles

Cited by

References

    1. Bendahhou S, et al. In vitro molecular interactions and distribution of KCNE family with KCNQ1 in the human heart. Cardiovasc. Res. 2005;67:529–538. doi: 10.1016/j.cardiores.2005.02.014. - DOI - PubMed
    1. Sanguinetti, M. C. & Seebohm, G. Physiological functions, biophysical properties, and regulation of KCNQ1 (KV7.1) potassium channels. Adv. Exp. Med. Biol.1349, 335–353 (2021). - PubMed
    1. Sachyani D, et al. Structural basis of a Kv7.1 potassium channel gating module: studies of the intracellular c-terminal domain in complex with calmodulin. Structure. 2014;22:1582–1594. doi: 10.1016/j.str.2014.07.016. - DOI - PubMed
    1. Sun J, MacKinnon R. Cryo-EM structure of a KCNQ1/CaM complex reveals insights into congenital long QT syndrome. Cell. 2017;169:1042–1050.e1049. doi: 10.1016/j.cell.2017.05.019. - DOI - PMC - PubMed
    1. Sun J, MacKinnon R. Structural basis of human KCNQ1 modulation and gating. Cell. 2020;180:340–347.e349. doi: 10.1016/j.cell.2019.12.003. - DOI - PMC - PubMed

Publication types

Substances

LinkOut - more resources