

Insights to estimate exposure to regulated and non-regulated disinfection by-products in drinking water
- PMID: 35768489
- PMCID: PMC9244125
- DOI: 10.1038/s41370-022-00453-6
Insights to estimate exposure to regulated and non-regulated disinfection by-products in drinking water
Abstract
Background: Knowledge about human exposure and health effects associated with non-routinely monitored disinfection by-products (DBPs) in drinking water is sparse.
Objective: To provide insights to estimate exposure to regulated and non-regulated DBPs in drinking water.
Methods: We collected tap water from homes (N = 42), bottled water (N = 10), filtered tap water with domestic activated carbon jars (N = 6) and reverse osmosis (N = 5), and urine (N = 39) samples of participants from Barcelona, Spain. We analyzed 11 haloacetic acids (HAAs), 4 trihalomethanes (THMs), 4 haloacetonitriles (HANs), 2 haloketones, chlorate, chlorite, and trichloronitromethane in water and HAAs in urine samples. Personal information on water intake and socio-demographics was ascertained in the study population (N = 39) through questionnaires. Statistical models were developed based on THMs as explanatory variables using multivariate linear regression and machine learning techniques to predict non-regulated DBPs.
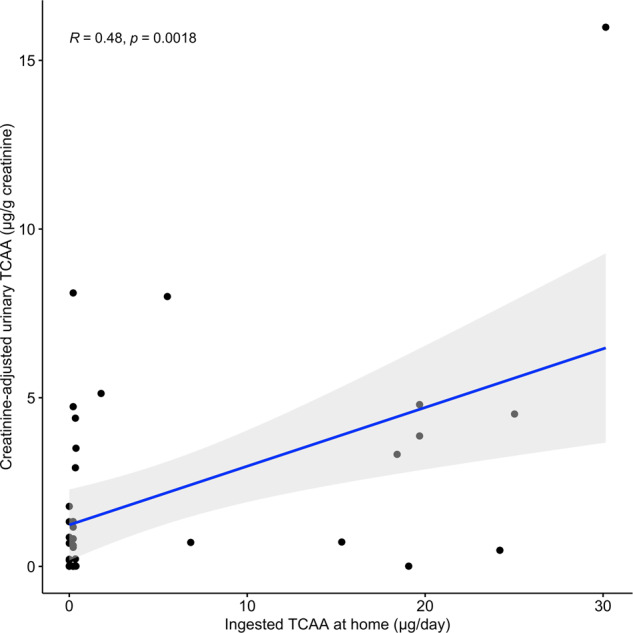
Results: Chlorate, THMs, HAAs, and HANs were quantified in 98-100% tap water samples with median concentration of 214, 42, 18, and 3.2 μg/L, respectively. Multivariate linear regression models had similar or higher goodness of fit (R2) compared to machine learning models. Multivariate linear models for dichloro-, trichloro-, and bromodichloroacetic acid, dichloroacetonitrile, bromochloroacetonitrile, dibromoacetonitrile, trichloropropnanone, and chlorite showed good predictive ability (R2 = 0.8-0.9) as 80-90% of total variance could be explained by THM concentrations. Activated carbon filters reduced DBP concentrations to a variable extent (27-80%), and reverse osmosis reduced DBP concentrations ≥98%. Only chlorate was detected in bottled water samples (N = 3), with median = 13.0 µg/L. Creatinine-adjusted trichloroacetic acid was the most frequently detected HAA in urine samples (69.2%), and moderately correlated with estimated drinking water intake (r = 0.48).
Significance: Findings provide valuable insights for DBP exposure assessment in epidemiological studies. Validation of predictive models in a larger number of samples and replication in different settings is warranted.
Impact statement: Our study focused on assessing and describing the occurrence of several classes of DBPs in drinking water and developing exposure models of good predictive ability for non-regulated DBPs.
Keywords: Bottled water; Disinfection by-products; Drinking water; Exposure assessment; Filtered water; Urine.
© 2022. The Author(s).
Conflict of interest statement
The authors declare no competing interests.
Figures
References
-
- Richardson SD, Plewa MJ, Wagner ED, Schoeny R, DeMarini DM. Occurrence, genotoxicity, and carcinogenicity of regulated and emerging disinfection by-products in drinking water: a review and roadmap for research. Mutat Res Rev Mutat Res. 2007;636:178–242. doi: 10.1016/j.mrrev.2007.09.001. - DOI - PubMed
-
- Costet N, Villanueva CM, Jaakkola JJK, Kogevinas M, Cantor KP, King WD, et al. Water disinfection by-products and bladder cancer: is there a European specificity? A pooled and meta-analysis of European case-control studies. Occup Environ Med. 2011;68. 10.1136/oem.2010.062703. - PubMed
Publication types
MeSH terms
Substances
LinkOut - more resources
Full Text Sources
Medical
Miscellaneous
