

Multi-block data integration analysis for identifying and validating targeted N-glycans as biomarkers for type II diabetes mellitus
- PMID: 35768493
- PMCID: PMC9243128
- DOI: 10.1038/s41598-022-15172-z
Multi-block data integration analysis for identifying and validating targeted N-glycans as biomarkers for type II diabetes mellitus
Erratum in
-
Author Correction: Multi-block data integration analysis for identifying and validating targeted N-glycans as biomarkers for type II diabetes mellitus.Sci Rep. 2022 Oct 5;12(1):16610. doi: 10.1038/s41598-022-21099-2. Sci Rep. 2022. PMID: 36198855 Free PMC article. No abstract available.
Abstract
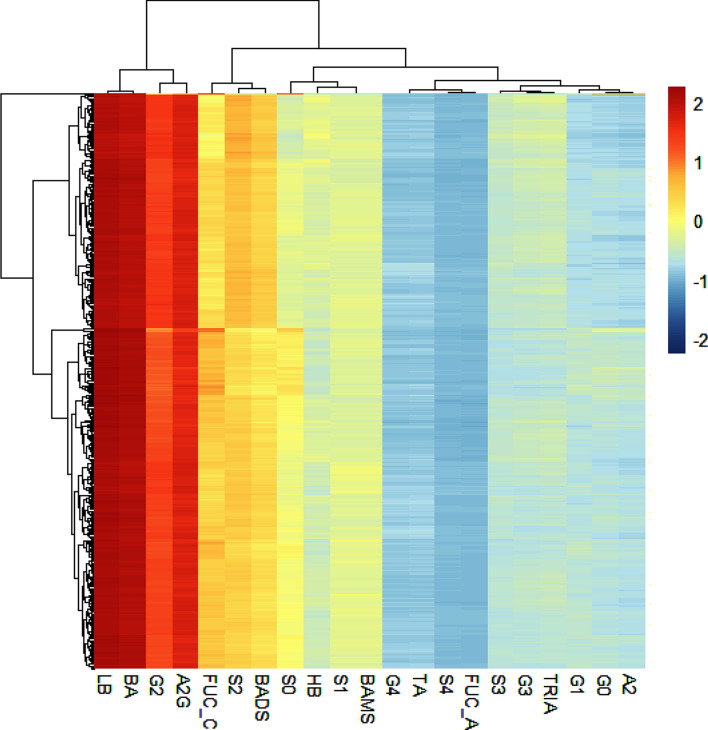
Plasma N-glycan profiles have been shown to be defective in type II diabetes Mellitus (T2DM) and holds a promise to discovering biomarkers. The study comprised 232 T2DM patients and 219 healthy individuals. N-glycans were analysed by high-performance liquid chromatography. The multivariate integrative framework, DIABLO was employed for the statistical analysis. N-glycan groups (GPs 34, 32, 26, 31, 36 and 30) were significantly expressed in T2DM in component 1 and GPs 38 and 20 were related to T2DM in component 2. Four clusters were observed based on the correlation of the expressive signatures of the 39 N-glycans across T2DM and controls. Cluster A, B, C and D had 16, 16, 4 and 3 N-glycans respectively, of which 11, 8, 1 and 1 were found to express differently between controls and T2DM in a univariate analysis [Formula: see text]. Multi-block analysis revealed that trigalactosylated (G3), triantennary (TRIA), high branching (HB) and trisialylated (S3) expressed significantly highly in T2DM than healthy controls. A bipartite relevance network revealed that HB, monogalactosylated (G1) and G3 were central in the network and observed more connections, highlighting their importance in discriminating between T2DM and healthy controls. Investigation of these N-glycans can enhance the understanding of T2DM.
© 2022. The Author(s).
Conflict of interest statement
The authors declare no competing interests.
Figures


Similar articles
-
High throughput profiling of whole plasma N-glycans in type II diabetes mellitus patients and healthy individuals: A perspective from a Ghanaian population.Arch Biochem Biophys. 2019 Jan;661:10-21. doi: 10.1016/j.abb.2018.10.015. Epub 2018 Oct 24. Arch Biochem Biophys. 2019. PMID: 30365935 Clinical Trial.
-
Quantitative levels of serum N-glycans in type 1 diabetes and their association with kidney disease.Glycobiology. 2021 Jun 3;31(5):613-623. doi: 10.1093/glycob/cwaa106. Glycobiology. 2021. PMID: 33245334
-
Type 2 Diabetes Mellitus is Associated with the Immunoglobulin G N-Glycome through Putative Proinflammatory Mechanisms in an Australian Population.OMICS. 2019 Dec;23(12):631-639. doi: 10.1089/omi.2019.0075. Epub 2019 Sep 17. OMICS. 2019. PMID: 31526239
-
Inflammation, oxidative stress and mitochondrial dysfunction in the progression of type II diabetes mellitus with coexisting hypertension.Front Endocrinol (Lausanne). 2023 Jun 13;14:1173402. doi: 10.3389/fendo.2023.1173402. eCollection 2023. Front Endocrinol (Lausanne). 2023. PMID: 37383391 Free PMC article. Review.
-
Metabolite biomarkers of type 2 diabetes mellitus and pre-diabetes: a systematic review and meta-analysis.BMC Endocr Disord. 2020 Nov 23;20(1):174. doi: 10.1186/s12902-020-00653-x. BMC Endocr Disord. 2020. PMID: 33228610 Free PMC article.
Cited by
-
Pathways to chronic disease detection and prediction: Mapping the potential of machine learning to the pathophysiological processes while navigating ethical challenges.Chronic Dis Transl Med. 2024 Jun 9;11(1):1-21. doi: 10.1002/cdt3.137. eCollection 2025 Mar. Chronic Dis Transl Med. 2024. PMID: 40051825 Free PMC article. Review.
-
Not-So-Sweet Dreams: Plasma and IgG N-Glycome in the Severe Form of the Obstructive Sleep Apnea.Biomolecules. 2023 May 23;13(6):880. doi: 10.3390/biom13060880. Biomolecules. 2023. PMID: 37371460 Free PMC article.
-
Perturbation of 3D nuclear architecture, epigenomic dysregulation and aging, and cannabinoid synaptopathy reconfigures conceptualization of cannabinoid pathophysiology: part 1-aging and epigenomics.Front Psychiatry. 2023 Sep 5;14:1182535. doi: 10.3389/fpsyt.2023.1182535. eCollection 2023. Front Psychiatry. 2023. PMID: 37732074 Free PMC article. Review.
-
Conceptualised psycho-medical footprint for health status outcomes and the potential impacts for early detection and prevention of chronic diseases in the context of 3P medicine.EPMA J. 2023 Nov 8;14(4):585-599. doi: 10.1007/s13167-023-00344-2. eCollection 2023 Dec. EPMA J. 2023. PMID: 38094584 Free PMC article.
-
Antidiabetic activity of Tartary buckwheat protein-derived peptide AFYRW and its effects on protein glycosylation of pancreas in mice.Amino Acids. 2023 Aug;55(8):1063-1071. doi: 10.1007/s00726-023-03294-1. Epub 2023 Jun 21. Amino Acids. 2023. PMID: 37341830
References
-
- Adua E, Afrifa-Yamoah E, Amankwah B, Obirikorang C, Odame Anto E, Acheampong E, Wang W, Yarney Tetteh A. Predictive model and feature importance for early detection of type II diabetes mellitus. Transl. Med. Commun. 2021;1:1–15.
-
- Polonsky KS. The past 200 years in diabetes. N. Engl. J. Med. 2012;367:1332–1340. - PubMed
-
- Adua E, et al. High throughput profiling of whole plasma N-glycans in type II diabetes mellitus patients and healthy individuals: A perspective from a Ghanaian population. Arch. Biochem. Biophys. 2019;661:10–21. - PubMed
Publication types
MeSH terms
Substances
LinkOut - more resources
Full Text Sources
Other Literature Sources
Medical
