. 2022 Aug;32(8):744-760.
doi: 10.1038/s41422-022-00676-0. Epub 2022 Jun 29.

CTCF organizes inter-A compartment interactions through RYBP-dependent phase separation

Affiliations

CTCF organizes inter-A compartment interactions through RYBP-dependent phase separation

Chao Wei et al. Cell Res. 2022 Aug.

Abstract

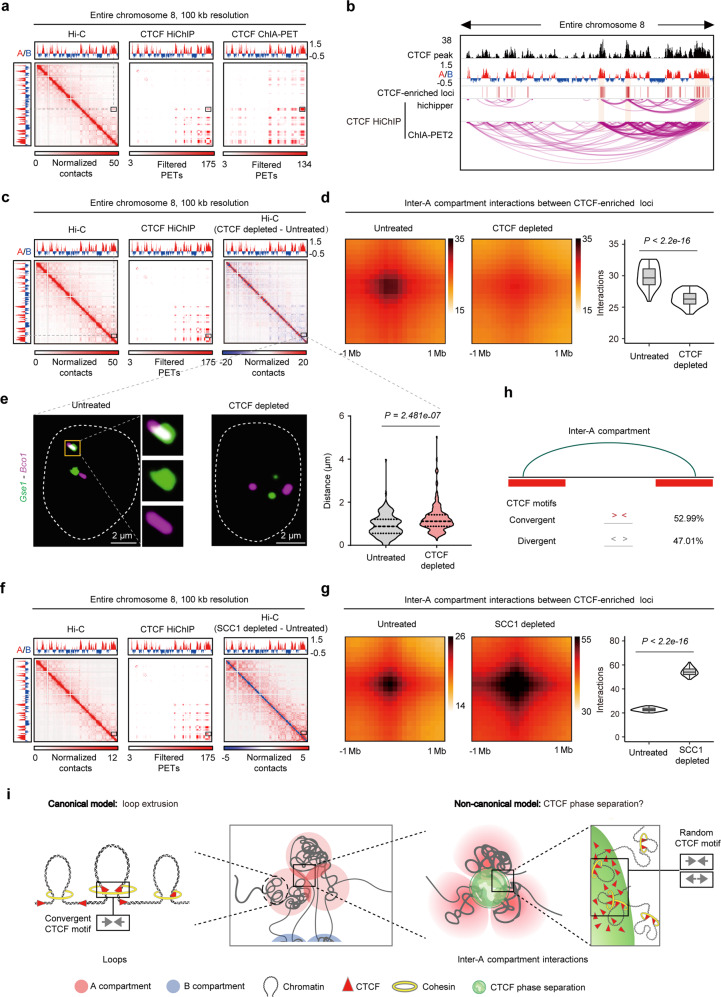
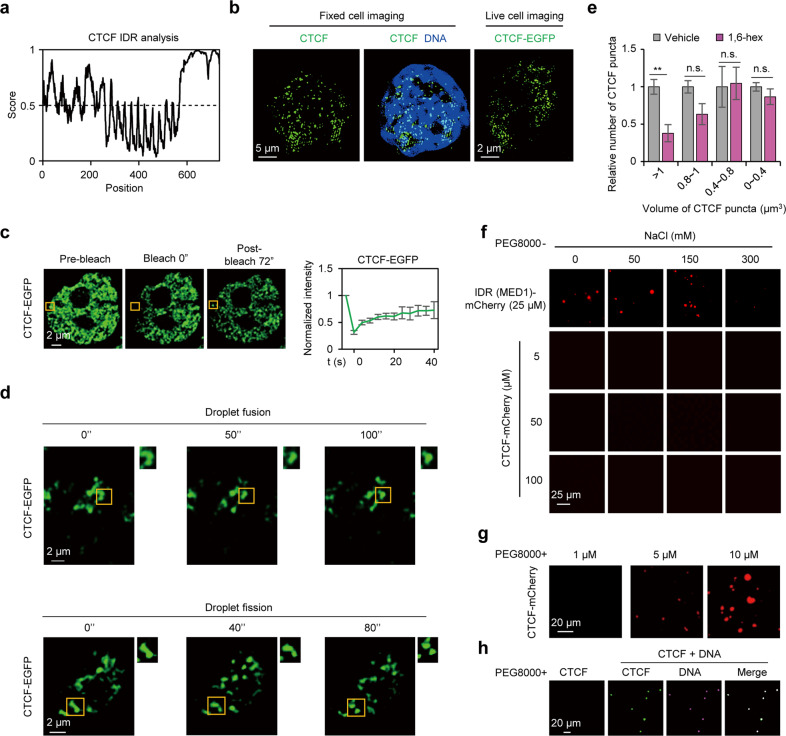
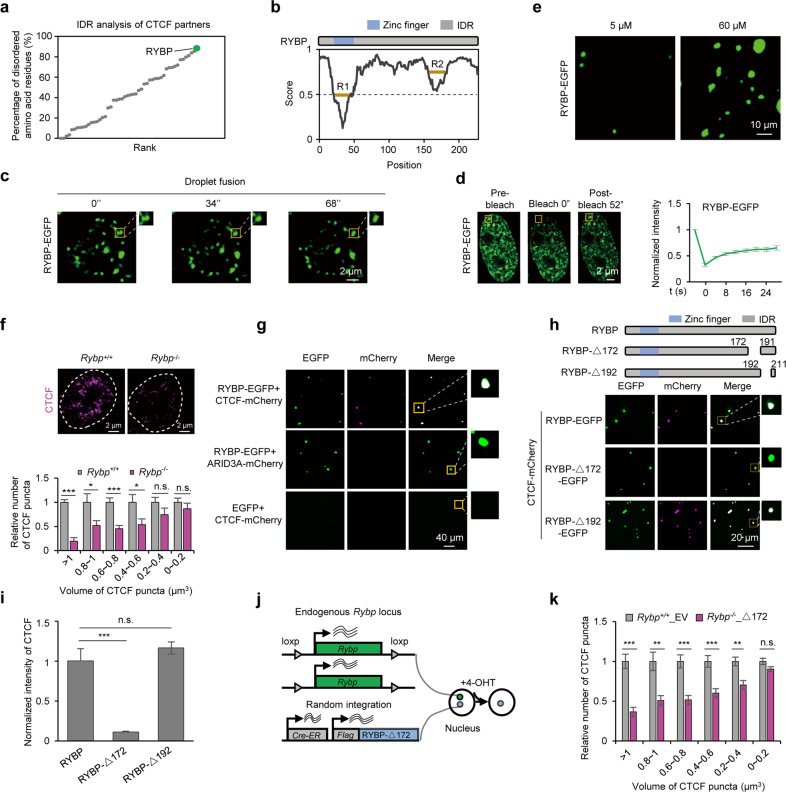
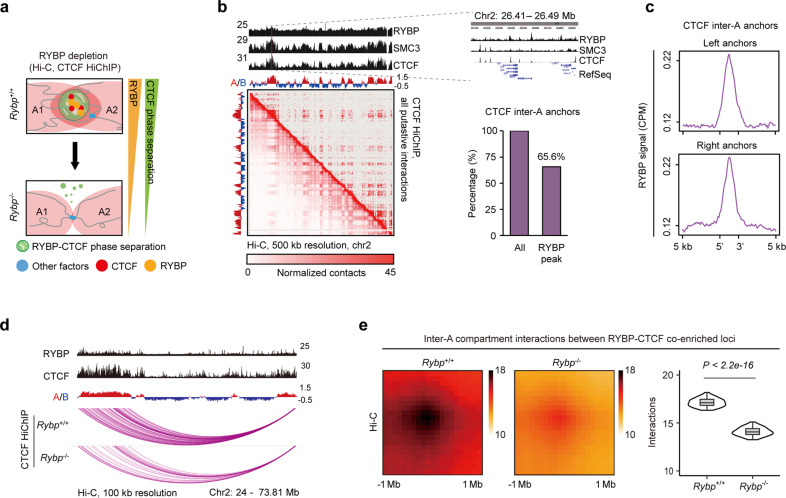
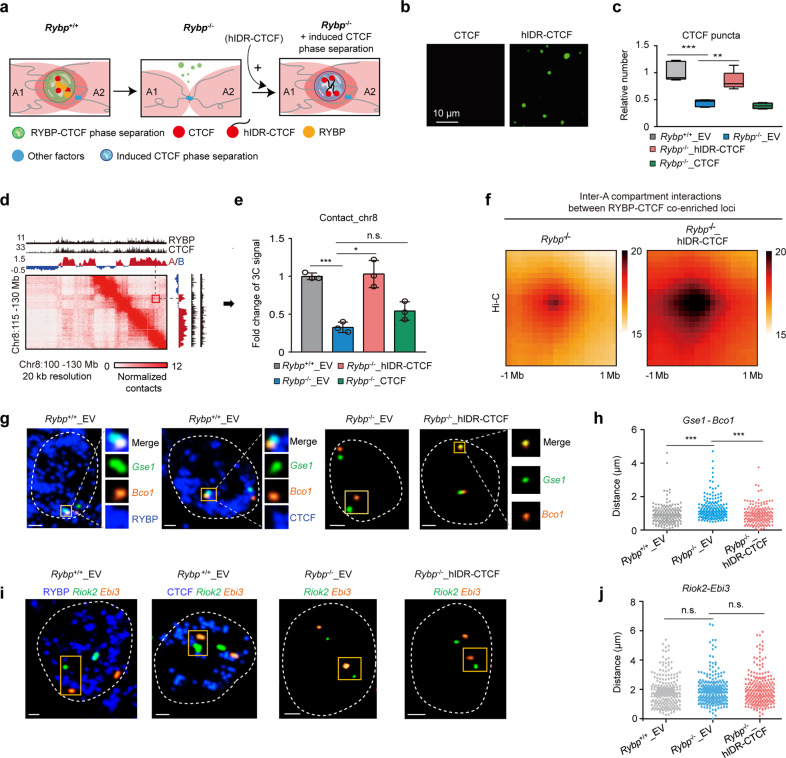
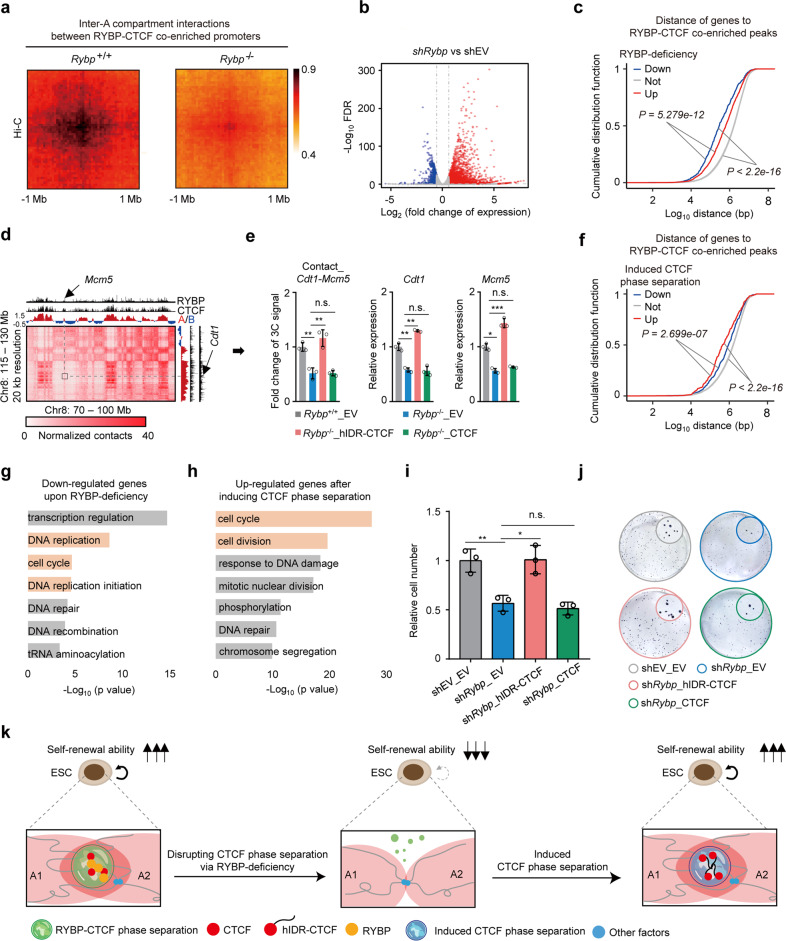
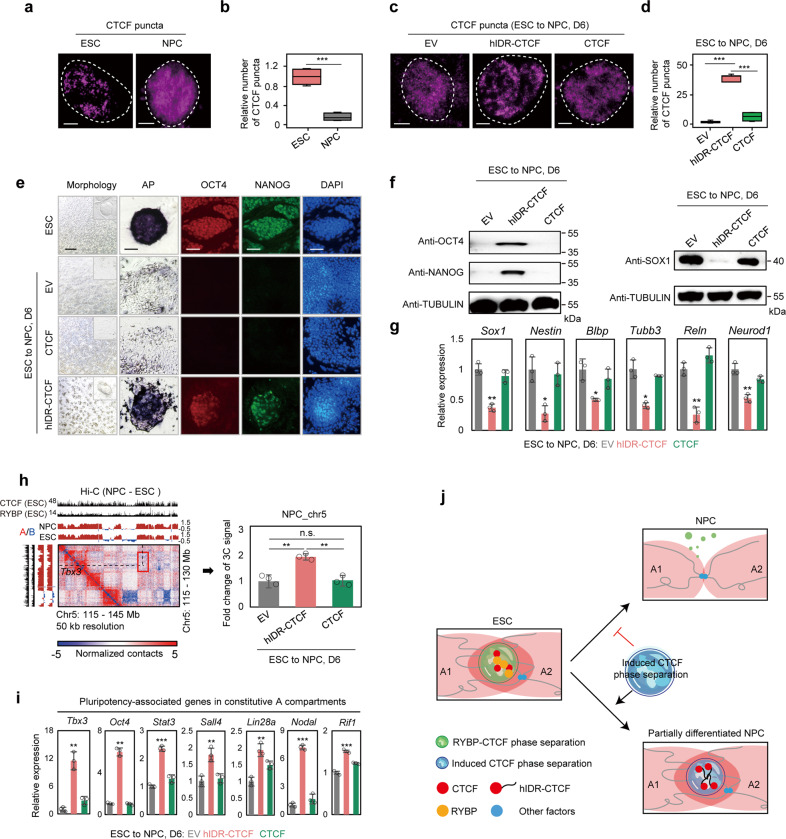
Chromatin is spatially organized into three-dimensional structures at different levels including A/B compartments, topologically associating domains and loops. The canonical CTCF-mediated loop extrusion model can explain the formation of loops. However, the organization mechanisms underlying long-range chromatin interactions such as interactions between A-A compartments are still poorly understood. Here we show that different from the canonical loop extrusion model, RYBP-mediated phase separation of CTCF organizes inter-A compartment interactions. Based on this model, we designed and verified an induced CTCF phase separation system in embryonic stem cells (ESCs), which facilitated inter-A compartment interactions, improved self-renewal of ESCs and inhibited their differentiation toward neural progenitor cells. These findings support a novel and non-canonical role of CTCF in organizing long-range chromatin interactions via phase separation.


Conflict of interest statement

The authors declare no competing interests.

Figures

Fig. 1
Fig. 1. CTCF organizes inter-A compartment interactions.
a In situ Hi-C contact heatmaps (left, GSE98671), CTCF HiChIP and CTCF ChIA-PET (right, GSM2645441) defined CTCF-connected regions (see Materials and Methods) across the entire chromosome 8. The black boxes denote inter-A compartment interactions. b CTCF HiChIP data showing inter-A compartment CTCF contacts at chromosome 8. c In situ Hi-C contact heatmaps (left), CTCF-connected regions and a subtracted Hi-C contact heatmap (right) across the entire chromosome 8. Hi-C data were from GEO: GSE98671. d Aggregate peak analysis (APA) plots (left) and quantitation (right) showing the genome-wide aggregate strength between CTCF-enriched loci (see Materials and Methods) from different A compartments after CTCF depletion, Wilcoxon rank-sum test. Hi-C data from GEO: GSE98671 were analyzed. e Representative images (left) and quantification (right) of DNA FISH displaying the distance change between Gse1 (green) and Bco1 (magenta) after CTCF depletion. The two genes locate at CTCF-enriched loci from different A compartments (box in c). Welch’s t-test; untreated: n = 194; CTCF depleted: n = 194. f Hi-C map at the entire chromosome 8 (left). CTCF-connected regions across the entire chromosome 8 (middle). Hi-C contact heatmap (SCC1 depleted – untreated) of the entire chromosome 8 (right). The accession number of SCC1 Hi-C data is E-MTAB-7816 (ArrayExpress). g APA plots (left) and quantitation (right) showing the genome-wide aggregate strength between CTCF-enriched loci from different A compartments after SCC1 depletion (Hi-C data), Wilcoxon rank-sum test. h Statistics of CTCF motif orientation at CTCF-enriched peaks between two different A compartments. i Distinct models of CTCF functions in organizing loops and interactions between A compartments. For loops, chromatin structures are organized via canonical loop extrusion model, which depends on cohesin and retention of CTCF at two convergent CTCF motifs (left). For long-range chromatin interactions, CTCF also organizes interactions between A compartments; this organization does not preferentially rely on cohesin and convergent CTCF motifs (right), and possibly occurs via CTCF phase separation.
Fig. 2
Fig. 2. CTCF exhibits phase separation behavior in the nucleus.
a Mouse CTCF is an intrinsically disordered protein predicted by IUPred2A; the score > 0.5 indicates IDR. b SIM microscopic images of CTCF immunofluorescence and live cell imaging in ESCs. Live imaging of ESCs expressing an EGFP-tagged CTCF. c Representative images (left) and quantification (right) of FRAP in ESCs expressing exogenous CTCF-EGFP. The yellow box highlights the bleached puncta. Data are plotted as means ± SEM, n = 3. d Droplet fusion and fission behavior of CTCF puncta in CTCF-EGFP ESCs. e Relative number of different volumes of CTCF puncta upon 1.5% 1,6-hex treatment. Welch’s t-test; vehicle, n = 60 cells; 1,6-hex, n = 82 cells. P values are (from left to right): P = 0.0045, P = 0.0632, P = 0.8989, P = 0.3059. f Representative images of droplet formation at different concentrations of NaCl and proteins. g Representative images of droplet formation at 1 µM, 5 µM and 10 µM CTCF in the presence of 20% PEG8000. h Representative images of CTCF-mCherry aggregation after addition of Cy5-labbled 25 × DNA motif. The concentration of CTCF-mCherry was 0.8 µM. n.s., not significant, P > 0.05; **P < 0.01.
Fig. 3
Fig. 3. RYBP facilitates CTCF to undergo phase separation.
a IDR analysis of CTCF partners, the involved interaction partners of CTCF were extracted from the BIOGRID database. Polycomb group components were also analyzed, since Polycomb body is reported to co-localize with CTCF. b RYBP is an intrinsically disordered protein predicted by IUPred2A. R1 and R2 denote the relatively low disordered regions of RYBP. c Droplet fusion behavior of RYBP puncta in an EGFP-tagged RYBP-expressing ESC (RYBP-EGFP ESC). d Representative FRAP images (left) and quantification (right) in ESCs expressing exogenous RYBP-EGFP, n = 3. The yellow box denotes the bleached puncta. e Representative images showing droplet formation of 5 µM and 60 µM RYBP-EGFP recombinant protein. f Representative immunofluorescence images (top) and statistics (bottom) of CTCF puncta before and after RYBP depletion. Welch’s t-test; Rybp+/+, n = 61 cells; Rybp–/–, n = 37 cells. P values are (from left to right): P = 7.47e–06, P = 0.0465, P = 0.0008, P = 0.0466, P = 0.1662, P = 0.3842. g RYBP droplets incorporate CTCF protein in vitro without PEG8000. The concentration of RYBP-EGFP and EGFP was 60 µM; the concentration of CTCF-mCherry and ARID3A-mCherry was 10 µM. h Top: experimental pipeline for the mutational strategy of RYBP. Bottom: full-length or mutant RYBP droplets incorporate CTCF protein without PEG8000 in vitro. The concentration of RYBP-EGFP, RYBP-Δ172-EGFP and RYBP-Δ192-EGFP was 60 µM; the concentration of CTCF-mCherry and mCherry was 10 µM. i Normalized intensity of CTCF in full-length or mutant RYBP droplets. Welch’s t-test; RYBP, n = 25; RYBP-Δ172, n = 35; RYBP-Δ192, n = 23. P values are (from left to right): P = 9.028e–06, P = 0.064. j Experimental pipeline for the construction of RYBP mutant cell line. k Relative number of different volumes of CTCF puncta in Rybp+/+_EV or Rybp–/–_Δ172 cell lines. Welch’s t-test; Rybp+/+_EV, n = 85 cells; Rybp–/–_Δ172, n = 164 cells. P values are (from left to right): P = 6.59e–05, P = 0.0032, P = 0.0003, P = 0.0007, P = 0.0015, P = 0.0736. n.s., not significant, P > 0.05; *P < 0.05; **P < 0.01; ***P < 0.001.
Fig. 4
Fig. 4. RYBP depletion attenuates CTCF-mediated inter-A compartment interactions.
a Schematic diagram showing the experimental detection of the interaction alteration between A compartments after RYBP depletion using Hi-C and CTCF HiChIP. A1 and A2 denote different A compartments. b The RYBP, SMC1 and CTCF ChIP peaks across chromosome 2 (top). Hi-C and CTCF HiChIP contact heatmaps at 500-kb resolution across the entire chromosome 2 (bottom left). Percentage of CTCF inter-A anchors with RYBP peak (bottom right). c RYBP ChIP-seq signal at CTCF inter-A anchors. d A representative region of two A compartments showing the putative interactions before or after RYBP depletion (CTCF HiChIP). e APA plots (left) and quantitation (right) showing the genome-wide aggregate strength between RYBP–CTCF co-enriched loci from different A compartments after RYBP depletion (Hi-C data), Wilcoxon rank-sum test.
Fig. 5
Fig. 5. Induced CTCF phase separation restores inter-A compartment interactions impaired by RYBP depletion.
a Experimental schematic; A1 and A2 denote different A compartments. b Droplet formation of recombinant CTCF and hIDR-CTCF proteins without PEG8000; the protein concentration was 10 µM. c Boxplot showing the relative number of highly concentrated CTCF puncta in different groups. Rybp+/+_EV denotes the empty vector-expressing Rybp+/+ ESCs; Rybp–/–_EV denotes the empty vector-expressing Rybp–/– ESCs; Rybp–/–_hIDR-CTCF denotes the hIDR-CTCF-expressing Rybp–/– ESCs; Rybp–/–_CTCF denotes the WT CTCF-expressing Rybp–/– ESCs. Welch’s t-test; n values are (from left to right): n = 65 cells, n = 133 cells, n = 93 cells. n = 150 cells. P values at top are (from left to right): P = 0.0001551, P = 0.003076. d A representative region of Hi-C contact maps; red fragment showing the contacts between the two A compartments. e 3C-qPCR showing the interaction alteration between two RYBP–CTCF co-enriched loci from different A compartments (red box in d). Welch’s t-test; n = 3. P values at top are (from left to right): P = 0.0004, P = 0.0124, P = 0.0723. f APA plots showing the genome-wide aggregate strength between RYBP–CTCF co-enriched loci from different A compartments after inducing CTCF phase separation (Hi-C data). g DNA FISH coupled with RYBP or CTCF immunofluorescence displaying the distance change between Gse1 (green) and Bco1 (yellow) in different cell lines. The two genes are localized in RYBP–CTCF co-enriched loci. All the scale bars denote 2 μm. h The distance change between Gse1 and Bco1 in different cell lines. Welch’s t-test; Rybp+/+_EV: n = 167; Rybp–/–_EV: n = 154; Rybp–/–_hIDR-CTCF: n = 175. P values are (from left to right): P = 5.12e–07, P = 5.782e–08; Welch’s t-test. i DNA FISH coupled with RYBP or CTCF immunofluorescence displaying the distance change of Riok2 (green) and Ebi3 (yellow) in different cell lines which is used as a negative control. All the scale bars denote 2 μm. j The distance change between Ebi3 and Riok2 in different cell lines. Welch’s t-test; n values are (from left to right): n = 158, n = 179, n = 194. P values are (from left to right): P = 0.3864, P = 0.4016; Welch’s t-test. qPCR data show means ± SD. n.s., not significant, P > 0.05; **P < 0.01; ***P < 0.001.
Fig. 6
Fig. 6. Induced CTCF phase separation improves self-renewal of ESCs.
a APA plots showing the genome-wide aggregate strength between RYBP–CTCF co-enriched promoters (see Materials and Methods) from different A compartments after RYBP depletion (Hi-C data). b Volcano plot showing the expression change of genes in A compartments after Rybp knockdown for 96 h. c Cumulative distribution showing the distance of gene promoters to their closest RYBP–CTCF co-enriched peaks (see Materials and Methods) between A compartments after RYBP knockdown. ‘Up’, ‘Down’ and ‘Not’ represent that those genes were up-regulated, down-regulated and unchanged after Rybp knockdown, respectively; K-S test. d Representative region of Hi-C contact maps at the inter-compartment level with 20-kb resolution. Black box shows the interacted region between the two A compartments. e 3C-qPCR showing the interaction alteration between two genes from different A compartments (left). RT-qPCR (middle and right) showing the relative expression of these genes. The genomic positions analyzed by 3C-qPCR locate in RYBP–CTCF co-enriched loci. Welch’s t-test; P values are (from left to right): P = 0.0072, P = 0.0088, P = 0.9553, P = 0.0024, P = 0.0012, P = 0.8045, P = 0.0186, P = 2.033e–05, P = 0.5408; n = 3. f Cumulative distribution showing the distance of gene promoters to their closest RYBP–CTCF co-enriched peaks between A compartments after inducing CTCF phase separation (Rybp–/–_hIDR-CTCF vs Rybp–/–_EV); K-S test. g Gene ontology analysis showing the biological processes of genes that are down-regulated after Rybp knockdown. h Gene ontology analysis showing the biological processes of genes that are up-regulated after inducing CTCF phase separation in RYBP-depleted ESCs. i Relative cell number in different groups (see Materials and Methods); Welch’s t-test; n = 3; P values are (from left to right): P = 0.008904, P = 0.01705, P = 0.4265. j Colony formation assay (CFA) of ESCs in different groups. k A model showing the role of CTCF phase separation in self-renewal of ESCs. A1 and A2 denote different A compartments. n.s., not significant, P > 0.05; *P < 0.05; **P < 0.01; ***P < 0.001. qPCR data show means ± SD.
Fig. 7
Fig. 7. Induced CTCF phase separation inhibits ESC differentiation toward NPCs.
a Representative immunofluorescence images of CTCF puncta in ESCs and NPCs. Scale bar denotes 2 μm in each image. b Boxplot showing the relative number of highly concentrated CTCF puncta in ESCs and NPCs. Welch’s t-test; ESCs: n = 71 cells; NPCs: n = 169 cells; P = 7.271e–06. c Representative immunofluorescence images of CTCF puncta in ESC-derived cells, which were differentiated from ESCs to NPCs for 6 days. Prior to differentiation, ESCs stably expressed exogenous empty vector (EV), hIDR-CTCF, and CTCF, respectively. Scale bar denotes 2 μm in each image. d Boxplot showing the relative number of highly concentrated CTCF puncta in ESC-derived cells, which were differentiated from ESCs stably expressing EV, hIDR-CTCF and CTCF to NPCs for 6 days, respectively. Welch’s t-test; EV: n = 384 cells; hIDR-CTCF: n = 331 cells; CTCF: n = 327 cells. P values are (from left to right): P = 7.592e–09, P = 2.334e–05. Scale bar denotes 2 μm in each image. e Morphology, AP staining, immunofluorescence of ESCs and ESC-derived cells, which were differentiated from ESCs stably expressing EV, hIDR-CTCF and CTCF to NPCs for 6 days, respectively. The scale bar at ‘morphology’ row denotes 500 μm, the scale bars at rest rows denote 50 μm. f Western blot showing the expression of different proteins in ESC-derived cells, which were differentiated from ESCs stably expressing EV, hIDR-CTCF and CTCF to NPCs for 6 days, respectively. g Relative mRNA expression of NPC-associated genes in ESC-derived cells, which were differentiated from ESCs stably expressing EV, hIDR-CTCF and CTCF to NPCs for 6 days, respectively. Welch’s t-test. The difference between EV and hIDR-CTCF groups are (from left to right): P = 0.0013; P = 0.0109; P = 0.0365; P = 0.0147; P = 0.0016; P = 0.0031, n = 3. h A representative region of subtracted (NPC – ESC) Hi-C contact map at chromosome 5 (left). 3C-qPCR showing the interaction alteration between two RYBP–CTCF co-enriched loci from different constitutive A compartments (red box in left contact map) among ESC-derived cells (right). Welch’s t-test. P values are (from left to right): P = 0.0055, P = 0.4139, P = 0.002; n = 3. i Relative mRNA expression of pluripotency genes in ESC-derived cells. P values are (from left to right): P = 0.0082, P = 0.0017, P = 9.983e–05, P = 0.0071, P = 0.0034, P = 7.25e–06, P = 5.546e–05; n = 3; Welch’s t-test. j Schematic diagram showing the role of CTCF phase separation-mediated inter-A compartment interactions in ESC differentiation. During the differentiation of ESCs to NPCs, CTCF phase separation and inter-A compartment interactions decrease. Induced CTCF phase separation restores the inter-A compartment interactions, inhibits cell fate transition from ESCs to NPCs, and finally produces partially differentiated NPCs. A1 and A2 denote different A compartments. qPCR data show means ± SD. n.s., not significant, P > 0.05; *P < 0.05; **P < 0.01; ***P < 0.001.

References

    1. Lieberman-Aiden E, et al. Comprehensive mapping of long-range interactions reveals folding principles of the human genome. Science. 2009;326:289–293. doi: 10.1126/science.1181369. - DOI - PMC - PubMed
    1. Dixon JR, et al. Topological domains in mammalian genomes identified by analysis of chromatin interactions. Nature. 2012;485:376–380. doi: 10.1038/nature11082. - DOI - PMC - PubMed
    1. Fudenberg G, et al. Formation of chromosomal domains by loop extrusion. Cell Rep. 2016;15:2038–2049. doi: 10.1016/j.celrep.2016.04.085. - DOI - PMC - PubMed
    1. Weintraub AS, et al. YY1 is a structural regulator of enhancer-promoter loops. Cell. 2017;171:1573–1588.e28. doi: 10.1016/j.cell.2017.11.008. - DOI - PMC - PubMed
    1. Lupianez DG, et al. Disruptions of topological chromatin domains cause pathogenic rewiring of gene-enhancer interactions. Cell. 2015;161:1012–1025. doi: 10.1016/j.cell.2015.04.004. - DOI - PMC - PubMed

Publication types

MeSH terms