. 2022 Sep;609(7926):400-407.
doi: 10.1038/s41586-022-04838-3. Epub 2022 Jun 29.

Structural basis for SHOC2 modulation of RAS signalling

Affiliations

Structural basis for SHOC2 modulation of RAS signalling

Nicholas P D Liau et al. Nature. 2022 Sep.

Abstract

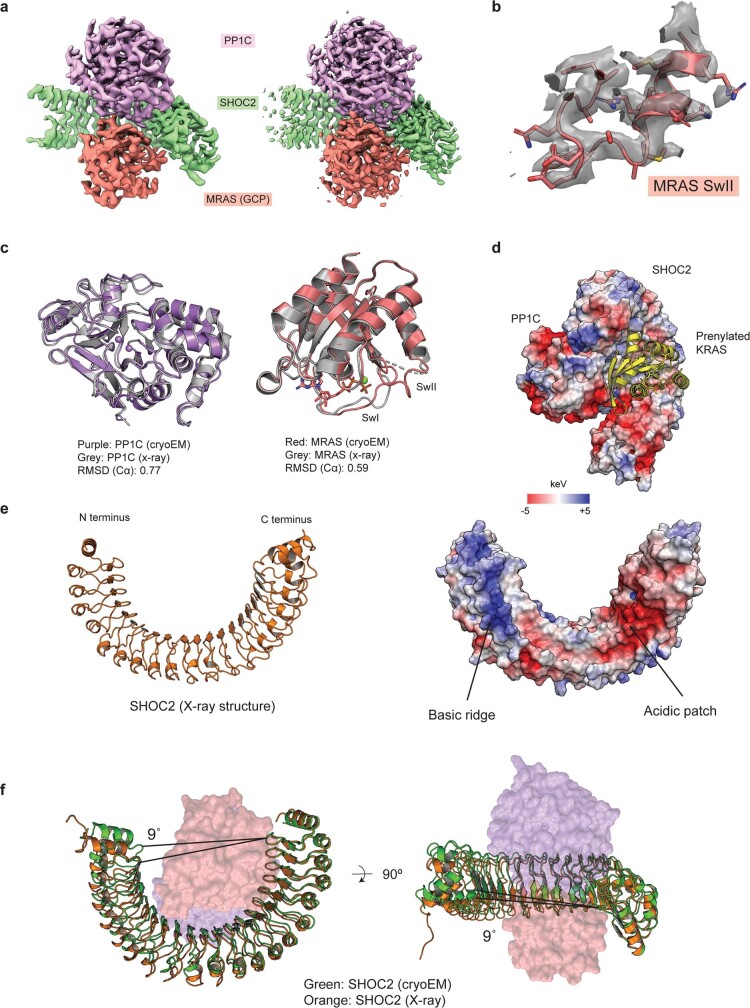
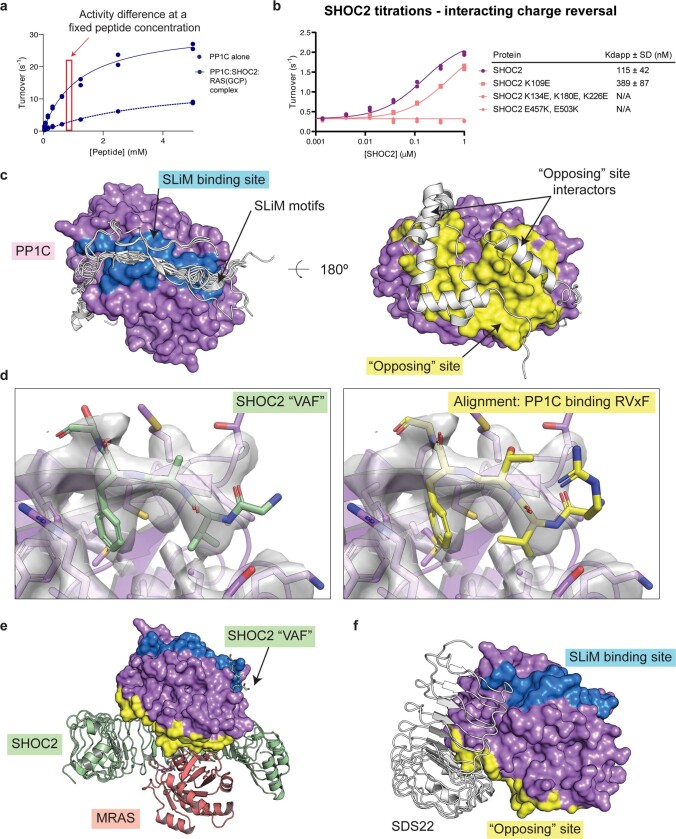
The RAS-RAF pathway is one of the most commonly dysregulated in human cancers1-3. Despite decades of study, understanding of the molecular mechanisms underlying dimerization and activation4 of the kinase RAF remains limited. Recent structures of inactive RAF monomer5 and active RAF dimer5-8 bound to 14-3-39,10 have revealed the mechanisms by which 14-3-3 stabilizes both RAF conformations via specific phosphoserine residues. Prior to RAF dimerization, the protein phosphatase 1 catalytic subunit (PP1C) must dephosphorylate the N-terminal phosphoserine (NTpS) of RAF11 to relieve inhibition by 14-3-3, although PP1C in isolation lacks intrinsic substrate selectivity. SHOC2 is as an essential scaffolding protein that engages both PP1C and RAS to dephosphorylate RAF NTpS11-13, but the structure of SHOC2 and the architecture of the presumptive SHOC2-PP1C-RAS complex remain unknown. Here we present a cryo-electron microscopy structure of the SHOC2-PP1C-MRAS complex to an overall resolution of 3 Å, revealing a tripartite molecular architecture in which a crescent-shaped SHOC2 acts as a cradle and brings together PP1C and MRAS. Our work demonstrates the GTP dependence of multiple RAS isoforms for complex formation, delineates the RAS-isoform preference for complex assembly, and uncovers how the SHOC2 scaffold and RAS collectively drive specificity of PP1C for RAF NTpS. Our data indicate that disease-relevant mutations affect complex assembly, reveal the simultaneous requirement of two RAS molecules for RAF activation, and establish rational avenues for discovery of new classes of inhibitors to target this pathway.


Conflict of interest statement

N.P.D.L., M.J., L.G., S.I., J.M.B., T.J.W., W.P. and J.S. are all employees of Genentech.

Figures

Fig. 1
Fig. 1. SHOC2, PP1C and MRAS form a three-way complex in a GTP-dependent manner.
a, SEC traces showing three-way SHOC2–PP1C–MRAS complex formation in the presence of MRAS(GCP) but not in the presence of MRAS(GDP) (top), with SDS–PAGE analysis of SEC fractions (bottom). Results are representative of two independent experiments. b, Cryo-EM density map of SHOC2 (green) PP1C (purple) MRAS (salmon) complex, unsharpened. c, Structure of the SHOC2–PP1C–MRAS complex showing GCP (yellow) and the PP1C active site exposed to solvent for substrate binding. d, Model of the SHOC2–PP1C–RAS complex anchored to the membrane via the prenylated C terminus of RAS (salmon shows MRAS(GCP) modelled with the C-terminal helix of farnesylated KRAS; Protein Data Bank (PDB) ID: 5TAR).
Fig. 2
Fig. 2. PP1C binds SHOC2 predominantly via complementary electrostatic interactions, whereas MRAS binds SHOC2 via its switch I and II regions.
a, Electrostatic surfaces of SHOC2 and PP1C create a complementary binding interface between acidic (red) and basic (blue) patches. MRAS is omitted for clarity. b, MRAS(GCP) (salmon) interacts with SHOC2 (green) via its switch I and II regions (dark red). Alignment of the switch I and II regions of GDP-bound KRAS (PDB: 4OBE) (yellow) showing selected sidechains (spheres), reveals steric clashes with SHOC2. PP1C is omitted for clarity. c, Detailed view of MRAS(GCP) switch I (salmon, top) and switch II (salmon, bottom) interactions with SHOC2 (green), with key hydrogen bonds and π-stacking interactions shown as dashed lines. d, RAS (salmon) with SHOC2 (green) and PP1C (purple) binding interfaces highlighted (left), which have considerable overlap with the RAF RBD–CRD binding surface (yellow, right).
Fig. 3
Fig. 3. Different RAS isoforms have a role in the SHOC2–PP1C complex.
a, Top, representative result of TR-FRET measuring association between PP1C and SHOC2 in the presence of varying RAS concentrations. Data represent two time points (n = 2). Bottom, table summarizing KDapp from two independently performed experiments (n = 2). MRAS(GCP) is the highest-affinity binding partner of SHOC2–PP1C among those tested. KDapp values (shown as mean ± s.d.) are a measure of relative affinity and depend on PP1C and SHOC2 concentrations. [PP1C] = 2 nM, [SHOC2] = 200 nM. b, MRAS switch I PP1C-contacting regions (salmon) bound to PP1C (purple). Residues unique to MRAS versus H/K/NRAS (yellow) make substantial contacts with PP1C. SHOC2 is omitted for clarity. c, DepMap chronos scores for 1,061 cancer cell lines (dots) for SHOC2 versus MRAS (left) or versus the minimum chronos score among H/K/NRAS (lowest score among each of the three possible RAS isoforms for each cell line), in which cell lines are identified by the RAS isoform with minimal chronos score (shape) and the hotspot mutational status of that isoform (colour) (right). Dashed lines encapsulate cell lines with strong co-dependency (chronos scores < −0.75). d, Pearson correlation coefficient (bars) and P-value from two-sided t-test (colour) calculated using DepMap chronos scores for SHOC2 versus HRAS, KRAS, NRAS or MRAS in which cell lines (n = 1,061) were grouped by hotspot mutational status of Ras isoforms.
Fig. 4
Fig. 4. SHOC2–PP1C–RAS substrate recognition and biological mutations.
a, Mutations showing gain of function (SHOC2 M173I (top right), SHOC2(Q269H/H270Y) (bottom left) and PP1C(P50R) (bottom right)) or loss of function (SHOC2(E457K) (top left) and SHOC2(D175N) (top right)) map to interfaces in the ternary complex. b, Representative plot of SHOC2 titrations for SHOC2 mutants (top) or PP1C mutant (bottom) showing KDapp of SHOC2. [PP1C] = 25 nM, [MRAS(GCP)] = 1 µM. Data represent peptide substrate dephosphorylation at 2 min and 4 min time points (n = 2). Right, summary table showing SHOC2 KDapp from three independent experiments (n = 3). WT, wild type. c, Catalytic efficiency of peptide dephosphorylation by PP1C or SHOC2–PP1C–RAS. Catalytic efficiency is increased when SHOC2–RAS is present. Data are mean ± s.d. (n = 3). P values calculated from Tukey’s multiple comparison test (one sided). ***P = 0.001, ****P ≤ 0.001. NS, not significant. BRAF pS729: P = 0.9942, phosphorylase A pS15 (Phos. A): P > 0.9999. d,e, The C terminus of SHOC2, showing residue conservation (d) and electrostatic potential (e). f, Quantification of the pS+13 (pS+12 in BRAF) (peptide hydrophobic residues) to Ile669 (in the SHOC2 hydrophobic groove) distance over the course of four GaMD simulations (left), with average root mean squared deviation (r.m.s.d.) from each of four independent simulations (n = 4) (right). Data are mean ± s.e.m. g, Four stable states of CRAF NTpS (yellow) from PCA peaks (Extended Data Fig. 10a), showing interaction of the peptide with the SHOC2 hydrophobic groove. PP1C and peptide N termini are omitted for clarity. Models are aligned by SHOC2 C terminus, only one SHOC2 molecule is shown for clarity.
Extended Data Fig. 1
Extended Data Fig. 1. SHOC2:PP1C complex formation with RAS isoforms.
a, Nucleotide loaded RAS samples were analyzed by mass spectrometry, which found complete loading of GDP or GCP for each sample. b, SEC traces showing three-way complex formation between KRASΔHVR (top left), HRAS (bottom left), NRAS (top right) and KRAS4B (bottom right) in the presence of GCP loaded RAS (blue) but not GDP loaded RAS (red), and associated SDS-PAGE analysis of SEC fractions. Results representative of two independent experiments.
Extended Data Fig. 2
Extended Data Fig. 2. SHOC2:PP1C:RAS complex functional validation.
a, SPR data showing that KRAS(GNP) associates with SHOC2:PP1C, but not KRAS(GDP). b, Nucleotide bound KRAS does not show binding to PP1C alone nor c, SHOC2 alone, showing that binding in a is due to RAS binding the SHOC2:PP1C complex. d, SEC traces (top) showing SHOC2 does not associate with KRAS(GCP) (green) or MRAS(GCP) (orange) in the absence of PP1C, and associated SDS-PAGE analysis of SEC fractions (bottom). Results representative two independent experiments. e, Representative plot of dephosphorylation of BRAF NTpS phosphopeptide by 10 nM PP1C or 10 nM PP1C + 1 µM SHOC2 + 10 µM KRAS(GCP). Data points show 2 and 4 min time points (n = 2).
Extended Data Fig. 3
Extended Data Fig. 3. Cryo-EM structure of SHOC2:PP1C:MRAS(GCP).
a, Representative micrograph (from 10,870 collected) of SHOC2:PP1C:MRAS(GCP) on graphene oxide containing grids. The far left of the image is gold substrate, the region in the center is vitreous ice, and the right is a single layer of graphene oxide with adsorbed protein complex. b, Representative 2D class averages of SHOC2:PP1C:MRAS (top) show well resolved trimeric complex and more poorly resolved hexameric complex, with a range of views on graphene oxide. SHOC2:PP1C:KRAS complex (bottom left) shows only trimeric complex, but preferred orientation without graphene oxide. SHOC2:PP1C:KRAS on graphene oxide (bottom right) shows complex dissociation. c, FSC between two half datasets yielded a resolution estimate of 2.95 Å. d, Angular distribution map of SHOC2:PP1C:MRAS reconstruction. Particles show a preferred orientation, but sufficient other views were obtained with the use of graphene oxide to obtain a 3D reconstruction. e, Local resolution estimate map indicates flexibility of the C terminal portion of the SHOC2 LRR. f, cryo-EM data processing scheme, details described in methods.
Extended Data Fig 4
Extended Data Fig 4. Cryo-EM and x-ray structure comparisons.
a, Unsharpened cryoEM map of SHOC2:PP1C:MRAS complex contoured to 0.15 (left). Sharpened cryoEM map of SHOC2:PP1C:MRAS complex contoured to 0.35 (sharpening B factor = −110 Å2)(right). Density is not observable for the SHOC2 C-terminus at these contours. b, Example model and sharpened density of MRAS SwII region. c, left, PP1C from cryoEM structure (purple) aligned with PP1C x-ray structure (PDB: 4MOV). Right, MRAS(GCP) from cryoEM structure (salmon) aligned with MRAS(GNP) x-ray structure (PDB: 1X1S). d, Electrostatic view of SHOC2 and PP1C showing basic and acidic regions (blue/white/red) with aligned model of prenylated MRAS model (based on PDB code 5TAR) (yellow), looking down from the membrane, which is parallel to the surface of the page. e, X-ray crystal structure of SHOC2 (orange, left) with electrostatic view showing basic and acidic regions (blue/white/red, right). f, Alignment of SHOC2:PP1C:MRAS cryoEM structure (green:purple:salmon) with SHOC2 x-ray structure (orange), performed using the N-terminal cap and first four LRRs of SHOC2. A 9° twist is evident between both structures relative to the 1st LRR.
Extended Data Fig. 5
Extended Data Fig. 5. SAXS analysis and contribution of the SHOC2 N terminus to complex formation.
a, SEC-MALS traces of SHOC2 (grey), SHOC2:PP1C (blue), SHOC2:PP1C:KRAS(GCP) (salmon) and SHOC2:PP1C:MRAS(GCP) (green). SHOC2 alone elutes as a dimer. SHOC2:PP1C:MRAS(GCP) exhibits trimer and hexamer peaks. Dashed rectangles represent frames used for subsequent in-line SAXS analysis. b, Distance distribution function (P(r)) for SHOC2 and complexes. SHOC2 exhibits a bimodal distribution showing a horseshoe shape. All proteins show an extended tail at high r values indicative of the unfolded SHOC2 N terminus. c, Experimental (black) SAXS curves of SHOC2:PP1C:MRAS, SHOC2:PP1C:KRAS, SHOC2:PP1C, and SHOC2 (top to bottom), overlaid with theoretical SAXS curves for single (orange) and multi-state models (green). Guinier plot for each experimental data (inset). d, Molecular models of SHOC2 and complexes (colored ribbon diagrams) overlaid with ab initio SAXS envelopes (grey). The bulge to the side of each molecular envelope represents the extended N-terminus of SHOC2 affecting calculation of the envelope. SHOC2:PP1C, SHOC2:PP1C:KRAS and SHOC2:PP1C:MRAS exhibit similar overall architectures. SHOC2, SHOC2:PP1C and SHOC2:PP1C:KRAS SAXS data are fit by a multi-state model determined by MultiFoXS, indicated by percentage labels, while SHOC2:PP1C:MRAS is well explained by a single state due to stable complex formation. Some dissociation of SHOC2:PP1C was observed in the absence of RAS. e, Residuals ((I(q)exp – I(q)model)/σ(q))) of SAXS models compared to data. Multi-state models result in lower Χ2 values than single state models for SHOC2, SHOC2:PP1C and SHOC2:PP1C:KRAS, whereas a single state model fits the data well for SHOC2:PP1C:MRAS. f, SAXS envelope (gray) calculated for SAXS curves of the SHOC2:PP1C:MRAS hexamer. Two atomistic models SHOC2:PP1C:MRAS cryo-EM structure were superimposed manually with the SAXS envelope, showing space exists for a 2:2:2 complex. The exact relative conformations of each molecule cannot be assigned from this data.
Extended Data Fig. 6
Extended Data Fig. 6. PP1C interaction sites.
a, Overview of technical principle of peptide dephosphorylation based affinity assays. At a fixed concentration of peptide, binding of SHOC2 and RAS will induce a higher PP1C catalytic activity. Data points are from two time points (n = 2) b, Representative plot of complex formation with different SHOC2 mutants. [PP1C] = 25 nM, [MRAS(GCP)] = 1 µM. Data points are from two time points (n = 2) (left). Table summarizing KDapp values for different SHOC2 mutants from three independent experiments (n = 3) (right). Mutation of SHOC2 charged patches reduces affinity beyond the limit of detection of the assay. c, Left, SLiM binding site (blue) on PP1C (purple), with structure of several interacting SLiMs (white), “Opposing” site (yellow) with structures of several interacting proteins (white). d, Detailed view of the SHOC2 N terminal “VAF” motif (green, left) binding to PP1C with unsharpened cryoEM map (grey surface). Alignment of an existing high resolution x-ray crystal structure containing an RVxF motif bound in this region (yellow, right, from PDB: 5INB) overlays well with the cryoEM map (grey surface). Alignments performed on PP1C. e, SHOC2:PP1C:MRAS cryoEM structure with SLiM (blue) and “opposing” (yellow) binding sites highlighted. The majority of SHOC2 interactions with PP1C are away from the SLiM binding and opposing sites. The SHOC2 “VAF” motif binds to the SLiM binding site. MRAS binds solely to the “opposing” site. f, SDS22 (white) is another LRR protein which interacts with PP1C, though utilizing different binding surfaces to SHOC2, bridging the SLiM and opposing sites.
Extended Data Fig. 7
Extended Data Fig. 7. SHOC2:PP1C:RAS interaction data.
a, SEC trace of complex formation between SHOC2ΔN, PP1C and KRAS(GCP) (orange) (top) with associated SDS-PAGE analysis of fractions (bottom). b, Peptide dephosphorylation showing KDapp for SHOC2 and SHOC2ΔN. [PP1C] = 25 nM, [MRAS(GCP)] = 1 µM. Data points are from two time points (n = 2) (left). Table summarizing KDapp values for three independent experiments (n = 3) (right). SHOC2ΔN has impaired affinity compared to SHOC2 WT. c, Structure of SHOC2:PP1C:MRAS with non-identical residues between PP1C α,β and γ highlighted in yellow. Three non-identical residues located at complex interfaces have similar chemical properties (arrows). d, SEC traces and associated SDS-PAGE analysis showing complex formation between SHOC2, MRAS and PP1C α,β and γ isoforms. e, Left: Representative peptide dephosphorylation assay against BRAF NTpS with PP1C α,β and γ isoforms. Data points are from two time points (n = 2) (left). Right: Bar graph summarizing mean catalytic efficiency +/- SD from three independent experiments (n = 3). All isoforms show an increase in catalytic efficiency when bound to SHOC2:RAS. [PP1C] = 10 nM, [KRAS(GCP)] = 10 µM. f, Left: Representative peptide dephosphorylation assay showing SHOC2 KDapp for MRAS:PP1C α, β and γ complexes. Data points are from two time points (n = 2) (left). Right: Bar graph summarizing mean SHOC2 KDapp +/- SD from three independent experiments (n = 3). [PP1C] = 25 nM, [MRAS(GCP)] = 1 µM. g, SEC traces (top) and associated SDS-PAGE analysis (bottom) showing MRAS(GDP) can interact with PP1C α,β and γ isoforms. All SEC and SDS-PAGE data is representative of two independent experiments.
Extended Data Fig. 8
Extended Data Fig. 8. RAS binding interactions.
a, SEC trace showing SHOC2:PP1C:KRAS cannot interact with BRAF RBD (green) or CRAF RBD (orange) (top) with SDS-PAGE analysis of SEC fractions (bottom). A FLAG tag on the CRAF RBD increases its mass slightly compared to the BRAF RBD. Results representative of two independent experiments b, BRAF pS365 peptide dephosphorylation by PP1C at varying SHOC2 and KRAS concentrations shows a dependence of the Kdapp of one binding partner on concentration of the other. Data points are from two time points (n = 2). c, Dephosphorylation of BRAF pS365 peptide (0.2 mM) by PP1C:SHOC2 in the presence of varying RAS concentrations. Data points are from two time points (n = 2). MRAS exhibits a lower KDapp than KRAS, though also shows decreasing activity at higher concentrations, possibly because higher concentrations of the SHOC2:PP1C:MRAS trimer promote formation of a SHOC2:PP1C:MRAS hexamer which may be catalytically inactive. [PP1C] = 10 nM, [SHOC2] = 100 nM. d, Sequence alignment between M, K, H and NRAS N termini, Switch I and II (top) and C termini (bottom) e, Top: TR-FRET measuring association between PP1C and SHOC2 in the presence of different GCP bound MRAS/KRAS chimeras, showing that 8 residues on MRAS which contact PP1C (see yellow highlighted residues in (b)) are critical for high binding affinity. Neither the MRAS N nor C termini improve KRAS binding affinity. The KRAS:MRAS chimera showed a modest but statistically significant binding affinity improvement compared to KRAS WT (103 µM vs 128 µM, p = 0.02), but did not fully recapitulate the strong affinity of MRAS WT, showing that other factors such as MRAS Switch I and II dynamics are also important in driving complex formation. Data points are from measurements taken at two time points (n = 2) (top). Bottom: Table summarizing KDapp values from three independent experiments (n = 3). [Tb-PP1C] = 2 nM, [Red-SHOC2] = 200 nM. f, chronos score correlations plotted separately for HRAS, KRAS and NRAS vs SHOC2. Main Fig. 3c represents the combination of these plots, with the lowest of the three H/K/NRAS chronos scores for each cell line selected for display in Fig 3c.
Extended Data Fig. 9
Extended Data Fig. 9. PP1C substrate recognition is driven by SHOC2 and RAS.
a, Representative peptide dephosphorylation assay showing higher catalytic efficiency for PP1C when complexed with SHOC2 and KRAS against A/B/CRAF NTpS, but not against Non-Target Peptides. Data points are from two time points (n = 2). See Fig. 4 for statistical summary of three independent experiments. [PP1C] = 10 nM, [KRAS(GCP)] = 10 µM. b, Peptide dephosphorylation assay showing PP1C (green) or PP1C:SHOC2:KRAS (maroon) dephosphorylation of p-Nitrophenyl Phosphate (PNPP). Error bars represent mean +/- SD of four time points (n = 4). [PP1C] = 10 nM, [KRAS(GCP)] = 10 µM. Results are representative of two independent experiments. c, SEC analysis showing no association between SHOC2:PP1C:KRAS and BRAF kinase domain (orange) (top) with associated SDS-PAGE analysis (bottom). Results representative of two independent experiments d, Sequence alignment of A/B/CRAF NTpS (expected biological targets of SHOC2:PP1C:RAS), CRAF CTpS and Phosphorylase A pS15 (Non-Target Peptides). NTpS peptides contain C terminal hydrophobic residues (yellow) and both NTpS and CTpS contain critical 14-3-3 interacting residues (blue) which may have evolved for 14-3-3 recognition, rather than SHOC2:PP1C:RAS recognition. e, Sequence logo showing conservation among A/B/CRAF NTpS across 18 representative species from C. elegans to H. sapiens (where equivalent RAF isoforms were available) (top), or separate RAF NTpS across species (bottom three). f, SHOC2:PP1C:MRAS structure with PP1C substrate binding grooves highlighted (red ovals).
Extended Data Fig. 10
Extended Data Fig. 10. Molecular dynamics simulations of SHOC2:PP1C:RAS interactions with peptides.
a, Principal component analysis (PCA) of each peptide:protein simulation showing clusters of stable states within each simulation. Representative structures were chosen from within the most populated states, as indicated (black lines). Representative structures were aligned based on the final LRR and C-terminal capping helices of SHOC2 to place the SHOC2 hydrophobic groove on a common view. Only a single SHOC2:PP1C:MRAS complex is shown for clarity. RAF NTpS peptides interact with the SHOC2 hydrophobic groove in a majority of simulations, but not for the Non-Target Peptides. Hydrophobic interactions likely consist of a considerable entropic portion, preventing accurate calculations for free energy of binding for these models. b, Model of RAS binding. Under normal conditions, H/K/NRAS is the preferred binding partner of RAF, whilst MRAS is preferred for SHOC2:PP1C. RAF and SHOC2:PP1C:RAS co-localize at the membrane prior to substrate dephosphorylation.

Comment in

Similar articles

Cited by

  • The Raf/LIN-45 C-terminal distal tail segment negatively regulates signaling in Caenorhabditis elegans.
    Townley RA, Stacy KS, Cheraghi F, de la Cova CC. Townley RA, et al. Genetics. 2024 Nov 6;228(3):iyae152. doi: 10.1093/genetics/iyae152. Genetics. 2024. PMID: 39288021
  • Structural insights into the role of SHOC2-MRAS-PP1C complex in RAF activation.
    Bonsor DA, Simanshu DK. Bonsor DA, et al. FEBS J. 2023 Oct;290(20):4852-4863. doi: 10.1111/febs.16800. Epub 2023 Apr 26. FEBS J. 2023. PMID: 37074066 Free PMC article. Review.
  • The small GTPase MRAS is a broken switch.
    Bernal Astrain G, Strakhova R, Jo CH, Teszner E, Killoran RC, Smith MJ. Bernal Astrain G, et al. Nat Commun. 2025 Jan 14;16(1):647. doi: 10.1038/s41467-025-55967-y. Nat Commun. 2025. PMID: 39809765 Free PMC article.
  • Targeting the SHOC2-RAS interaction in RAS-mutant cancers.
    Hauseman ZJ, Stauffer F, Beyer KS, Mollé S, Cavicchioli E, Marchand JR, Fodor M, Viscomi J, Dhembi A, Katz S, Faggion B, Lanter M, Kerr G, Schildknecht D, Handl C, Maddalo D, Pissot Soldermann C, Brady J, Shrestha O, Nguyen Z, Leder L, Cremosnik G, Lopez Romero S, Hassiepen U, Stams T, Linder M, Galli GG, Guthy DA, King DA, Maira SM, Thoma CR, Ehmke V, Tordella L. Hauseman ZJ, et al. Nature. 2025 Jun;642(8066):232-241. doi: 10.1038/s41586-025-08931-1. Epub 2025 May 7. Nature. 2025. PMID: 40335703 Free PMC article.
  • Variants in LRRC7 lead to intellectual disability, autism, aggression and abnormal eating behaviors.
    Willim J, Woike D, Greene D, Das S, Pfeifer K, Yuan W, Lindsey A, Itani O, Böhme AL, Tibbe D, Hönck HH, Hassani Nia F; Undiagnosed Diseases Network; Zech M, Brunet T, Faivre L, Sorlin A, Vitobello A, Smol T, Colson C, Baranano K, Schatz K, Bayat A, Schoch K, Spillmann R, Davis EE, Conboy E, Vetrini F, Platzer K, Neuser S, Gburek-Augustat J, Grace AN, Mitchell B, Stegmann A, Sinnema M, Meeks N, Saunders C, Cadieux-Dion M, Hoyer J, Van-Gils J, de Sainte-Agathe JM, Thompson ML, Bebin EM, Weisz-Hubshman M, Tabet AC, Verloes A, Levy J, Latypova X, Harder S, Silverman GA, Pak SC, Schedl T, Freson K, Mumford A, Turro E, Schlein C, Shashi V, Kreienkamp HJ. Willim J, et al. Nat Commun. 2024 Sep 10;15(1):7909. doi: 10.1038/s41467-024-52095-x. Nat Commun. 2024. PMID: 39256359 Free PMC article.

References

    1. Lavoie H, Therrien M. Regulation of RAF protein kinases in ERK signalling. Nat. Rev. Mol. Cell Biol. 2015;16:281–298. doi: 10.1038/nrm3979. - DOI - PubMed
    1. Wennerberg K, Rossman KL, Der CJ. The Ras superfamily at a glance. J. Cell Sci. 2005;118:843–846. doi: 10.1242/jcs.01660. - DOI - PubMed
    1. Hobbs GA, Der CJ, Rossman KL. RAS isoforms and mutations in cancer at a glance. J. Cell Sci. 2016;129:1287–1292. - PMC - PubMed
    1. Rajakulendran T, Sahmi M, Lefrancois M, Sicheri F, Therrien M. A dimerization-dependent mechanism drives RAF catalytic activation. Nature. 2009;461:542–U114. doi: 10.1038/nature08314. - DOI - PubMed
    1. Park E, et al. Architecture of autoinhibited and active BRAF–MEK1–14-3-3 complexes. Nature. 2019;575:545–550. - PMC - PubMed

MeSH terms