. 2022 Jul;607(7920):790-798.
doi: 10.1038/s41586-022-04924-6. Epub 2022 Jun 29.

YAP/TAZ activity in stromal cells prevents ageing by controlling cGAS-STING

Affiliations

YAP/TAZ activity in stromal cells prevents ageing by controlling cGAS-STING

Hanna Lucie Sladitschek-Martens et al. Nature. 2022 Jul.

Abstract

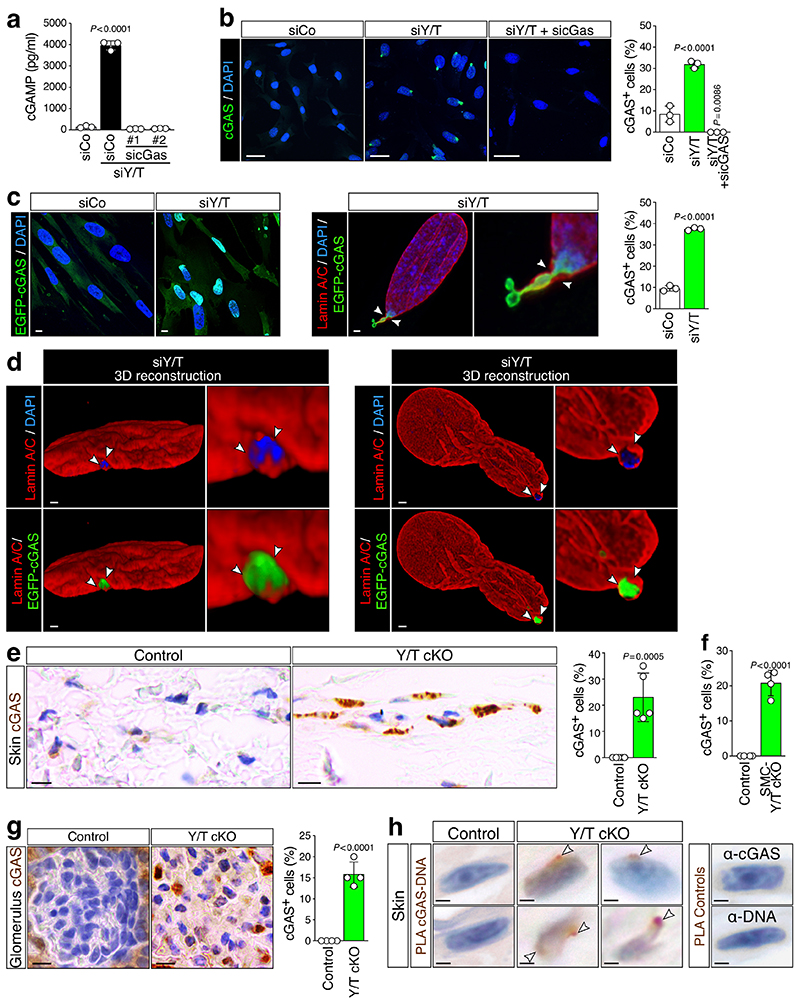
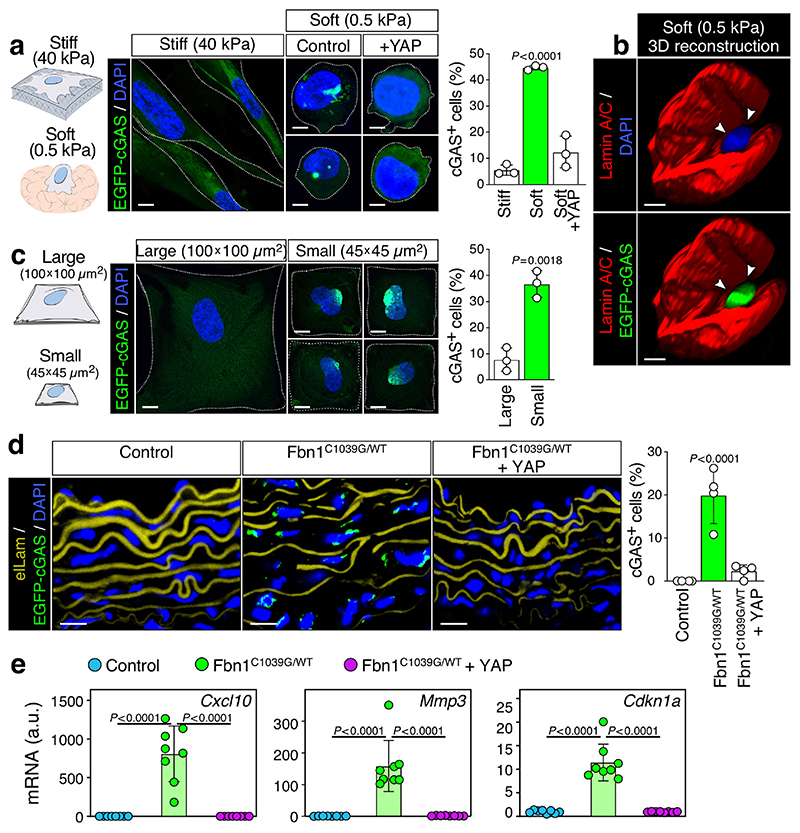
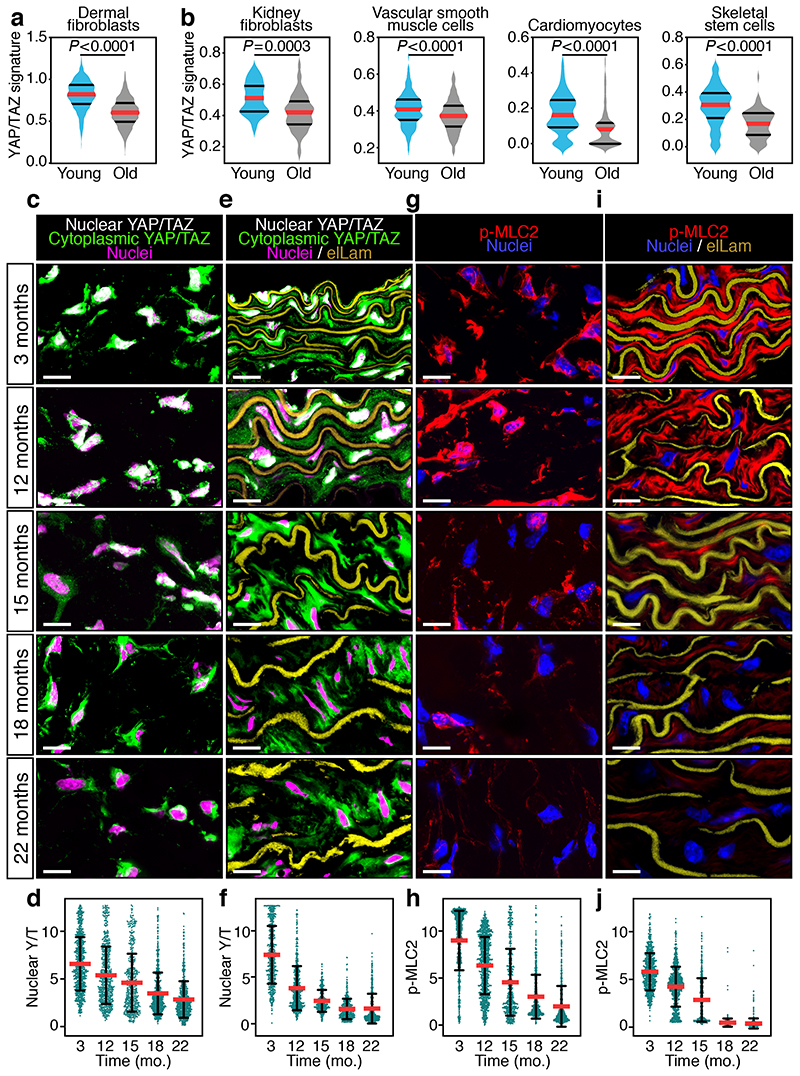
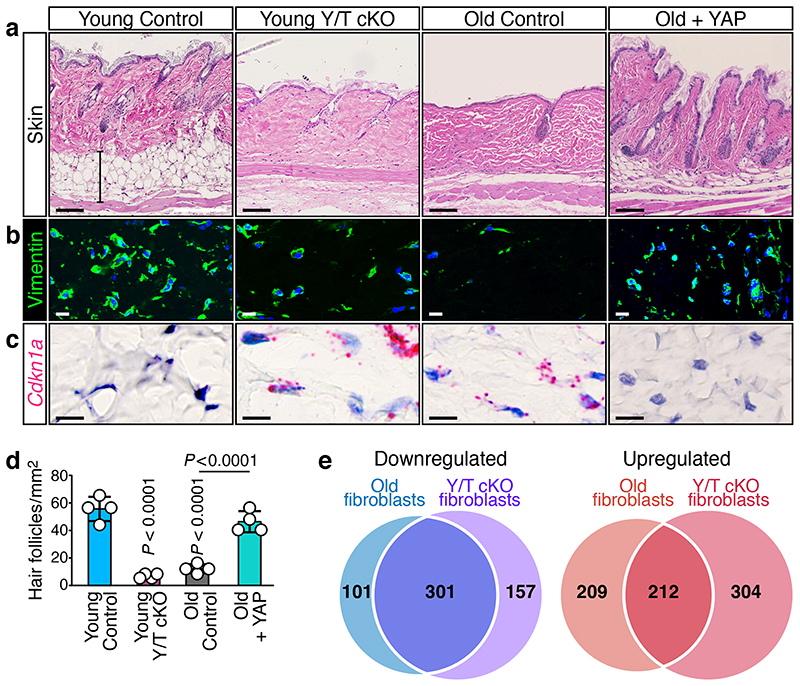
Ageing is intimately connected to the induction of cell senescence1,2, but why this is so remains poorly understood. A key challenge is the identification of pathways that normally suppress senescence, are lost during ageing and are functionally relevant to oppose ageing3. Here we connected the structural and functional decline of ageing tissues to attenuated function of the master effectors of cellular mechanosignalling YAP and TAZ. YAP/TAZ activity declines during physiological ageing in stromal cells, and mimicking such decline through genetic inactivation of YAP/TAZ in these cells leads to accelerated ageing. Conversely, sustaining YAP function rejuvenates old cells and opposes the emergence of ageing-related traits associated with either physiological ageing or accelerated ageing triggered by a mechano-defective extracellular matrix. Ageing traits induced by inactivation of YAP/TAZ are preceded by induction of tissue senescence. This occurs because YAP/TAZ mechanotransduction suppresses cGAS-STING signalling, to the extent that inhibition of STING prevents tissue senescence and premature ageing-related tissue degeneration after YAP/TAZ inactivation. Mechanistically, YAP/TAZ-mediated control of cGAS-STING signalling relies on the unexpected role of YAP/TAZ in preserving nuclear envelope integrity, at least in part through direct transcriptional regulation of lamin B1 and ACTR2, the latter of which is involved in building the peri-nuclear actin cap. The findings demonstrate that declining YAP/TAZ mechanotransduction drives ageing by unleashing cGAS-STING signalling, a pillar of innate immunity. Thus, sustaining YAP/TAZ mechanosignalling or inhibiting STING may represent promising approaches for limiting senescence-associated inflammation and improving healthy ageing.


Conflict of interest statement

Competing interests

The authors declare no competing interests.

Figures

Extended Data Fig. 1
Extended Data Fig. 1. Natural aging correlates with loss of YAP/TAZ mechanotransduction in connective tissues.
a, b, Violin plots showing the distribution of the YAP/TAZ activity signature expression in the indicated cell types form young and old mice. Heart fibroblasts (young n= 476 cells; old n= 511 cells), mesenchymal stem cells (young n= 3824 cells; old n= 4249 cells), mammary gland epithelial cells (young n= 873 cells; old n= 1196 cells), bronchiolar epithelial cells (young n= 44 cells; old n= 15 cells), hepatocytes (young n= 2304 cells; old n= 358 cells), distal renal tubule epithelial cells (young n= 225 cells; old n= 147 cells), Henle’s loop epithelial cells (young n= 870 cells; old= 346 cells), Schwann cells (young n= 109 cells; old n= 93 cells), brain neurons (young n= 83 cells; old n= 59 cells), and heart leukocytes (young n= 139 cells; old n= 187 cells) were retrieved from Tabula Muris Senis (as in Fig.1b). Red lines denote the median, black lines denote quartiles. P values are derived from two-sided, unpaired t-test with Welch’s correction. c, Immunoblotting analysis of YAP and phospho-YAP (p-YAP) in dermal (left panel) and aortic (right panel) samples from young and old mice (n=3 mice per age and tissue). GAPDH served as loading control. d, f, Representative immunofluorescence staining for phospho-FAK (p-FAK) in dermal fibroblasts (d) and aortic wall (f) of wild-type mice of the indicated ages. elLam is elastic lamellae. Bar=10 μm. e, g, Quantification of the p-FAK signal in dermal fibroblasts (e, related to d) and aortic smooth muscle cells (g, related to f) of wild-type mice of the indicated ages. Data are shown as mean (red line) ± s.d. At least 400 cells per condition were analyzed from 3 independent mice. P values are derived from one-way ANOVA with Dunnett’s multiple comparison test. P<0.0001 in all conditions compared to 3-month-old mice.
Extended Data Fig. 2
Extended Data Fig. 2. YAP/TAZ in dermal fibroblasts control dermal and ECM homeostasis.
a, Representative in situ hybridization for Cre recombinase (CreER) in dorsal skin sections of a Col1a2-CreER mouse, showing specific staining in dermal fibroblasts (bar=50 μm). b, Quantification of Vimentin-positive cells in the dermal layer of skin sections from mice of the indicated genotypes. Data (n=4 mice for each column) are presented as mean ± s.d.; P values are derived from one-way ANOVA with Dunnett’s multiple comparison test. Related to Fig. 2b. c, Quantification of Cdkn1a-positive cells in the dermal layer of skin sections from mice of the indicated genotypes. Data (n=4 per condition) are presented as mean ± s.d.; P values are derived from one-way ANOVA with Dunnett’s multiple comparison test. Related to Fig. 2c. d, e, Representative birefringence images (d, bar=100 μm) and quantification (e) of picrosirius red staining on dorsal skin sections from mice of the indicated genotypes. In d, the red-to-green gradient reflects the decreasing thickness of collagen fiber bundles. In e, red is the quantification of thicker collagen fibers appearing as red or yellow in birefringence; green is the quantification of thinner fibers appearing as green in the same conditions. Data in e (n=4 mice for each column) are presented as mean + s.d., 25 areas were analyzed per condition. f, Violin plots from sc-RNA seq data showing the expression distribution of Cdkn1a and Btg2 in freshly dissociated dermal fibroblasts of young control (n=2916 cells), young Y/T cKO (n=759 cells) and old control (n=1413 cells) mice. Red lines denote the median, black lines denote quartiles. P values are derived from Kruskal-Wallis test. g, Immunoblotting analysis of YAP in tail tip biopsies from wild-type (WT Control) and R26-rtTAM2; Col-tetO-YAPS127A mice treated with intermittent doxycycline regime to sustain YAP activity. Mice were analyzed under doxycycline (Doxy Pulse) or during the off-doxy period, two or four days after the last doxy pulse (Wash out d2 and Wash out d4, respectively; see Methods). GAPDH served as loading control.
Extended Data Fig. 3
Extended Data Fig. 3. Additional characterization of the role of YAP/TAZ mechanotransduction in preserving aortic wall integrity.
a, Whole mount X-Gal staining in heart and aorta (upper panel) and aortic wall sections (lower panel, bar=50 μm) of SmmhcCreER; R26-LSL-LacZ mice, either treated with Tamoxifen or Vehicle. Blue signal confirms the inducible and highly specific activity of the Cre driver in vascular smooth muscle cells. b, Representative immunofluorescence staining for alpha-smooth muscle actin (αSMA, upper panel) and YAP/TAZ (lower panel) in the aortic wall of SmmhcCreER; YAPfl/fl; TAZfl/fl mice, showing YAP/TAZ ablation in vascular smooth muscle cells exclusively after Tamoxifen treatment. Bar=10 μm. c, Quantification of medial layer thickness, adventitial layer thickness and elLam fragmentation of mice of the indicated genotypes. Young control are 7-month-old wild-type mice, Old Control are >21-month-old wild-type mice. Related to Fig. 3a. Data (n=8 mice for each column) are presented as mean ± s.d.; P values are derived from one-way ANOVA with Dunnett’s multiple comparison test. d, e, Representative immunofluorescence staining for p-MLC2 (d, bar=10 μm) and quantification (e) of p-MLC2 levels in the aortic wall of wild-type (WT) and Fbn1C1039G/WT mice of the indicated ages. elLam is elastic lamellae. Quantification data are presented as mean ± s.d. P values are derived from one-way ANOVA with Dunnett’s multiple comparison test. P<0.0001 in all conditions compared to 3-month-old wild-type mice, except for 3-month-old Fbn1C1039G/WT mice (P=0.0092). The number of cells analyzed for each mouse strain and age is reported in the corresponding source data file (where n is >400 for each point). f, Immunoblotting analysis of total FAK and phospho-FAK (p-FAK) in adventitia-denuded aortic samples from wild-type and 7-month-old Fbn1C1039G/WT mice. α-Tubulin (αTUB) served as loading control. Two mice per condition are shown. g, Quantification of medial layer thickness and adventitial layer thickness in aortic sections of wild-type, Fbn1C1039G/WT and Fbn1C1039G/WT + YAP mice, as in Fig. 3f. Data (n=8 mice for each group) are presented as mean ± s.d.; P values are derived from one-way ANOVA with Dunnett’s multiple comparison test.
Extended Data Fig. 4
Extended Data Fig. 4. YAP/TAZ oppose senescence in stromal cells.
a, b, Heatmaps showing transcriptional induction (a) and secretion (b) of SASP factors after ex vivo genetic ablation of YAP/TAZ (Y/T cKO) in primary mouse adult fibroblasts (MAFs). Secretion of TNFα, a necrosis marker, was not detected. c, Heatmaps showing upregulation of SASP in WI-38 human fibroblasts upon siRNA-mediated depletion of YAP/TAZ (siY/T). TNFA expression was not detected. d, RT-qPCR analysis showing induction of SASP marker genes in adventitia-denuded aortic media from SMC-Y/T cKO compared to control mice. Data (n=8 mice per column) are presented as mean ± s.d.; P values are derived from two-sided, unpaired t-test. e, RT-qPCR analysis of SASP marker genes in control (siCo) and YAP/TAZ-depleted (siY/T) WI-38 cells, treated with CDK4 inhibitor (CDK4i, 4 μM Palbociclib for 48 hours), with or without concomitant STING inhibition (STINGi, 1 μM H-151 for 48 hours). Data (n=3 independent experiments) are shown as mean ± s.d. f, Senescence-associated β-galactosidase (SA-β-Gal) staining (left panel, bar=50 μm) and quantification (right panel, n=3 independent experiments) in WI-38 cells upon depletion of YAP/TAZ (siY/T). Quantification data are presented as mean ± s.d.; P values are derived from two-sided, unpaired t-test. g, Heatmap showing upregulation of SASP marker genes in primary old MAFs, rescue by YAP-add back, as assessed by RT-qPCR. MAFs were isolated from young and old R26-rtTAM2; Col-tetO-YAPS127A mice, left untreated (Control) or treated with doxycycline (+ YAP) to sustain YAP activity ex vivo. Related to Fig. 4b. h, SA-β-Gal staining (left panel, bar=50 μm) and quantification (right panel, n=3 independent experiments) in primary MAFs isolated from young (3 months) and old (>21 months) mice, in the presence or absence of constitutively active YAP5SA (+ YAP). Cells transduced with empty vector are indicated as Control. Quantification data are presented as mean ± s.d.; P values are derived from one-way ANOVA with Dunnett’s multiple comparison test. i, Immunofluorescence staining for YAP/TAZ (Y/T) (left panel, bar=10 μm) and quantification of subcellular Y/T distribution (right panel, n=3 independent experiments) in freshly isolated MAFs from old (>21 months) mice, either control or treated with Pyrintegrin (3.5 μM for 24 hours). Data are displayed as mean ± s.d. j, RT-qPCR analysis of Cxcl10 in primary MAFs isolated from young (3 months) and old (>21 months) mice, the latter either control or treated with Pyrintegrin (3.5 μM for 24 hours). Data (n=3 independent experiments) are presented as mean ± s.d.; P values are derived from one-way ANOVA with Dunnett’s multiple comparison test. k, Immunofluorescence staining for YAP/TAZ (Y/T) (left panel, bar=10 μm) and quantification of subcellular Y/T distribution (right panel, n=3 independent experiments) in freshly isolated MAFs from young mice, either control or treated with Rho inhibitor (Rhoi, 0.5 μg/ml C3 for 24 hours). Quantification data are displayed as mean ± s.d. l, Expression of SASP markers in young MAFs either control or treated with Rhoi, as assessed by RT-qPCR. Data (n=3 independent experiments) are shown as mean ± s.d.; P values are derived from two-sided, unpaired t-test.
Extended Data Fig. 5
Extended Data Fig. 5. YAP/TAZ loss triggers cGAS activation on genomic DNA.
a, cGAMP levels in control (siCo) or YAP/TAZ-depleted (siY/T) primary mouse aortic smooth muscle cells, as assessed by ELISA. Concomitant cGAS depletion (sicGAS #1 and #2) served as specificity control. Data (n=3 independent experiments) are shown as mean ± s.d.; P values are derived from one-way ANOVA with Dunnett’s multiple comparison test. b, Immunofluorescence staining (left panel, bar=20 μm) and quantification (right panel, n=3 independent experiments) for endogenous cGAS in freshly isolated control (siCo) and YAP/TAZ-depleted (siY/T) MAFs. Concomitant cGAS depletion (siY/T + sicGas) served as specificity control. Data are presented as mean ± s.d.; P values are derived from one-way ANOVA with Dunnett’s multiple comparison test. c, Confocal images (left panel, bar=10 μm), superresolution microscopy analysis (middle panel, bar= 1 μm. Arrowheads indicate sites of genomic DNA herniation through the nuclear Lamina (Lamin A/C)) and quantification (right panel, n=3 independent experiments) of EGFP-cGAS reporter signal in control (siCo) and YAP/TAZ-depleted (siY/T) WI-38 cells. Quantification data are shown as mean ± s.d; P values are derived from two-sided, unpaired t-test. d, 3D reconstruction of immunofluorescence-labeled (Lamin A/C) nuclei of YAP/TAZ-depleted (siY/T) WI-38 cells, expressing the EGFP-cGAS reporter. Arrowheads indicate EGFP-cGAS recruitment at site of genomic DNA (DAPI) herniations. Bar=1 μm. e, Low magnification/field view of endogenous cGAS IHC staining in the dermis of control and Y/T cKO mice (left panel, bar=10 μm). Quantifications (right panel, n=5 mice) are shown as mean ± s.d.; P values are derived from two-sided, unpaired t-test. f, Quantification of cGAS-positive aortic smooth muscle cells from control and SMC-Y/T cKO mice. Data (n=4 mice per column) are shown as mean ± s.d.; P values are derived from two-sided, unpaired t-test. Related to Fig. 4g. g, IHC staining (left panel, bar=10 μm) and quantification (right panel, n=4 mice per column) of endogenous cGAS protein in kidney glomerulus of control and Y/T cKO mice. Quantification data are shown as mean ± s.d; P values are derived from two-sided, unpaired t-test. h, In vivo PLA detection (arrowheads, left panel, bar=1 μm) of physical association of endogenous cGAS with nuclear DNA in dermal fibroblasts of control and YAP/TAZ cKO mice (respectively, 2% and 19% of PLA-positive cells, n>30 cells). Single antibodies (α-cGAS and α-DNA) run in the same assay gave no signal whatsoever, and representative pictures of these negative controls are shown in the right panel.
Extended Data Fig. 6
Extended Data Fig. 6. YAP/TAZ mechanotransduction suppresses cGAS activation.
a, EGFP-cGAS reporter signal (left panel, bar=10 μm) and quantification (right panel, n=3 per condition) in WI-38 cells seeded on stiff (40 kPa) and soft (0.5 kPa) hydrogels in presence or absence of experimentally sustained YAP activity (+YAP). Cell boundaries are indicated by dotted lines. Quantification data are presented as mean ± s.d.; P values are derived from one-way ANOVA with Dunnett’s multiple comparison test. b, 3D reconstruction of a representative nucleus from WI-38 cells expressing the EGFP-cGAS reporter seeded on soft (0.5 kPa) hydrogels and then stained with Lamin A/C and DAPI. Arrowheads indicate EGFP-cGAS accrual at site of genomic DNA (DAPI) herniation. Bar=2 μm. c, EGFP-cGAS reporter signal (left panel, bar=10 μm) and quantification (right panel, n=3 independent experiments) in WI-38 cells plated on large and small adhesive microislands. Cell boundaries are indicated by dotted lines. Quantification data are presented as mean ± s.d.; P values are derived from two-sided, unpaired t-test. d, Representative immunofluorescence staining (left panel, bar=10 μm) and quantification (right panel, n=4 mice) of endogenous cGAS in the aortic wall of mice of the indicated experimental groups. elLam is elastic lamellae. Note perinuclear activation of endogenous cGAS in the aortic mediae of Fbn1C1039G/WT mice, and its prevention by sustaining YAP activity (Fbn1C1039G/WT+YAP) in aortic smooth muscle cells. Data are presented as mean ± s.d.; P values are derived from one-way ANOVA with Dunnett’s multiple comparison test. e, RT-qPCR analysis of senescence markers in adventitia-denuded aortic mediae from mice of the indicated genotypes. Data (n=8 mice per column) are presented as mean ± s.d.; P values are derived from one-way ANOVA with Dunnett’s multiple comparison test.
Extended Data Fig. 7
Extended Data Fig. 7. YAP/TAZ loss induces SASP induction through cGAS/STING signalling.
a-c, Heatmap showing the STING-dependent induction of inflammatory genes (a), interferon target genes (b) and NF-kB target genes (c) upon YAP/TAZ depletion in WI-38 fibroblasts, as determined by RNA-seq. d, Heatmap showing that E2F target genes are downregulated upon YAP/TAZ depletion in WI-38 cells independently of STING, as determined by RNA-seq. e, Heatmap portraying the STING-signalling dependency of SASP marker induction upon genetic ablation of YAP/TAZ (Y/T cKO) in primary MAFs. STINGi is H-151 (1 μM). f, Heatmap displaying cGAS-dependent cytokine secretion upon genetic ablation of YAP/TAZ in primary MAFs. g, RT-qPCR for SASP marker genes upon YAP/TAZ depletion (siY/T) in mouse aortic smooth muscle cells, with or without concomitant cGAS (sicGas#1 and #2) or STING (siSting#1 and #2) depletion. Data (n=3 independent experiments) are presented as mean ± s.d.; P values are derived from one-way ANOVA with Dunnett’s multiple comparison test. h, Cytokine array showing cGAS-dependent secretion of the indicated SASP cytokines upon YAP/TAZ ablation in primary mouse aortic smooth muscle cells. Spots in the upper left and right corners and in the lower right corner served as reference. i, In situ hybridization for CXCL10 in control (siCo) and YAP/TAZ-depleted (siY/T) WI-38 cells, expressing EGFP-cGAS reporter. Treatment with STING inhibitor (STINGi, 1 μM H-151 for 48 hours) served as negative control. Bar=2 μm. Percentage of cells showing concomitant EGFP-cGAS activation and CXCL10 mRNA expression were 0% in siCo, 35% in siY/T and 0% in siY/T + STINGi conditions. At least 40 cells were analyzed for each condition. j, Upper panel, RT-qPCR for SASP marker genes in YAP/TAZ-depleted (siY/T) and control (siCo) WI-38 cells, treated with 2’,3’-dideoxycytidine (ddC, 5 μM for 1 week). Lower panel, qPCR for mitochondrial genes confirming mtDNA depletion by ddC treatment. Note that mtDNA is not required for SASP induction after Y/T depletion. Data (n=3 independent experiments) are presented as mean ± s.d.
Extended Data Fig. 8
Extended Data Fig. 8. cGAS-STING signalling drives senescence-traits and age-related pathology downstream of YAP/TAZ inactivation in connective tissues.
a, Representative ISH for Mmp3 (bar=10 μm) in the dermis from mice of the indicated genotypes. b, c, Quantification (n=5 mice per column) of the ISH signal for the indicated SASP markers in the dermis (b, related to a, and to Fig. 4i) and aorta (c, related to Fig. 4j) from mice of the indicated genotypes. Data are presented as mean ± s.d.; P values are derived from two-sided, unpaired t-test. d, RT-qPCR analysis showing induction of SASP marker genes in aortic mediae of SMC-Y/T cKO mice, prevented by STING loss-of-function mutation (SMC-Y/T cKO; STINGGt/Gt). Data (n=8 mice per column) are presented as mean ± s.d.; P values are derived from one-way ANOVA with Dunnett’s multiple comparison test. e, f, Representative ISH for Il1b (e, bar=10 μm) and quantification (f, n=5 mice) of the ISH signal for the indicated SASP markers in kidney sections from young control, Y/T cKO and Y/T cKO; STINGGt/Gt mice. Quantification data are presented as mean ± s.d.; P values are derived from one-way ANOVA with Dunnett’s multiple comparison test. Related to Fig. 4k. g, Quantification of Vimentin-positive cells (n=4 mice per column), subcutaneous fat layer thickness (n=3 mice) and hair follicle density (n=4 mice) in skin sections of mice of the indicated genotypes. Related to Fig. 4l. Data are presented as mean ± s.d.; P values are derived from one-way ANOVA with Dunnett’s multiple comparison test. h, Quantification of medial layer thickness, adventitial layer thickness and elastic lamellae fragmentation of aortic sections from mice of the indicated genotypes. Related to Fig. 4m. Data (n=5 mice per column) are presented as mean ± s.d.; P values are derived from one-way ANOVA with Dunnett’s multiple comparison test. i, j, Representative elLam staining (i, bar=100 μm) and quantification (j, n=4 mice per column) of medial layer thickness, adventitial layer thickness and elLam fragmentation in aortic sections from control mice, and SMC-Y/T cKO mice either treated with Vehicle or with the STING inhibitor C-176. Data are presented as mean ± s.d.; P values are derived from one-way ANOVA with Dunnett’s multiple comparison test. k, l, Representative images of H&E-stained (k, bar=100 μm) kidney sections of mice of the indicated genotype. Quantification (l) of intratubular casts (n=5 mice per column), dilated tubules (n=6 mice per column) and sclerotic glomeruli (n=5 for mice per column) are presented as mean ± s.d.; P values are derived from one-way ANOVA with Dunnett’s multiple comparison test. m, Quantification of γH2AX signal in dermal fibroblasts of control and YAP/TAZ cKO mice. The number of cells analyzed for each condition is reported in the corresponding source data file (n>150 cells). Data are shown as mean ± s.d.; P values are derived from two-sided, unpaired t-test.
Extended Data Fig. 9
Extended Data Fig. 9. YAP/TAZ mechanotransduction is required to preserve NE architecture.
a, Quantification of nuclear dysmorphia (related to Fig.5a) in young control or YAP/TAZ-depleted MAFs, and in old MAFs with or without YAP reconstitution. Data (n=3 independent experiments) are presented as mean ± s.d.; P values are derived from one-way ANOVA with Dunnett’s multiple comparison test. b, Nuclear morphology (left panel) and quantification of nuclear dysmophia (right panel) in control (siCo) and YAP/TAZ-depleted (siY/T) WI-38 cells, as assessed by Lamin A/C immunostaining. Bar=10 μm. Data (n=3 independent experiments) are presented as mean ± s.d.; P values are derived from two-sided, unpaired t-test. c, Orthogonal projection of Lamin A/C-stained nuclei (left panel, bar=1 μm) and quantification of nuclear height (right panel; n=70 cells per condition) in control or YAP/TAZ-depleted WI-38. Data are presented as mean ± s.d.; P values are derived from two-sided, unpaired t-test. d, Pie charts showing the relative percentage of nuclear lamina defects upon Y/T depletion in WI-38 fibroblasts. At least 200 cells per condition were analyzed. e, f Nuclear morphology (right panel) and quantification (left panels) of nuclear dysmorphia in WI-38 cells plated on stiff (40 kPa) or soft (0.5 kPa) hydrogels (e) and WI-38 cells plated on large or small microislands (f), as assessed by Lamin A/C immunostaining. Data (n=3 independent experiments) are presented as mean ± s.d.; P values are derived from two-sided, unpaired t-test. Bar=10 μm. g, Nuclear morphology (left panel, bar=10 μm) and quantification (left panel) of nuclear dysmorphia in YAP/TAZ-depleted WI-38 cells, in presence or absence of Remodelin, as assessed by Lamin A/C immunostaining. Data (n=3 independent experiments) are shown as mean ± s.d.; P values are derived from one-way ANOVA with Dunnett’s multiple comparison test. h, Quantification of EGFP-cGAS reporter signal in YAP/TAZ-depleted (siY/T) WI-38 cells, with or without Remodelin treatment. Data (n=3 independent experiments) are shown as mean ± s.d.; P values are derived from one-way ANOVA with Dunnett’s multiple comparison test. Related to Fig. 5b. i, j SASP marker genes expression in WI-38 cells (i, n=2 independent experiments) and primary MAFs (j, n=3 independent experiments) upon YAP/TAZ depletion is abolished by concomitant Remodelin (Rem) treatment, as assessed by RT-qPCR analysis. In j, treatment with the STING inhibitor H-151 (STINGi) served as control. Data are shown as mean ± s.d.; P values are derived from one-way ANOVA with Dunnett’s multiple comparison test. k, In vivo super-resolution microscopy analysis (left panel, bar=1 μm) and quantification (right panel, at least n=130 cells per condition were analyzed) of perinuclear F-Actin in dermal fibroblasts of Control and YAP/TAZ cKO mice. Data are shown as mean ± s.d.; P values are derived from two-sided, unpaired t-test.
Extended Data Fig. 10
Extended Data Fig. 10. Role of the actin cap in preserving nuclear morphology downstream of YAP/TAZ.
a, Quantification of actin cap integrity (related to Fig. 5c) in young control or YAP/TAZ-depleted MAFs, and in old MAFs with or without YAP reconstitution. Data (n=3 independent experiments) are presented as mean ± s.d.; P values are derived from one-way ANOVA with Dunnett’s multiple comparison test. b, Superresolution microscopy analysis (left panels) of actin cap integrity in YAP/TAZ-depleted WI-38 cells, in presence or absence of Remodelin, as assessed by F-Actin and Lamin A/C staining. Apical sections are shown. Bar=10 μm. Quantifications (right panel; n=3 independent experiments) are presented as mean ± s.d.; P values are derived from one-way ANOVA with Dunnett’s multiple comparison test. c, Nuclear morphology in WI-38 cells expressing dominant-negative KASH1 domain (KASH1DN) or depleted of Nesprin1/2 (siNespr1/2), as assessed by Lamin A/C immunostaining. Bar=10 μm. d, Quantification (related to c and Fig. 5d) of nuclear dysmorphia and EGFP-cGAS (perinuclear or nuclear accrual) upon disruption of the LINC complex. Data (n=3 independent experiments) are presented as mean ± s.d.; P values are derived from one-way ANOVA with Dunnett’s multiple comparison test. e, Heatmap displaying SASP induction in WI-38 cells expressing dominant negative KASH1 domain (KASH1DN), with or without concomitant STING inhibition (STINGi, 1 μM H-151), as assessed by RT-qPCR. f, Heatmap displaying SASP induction in LINC-disrupted (siNespr1/2, siSUN1/2) WI-38 cells, as assessed by RT-qPCR. g, Actin cap disruption (quantification in right panel) coinciding with NE dysmorphia in Nesprin1/2-depleted cells, as visualized by F-Actin and Lamin A/C staining. Bar=10 μm. Data (n=3 independent experiments) are presented as mean ± s.d.; P values are derived from two-sided, unpaired t-test. h, Left: RT-qPCR analysis of LMNB1 expression levels in control (siCo) and YAP/TAZ-depleted (siY/T #1 and #2) WI-38 cells. Right: Immunoblot analysis of Lamin B1 protein levels in WI-38 cells and primary adult fibroblasts (MAFs) upon YAP/TAZ depletion. i, Heatmap showing cGAS-dependent SASP induction upon Lamin B1 depletion (siLMNB1) in WI-38 cells, as assessed by RT-qPCR. j, RT-qPCR analysis of SASP marker genes in WI-38 cells upon Lamin B1 (siLMNB1 #1 and #2) or YAP/TAZ (siY/T) depletion. k, RT-qPCR analysis of ACTR2 expression levels in control (siCo) and YAP/TAZ-depleted (siY/T #1 and #2) WI-38 cells. In h, j, k data (n=3 independent experiments) are presented as mean ± s.d. P values are derived from one-way ANOVA with Dunnett’s multiple comparison test. l, Quantification of actin cap integrity, nuclear dysmorphia and perinuclear EGFP-cGAS accrual upon ACTR2 depletion (siACTR2) in WI-38 cells, 48 hours after transfection. Related to Fig. 5e. Data (n=3 independent experiments) are presented as mean ± s.d.; P values are derived from two-sided, unpaired t-test. m, Quantification (left) of mean focal adhesion (FA) length (n=3 independent experiments) and abundance (n=25 cells per condition) upon ACTR2 knockdown in WI-38 cells, 48 hours after siRNA transfection. Data are shown as mean ± s.d.; P values are derived from two-sided, unpaired t-test. On the right, F-Actin and Vinculin staining (bar=10 μm) in control and ACTR2 -depleted WI-38 cells. Apical and basal sections are shown. IF were taken at 32 hours after siRNA transfection. n, cGAMP levels in control (siCo) and ACTR2-depleted (siACTR2) WI-38 cells, as assessed by ELISA. Concomitant cGAS depletion served as specificity control. Data (n=3 independent experiments) are shown as mean ± s.d.; P values are derived from one-way ANOVA with Dunnett’s multiple comparison test. o, Heatmap showing cGAS-dependent SASP induction upon ACTR2 depletion (siACTR2) in WI-38 cells, as assessed by RT-qPCR. p, EGFP-cGAS reporter signal (left panel) and quantification (right panel, n=3 independent experiments) in WI-38 cells either control or treated with ARP2/3 inhibitor (ARP2/3i, 50 μM CK-869 for 12 hours). Bar=10 μm. Data are presented as mean ± s.d.; P values are derived from two-sided, unpaired t-test. q, RT-qPCR analysis of SASP marker genes in WI-38 cells either control or treated with the ARP2/3 inhibitor (ARP2/3i) CK-869 at the indicated doses. Data (n=3 independent experiments) are presented as mean ± s.d. r, Quantification of WI-38 cells displaying intact actin cap, nuclear dysmorphia and perinuclear EGFP-cGAS accrual upon YAP/TAZ depletion, with or without concomitant ARPIN depletion. Data (n=3 independent experiments) are shown as mean ± s.d.; P values are derived from one-way ANOVA with Dunnett’s multiple comparison test. Related to Fig. 5e.
Extended Data Fig. 11
Extended Data Fig. 11. Low mechanics disrupt the nuclear envelope and activate cGAS/STING by inhibiting YAP/TAZ.
a, RT-qPCR analysis (left panel) of Lmnb1 and ACTR2 in MAFs and WI-38 cells, respectively, plated on stiff (40 kPa) or soft (0.5 kPa) hydrogels. Lmnb1 and ACTR2 expression on soft substrate is rescued by add-back of constitutively active YAP. Of note, cell cycle inhibition (CDK4/6i treatment, 4 μM Palbociclib for 48 hours) in WI-38 cells plated on stiff substrates is inconsequential for LMNB1 and ACTR2 expression levels (right panel). Data (n=3 independent experiments) are shown as mean ± s.d.; P values are derived from one-way ANOVA with Dunnett’s multiple comparison test (left panel) and from two-sided, unpaired t-test (right panel). b, Superresolution microscopy analysis (left panel) of actin cap integrity, as visualized by F-Actin and Lamin A/C staining, and quantification (right panel) in WI-38 cells plated on adhesive microislands of the indicated sizes. Bar=10 μm. Data (n=3 independent experiments) are presented as mean ± s.d.; P values are derived from two-sided, unpaired t-test. c, RT-qPCR analysis of YAP/TAZ target genes and SASP marker genes in WI-38 cells plated on stiff (40 kPa) or soft (0.5 kPa) hydrogels in the presence (+YAP) or absence (Control) of constitutively active YAP5SA. Control cells were transduced with empty vector. Data (n=3 independent experiments) are shown as mean ± s.d.; P values are derived from one-way ANOVA with Dunnett’s multiple comparison test. d, RT-qPCR analysis of YAP/TAZ target genes and SASP marker genes in primary MAFs plated on stiff (40 kPa) or soft (0.5 kPa) hydrogels. MAFs were isolated from R26-rtTAM2; Col-tetO-YAPS127A mice and either left untreated (Control) or treated with doxycycline (+ YAP) ex vivo to sustain YAP activity. Data (n=3 independent experiments) are shown as mean ± s.d.; P values are derived from one-way ANOVA with Dunnett’s multiple comparison test. e, ChIP-Seq profiles for YAP in human NCI-H2052 cells and human IMR90 fibroblasts showing YAP binding at enhancer elements mapped (red arrow) to the ACTR2 promoter, according to published Hi-C interactome maps. f, Independent repeat experiment of ChIP-qPCR shown in Fig. 5i. Enrichment relative to siY/T: 25.4-fold for TAZ-IP on LMNB1 promoter, 13.8-fold for IP-YAP on LMNB1 promoter; 62.7-fold for IP-TAZ on ACTR2 enhancer, and 99-fold for IP-YAP on ACTR2 enhancer. The panel shows the result of one experiment. g, ChIP-qPCR analysis in human vascular smooth muscle cells (vSMCs) showing that the regulatory elements for LMNB1 and ACTR2 are enriched in YAP- and TAZ-immunoprecipitated chromatin, but not in negative control IP (IgG). Relative DNA binding was calculated as fraction of input and normalized to IgG. The panel shows the result of one experiment, independent repeats for a different cell line (human WI-38) are shown in Fig. 5i and Extended Data Fig. 11f. h, YAP/TAZ-depletion in primary MAFs is inconsequential for Lmna expression levels, as assessed by RNA-Seq. Results of two independent experiments are shown.
Fig. 1
Fig. 1. YAP/TAZ mechanotransduction decreases in connective tissues during natural ageing.
a, Violin plots showing the distribution of YAP/TAZ activity signature expression in freshly dissociated dermal fibroblasts from young (3 months; n=2916 cells) and old (24 months; n=1413 cells) mice, as assessed by scRNA-seq analysis. b, Violin plots showing the distribution of YAP/TAZ activity signature expression in the indicated cell types from young and old mice. Data were retrieved from Tabula Muris Senis for kidney fibroblasts (young n= 28 cells; old n= 84 cells), vascular smooth muscle cells (young n= 472 cells; old n= 362 cells), and cardiomyocytes (young n=100 cells; old n=110 cells) and from Ambrosi et al. for skeletal stem cells (young n= 170 cells; old n= 67 cells). In a, and b, red lines denote the median, black lines denote quartiles. P values are derived from two-sided, unpaired t-test with Welch’s correction. c, e, g, i, Representative immunofluorescence staining for YAP/TAZ and phospho-MLC2 (p-MLC2) in dermal fibroblasts (c, g) and aortic wall (e, i) of wild-type mice of the indicated ages. elLam, elastic lamellae. Scale bars, 10 μm. In c, and e, white signal indicates overlap of YAP/TAZ IF signal (green) with nuclear staining (magenta). d, f, h, j, Quantification of nuclear YAP/TAZ (Y/T) intensity in dermal fibroblasts (d, related to c) and aortic smooth muscle cells (f, related to e) and quantification of the p-MLC2 signal in dermal fibroblasts (h, related to g) and aortic smooth muscle cells (j, related to i) of wild-type mice of the indicated ages. Data are shown as mean (red line) ± s.d. At least 400 cells per condition were analyzed from 3 independent mice. P values are derived from one-way ANOVA with Dunnett’s multiple comparison test. P<0.0001 in all conditions compared to 3-month-old mice.
Fig. 2
Fig. 2. YAP/TAZ in dermal fibroblasts protect the skin from premature aging.
a-c, Left panels are representative images of dorsal skin sections of young (4 months) control and YAP/TAZ knockout mice (Young Y/T cKO); right panels are old (>21 months) control (Old) and age-matched mice where in the latter YAP activity was sustained throughout life (Old + YAP). a H&E (bar=100 μm); b, IF for Vimentin (scale bar, 10 μm), see Extended Data Fig. 2b for quantification. c, in situ hybridization for Cdkn1a (bar=10 μm), see Extended Data Fig. 2c for quantification. b and c are enlargements of the dermal layer. Y/T cKO mice were 2.5-month-old Col1a2-CreER; Yapfl/fl; Tazfl/fl treated with Tamoxifen to induce YAP/TAZ deletion in dermal fibroblasts and analyzed 6 weeks later. Old + YAP mice were R26-rtTAM2; Col-tetO-YAPS127A mice administered with pulsating doxycycline regime starting at 3 months of age. d, Quantification of hair follicle density in skin sections from mice of the indicated genotypes. Data (n=4 mice for each column) are presented as mean ± s.d.; P values are derived from one-way ANOVA with Dunnett’s multiple comparison test. e, Venn diagrams depicting genes down- and upregulated in YAP/TAZ cKO (Y/T cKO) and old dermal fibroblasts compared to fibroblasts from young mice, as assessed by scRNA-Seq analyses.
Fig. 3
Fig. 3. YAP/TAZ mechanotransduction protects the aortic wall against premature aging.
a, b, Representative elastic fiber staining of aortic wall sections of young wild-type (Young Control, 7 months), young SMC-Y/T cKO, old wild-type (Old Control, >21 months) mice (a), and young Fibrillin1 mutant (Fbn1C1039G/WT, 7 months) mice (b). Note comparable degree of elastic lamellae (elLam) fragmentation in young SMC-Y/T cKO, old control and young Fbn1C1039G/WT mice. SMC-Y/T cKO were Smmhc-CreERT2; YAPfl/fl; TAZfl/fl mice treated with Tamoxifen to induce YAP/TAZ deletion in vascular smooth muscle cells. Bar=100 μm. See Extended Data Fig. 3c for quantification. c, d, Representative immunofluorescence staining for YAP/TAZ (c, bar=10 μm) and quantification (d) of nuclear Y/T intensity in the aortic wall of wild-type (WT) and Fibrillin1 mutant mice of the indicated ages. In c, white signal indicates overlap of YAP/TAZ IF signal (green) with nuclear staining (magenta). In d, data are displayed as mean ± s.d. P values are derived from one-way ANOVA with Dunnett’s multiple comparison test. P<0.0001 in all conditions compared to 3-month-old wild-type mice, except for 3-month-old Fibrillin1 mutants (P=0.0056). The number of cells analyzed for each mouse strain and age is reported in the corresponding source data file (where n is always >400 cells for each point). e, f, Representative elLam staining (e) and quantification (f, n=8 mice for each group) of elastic lamellae fragmentation in aortic sections of wild-type (WT 7 months), Fbn1C1039G/WT, and Fbn1C1039G/WT mice in which YAP activity was sustained from 5 months of age till sacrifice at 7 months of age (Fbn1C1039G/WT 7 months + YAP). Note worsening of aortic histopathology in Fbn1C1039G/WT mice between 5 and 7 months of age, prevented by YAP add-back over the same time-span. Fbn1C1039G/WT 7 months + YAP were Tamoxifen-treated Fbn1C1039G/WT; Smmhc-CreERT2; R26-LSL-rtTA; Col-tetO-YAPS127A mice also receiving doxycycline 5 days a week. Bar=100 μm. In f, data are presented as mean ± s.d.; P values are derived from one-way ANOVA with Dunnett’s multiple comparison test. See Extended Data Fig. 3g for additional characterization.
Fig. 4
Fig. 4. YAP/TAZ mechanotransduction in stromal cells opposes senescence and aging by inhibiting cGAS-STING signalling.
a, YAP/TAZ immunofluorescence (scale bar, 10 μm) and subcellular quantification (n=3 mice per condition) in freshly isolated young and old (3 versus >21 months) mouse adult fibroblasts (MAFs). Data are mean ± s.d. Cytopl., cytoplasmic. b, RT-qPCR analysis of SASP markers in young and old MAFs, without and with YAP being added back. Data are mean ± s.d. (n=3 experiments); P values are from one-way ANOVA with Dunnett’s multiple comparison test. a.u., arbitrary units. c, cGAMP quantification in control and YAP/TAZ-depleted MAFs. Data (n=3 experiments) are mean ± s.d.; P derived as in b. d, Endogenous cGAS immunofluorescence (scale bar, 1 μm) in control (siCo) and YAP/TAZ-depleted (siY/T) MAFs. e, 3D reconstruction of a nucleus of YAP/TAZ depleted WI-38 cells expressing EGFP-cGAS and stained with Lamin A/C and DAPI. EGFP-cGAS accrues on exposed genomic DNA (arrowheads). Scale bar, 0.1 μm. f,g, Detection of endogenous cGAS in dermis (f, immunohistochemistry (IHC); scale bar, 1μm) and aortic wall (g, immunofluorescence; scale bar, 10μm) of control and YAP/TAZ cKO mice. elLam is elastic lamellae. h, cGAS- or STING-dependent upregulation of SASP marker genes upon YAP/TAZ depletion in WI-38 cells (RNA-seq heatmap). i-k, STING is epistatic to YAP/TAZ for the regulation of senescent traits in vivo. Representative ISH for Cxcl10 and Cdkn1a in skin (i) and aorta (j) sections and Cxcl10 and Il1b in kidney (k) interstitial cells and glomerular cells, induced before the onset of tissue degeneration in YAP/TAZ cKO mice. Panels are from age-matched mice of the indicated genotypes. Scale bar, 10 μm. No changes in γH2AX was noted at these time points (Extended Data Fig. 8m). l-n, Histopathological analysis of skin (l, H&E staining; asterisk: subcutaneous fat layer; scale bar, 100 μm), aorta (m, elastic fibre staining; scale bar, 100 μm) and kidney (n, periodic acid-Schiff staining; scale bar, 10 μm) sections from age-matched young control, YAP/TAZ cKO and compound YAP/TAZ cKO; STINGGt/Gt mice.
Fig. 5
Fig. 5. YAP/TAZ protect the NE through lamin B1 and the actin cap.
a, Nuclear morphology in primary MAFs, as visualized by LaminA/C immunostaining (bar=10 μm). Young MAFs were isolated from R26-CreER; YAPfl/fl; Tazfl/fl mice, left untreated (Young Control) or treated with 4OH-tamoxifen (Y/T cKO) to deplete YAP/TAZ. Old MAFs were isolated from wild-type mice (>21 months) and transduced with either empty vector (Old Control) or doxycycline inducible constitutively active YAP5SA (Old + YAP). See Extended Data Fig. 9a for quantification. b, EGFP-cGAS reporter signal in YAP/TAZ-depleted (siY/T) WI-38 cells with or without Remodelin treatment (Rem). Bar=10 μm. See Extended Data Fig. 9h for quantification. c, Superresolution microscopy analysis of actin cap integrity, as visualized by F-Actin and LaminA/C staining, in young (3 months) control and young YAP/TAZ cKO MAFs, or in old (>21 months) MAFs in presence or absence of constitutively active YAP. Apical sections are shown. Scale bar, 10 μm. See Extended Data Fig. 10a for quantification. d, EGFP-cGAS reporter signal in control (siCo) and Nesprin1/2-depleted (siNesprin1/2) WI-38 cells. Bar=10 μm. See Extended Data Fig. 10d for quantification. e, Superresolution microscopy analysis of actin cap integrity (upper row, apical sections are shown), as visualized by F-Actin and LaminA/C staining, and confocal images of EGFP-cGAS reporter signal (lower row) in control (siCo), ACTR2-depleted (siACTR2), YAP/TAZ-depleted (siY/T) or YAP/TAZ/ARPIN-depleted (siY/T+siARPIN) WI-38 cells. Bar=10 μm. See Extended Data Fig. 10l, r for quantification. f, SASP marker gene expression is induced by ACTR2 depletion (siACTR2) in a STING-dependent manner in WI-38 fibroblasts, as assessed by RT-qPCR. Data (n=3 independent experiments) are shown as mean ± s.d. See Extended Data Fig. 10 p, q for additional data using a small molecule ARP2/3 inhibitor. g, RT-qPCR for SASP marker genes showing synergistic effects of combined ACTR2 and LaminB1 (siACTR2+siLMNB1) depletion, resembling Y/T depletion (siY/T) in WI-38 fibroblasts. Data (n=3 independent experiments) are presented as mean ± s.d. h, Expression of SASP markers in YAP/TAZ-depleted WI-38 cells is prevented by concomitant depletion of the endogenous ARP2/3 inhibitor ARPIN. Data (n=3 independent experiments) are shown as mean ± s.d. i, Representative ChIP-qPCR experiment in WI-38 cells showing that the regulatory promoter/enhancer elements of LMNB1 and ACTR2 are enriched in YAP- and TAZ-immunoprecipitated chromatin, but not in negative control IP (IgG) or in chromatin obtained from YAP/TAZ-depleted cells. Relative DNA binding was calculated as fraction of input and normalized to IgG. Enrichment relative to siY/T: 30-fold for TAZ-IP on LMNB1 promoter, 13.7-fold for IP-YAP on LMNB1 promoter; 32.7-fold for IP-TAZ on ACTR2 enhancer, and 26.6-fold for IP-YAP on ACTR2 enhancer. The panel shows the result of one representative experiment, see Extended Data Fig. 11f-g for an independent repeat and consistent results in vSMCs. In Extended Data Fig. 11h, we show that YAP/TAZ do not regulate the expression of LaminA. TSS, transcription start site.

Comment in

  • YAP/TAZ get a STING in the tail.
    Strzyz P. Strzyz P. Nat Rev Mol Cell Biol. 2022 Sep;23(9):581. doi: 10.1038/s41580-022-00519-1. Nat Rev Mol Cell Biol. 2022. PMID: 35831513 No abstract available.
  • YAP/TAZ dull the STING of aging.
    Francisco J, Del Re DP. Francisco J, et al. J Cardiovasc Aging. 2022;2:44. doi: 10.20517/jca.2022.33. Epub 2022 Aug 5. J Cardiovasc Aging. 2022. PMID: 36337727 Free PMC article. No abstract available.

References

    1. Childs BG, et al. Senescent cells: an emerging target for diseases of ageing. Nat Rev Drug Discov. 2017;16:718–735. doi: 10.1038/nrd.2017.116. - DOI - PMC - PubMed
    1. Xu M, et al. Senolytics improve physical function and increase lifespan in old age. Nat Med. 2018;24:1246–1256. doi: 10.1038/s41591-018-0092-9. - DOI - PMC - PubMed
    1. Lopez-Otin C, Blasco MA, Partridge L, Serrano M, Kroemer G. The hallmarks of aging. Cell. 2013;153:1194–1217. doi: 10.1016/j.cell.2013.05.039. - DOI - PMC - PubMed
    1. Ewald CY. The Matrisome during Aging and Longevity: A Systems-Level Approach toward Defining Matreotypes Promoting Healthy Aging. Gerontology. 2020;66:266–274. doi: 10.1159/000504295. - DOI - PMC - PubMed
    1. Ge Y, et al. The aging skin microenvironment dictates stem cell behavior. Proc Natl Acad Sci U S A. 2020;117:5339–5350. doi: 10.1073/pnas.1901720117. - DOI - PMC - PubMed

MeSH terms

Substances