. 2022 Jul;607(7919):593-603.
doi: 10.1038/s41586-022-04898-5. Epub 2022 Jun 29.

Mitochondrial RNA modifications shape metabolic plasticity in metastasis

Affiliations

Mitochondrial RNA modifications shape metabolic plasticity in metastasis

Sylvain Delaunay et al. Nature. 2022 Jul.

Abstract

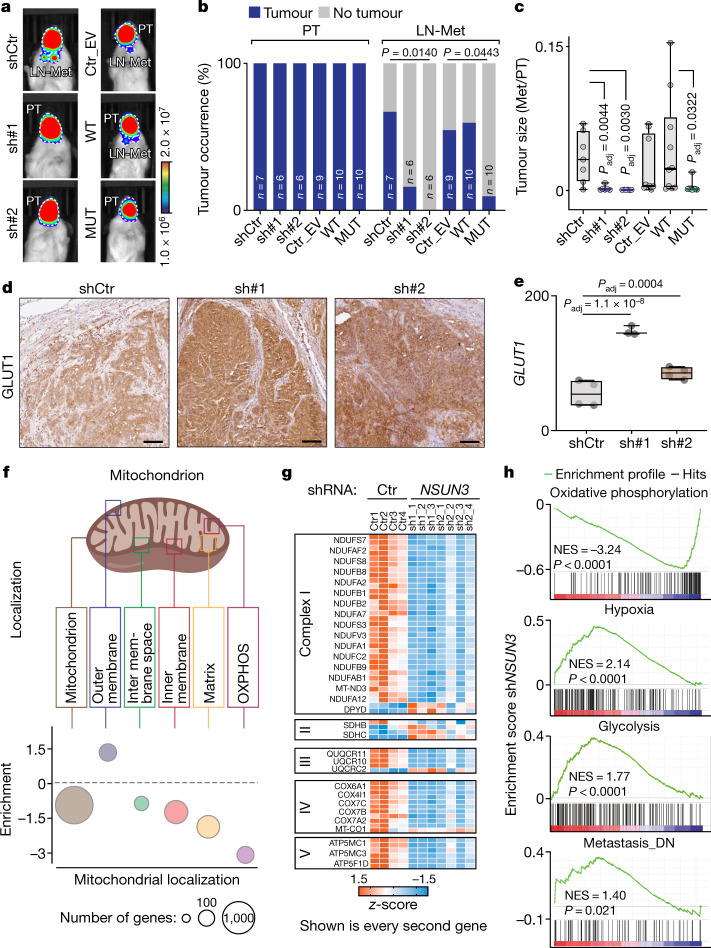
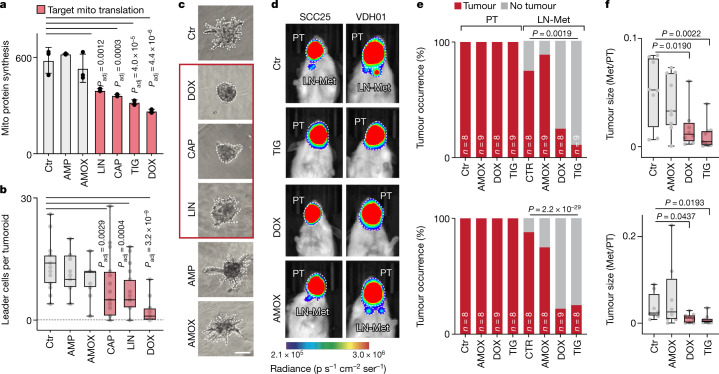
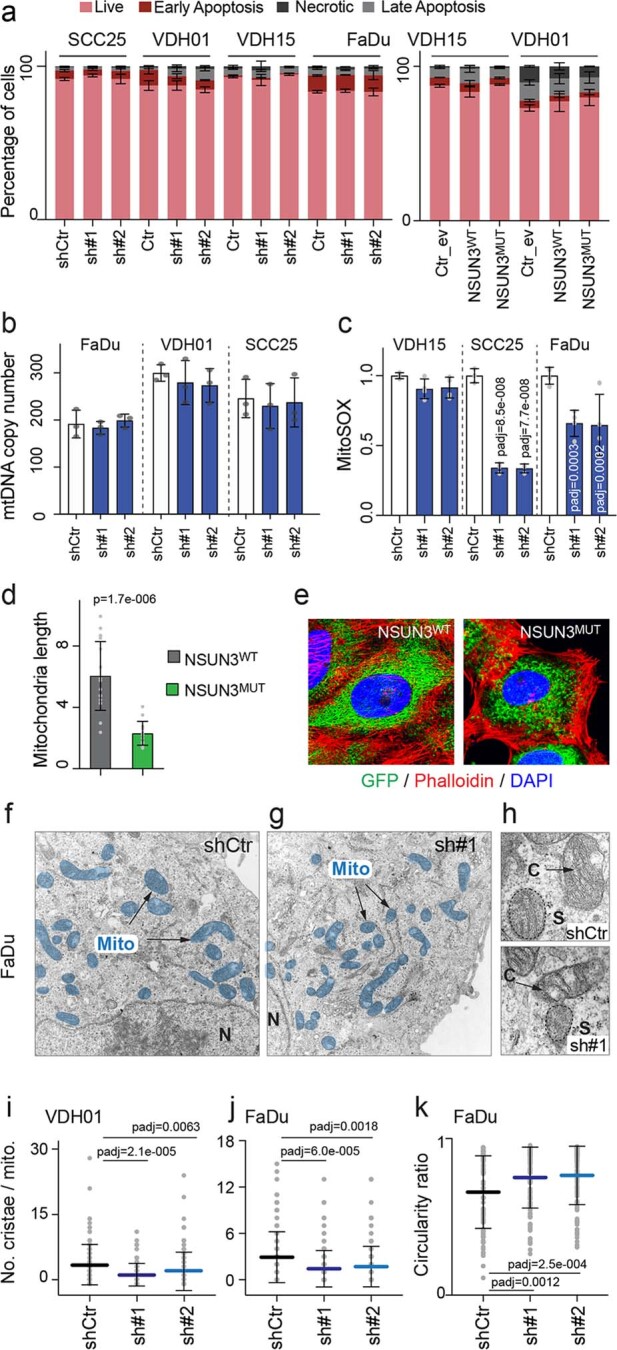
Aggressive and metastatic cancers show enhanced metabolic plasticity1, but the precise underlying mechanisms of this remain unclear. Here we show how two NOP2/Sun RNA methyltransferase 3 (NSUN3)-dependent RNA modifications-5-methylcytosine (m5C) and its derivative 5-formylcytosine (f5C) (refs.2-4)-drive the translation of mitochondrial mRNA to power metastasis. Translation of mitochondrially encoded subunits of the oxidative phosphorylation complex depends on the formation of m5C at position 34 in mitochondrial tRNAMet. m5C-deficient human oral cancer cells exhibit increased levels of glycolysis and changes in their mitochondrial function that do not affect cell viability or primary tumour growth in vivo; however, metabolic plasticity is severely impaired as mitochondrial m5C-deficient tumours do not metastasize efficiently. We discovered that CD36-dependent non-dividing, metastasis-initiating tumour cells require mitochondrial m5C to activate invasion and dissemination. Moreover, a mitochondria-driven gene signature in patients with head and neck cancer is predictive for metastasis and disease progression. Finally, we confirm that this metabolic switch that allows the metastasis of tumour cells can be pharmacologically targeted through the inhibition of mitochondrial mRNA translation in vivo. Together, our results reveal that site-specific mitochondrial RNA modifications could be therapeutic targets to combat metastasis.


Conflict of interest statement

S.A.B. is a co-founder and scientific advisor at ONA Therapeutics. J.H. receives commercial funding from CureVac AG and acts as a consultant and advisory board member for Bristol-Myers Squibb and MSD Sharp & Dohme. M.F. receives commercial funding from Merck. The other authors declare no competing interests.

Figures

Fig. 1
Fig. 1. Detection of m5C and f5C in mitochondrial tRNAs.
a, Detection of m5C and f5C sites in the mitochondrial tRNA transcriptome using fCAB-seq in cancer cells (VDH01). Plotted are all cytosines with a coverage of more than 100 in both independent replicates. The two peaks correspond to C34 of mt-tRNAMet mediated by NSUN3 and C47, C48 and C49 in mt-tRNASer2 mediated by NSUN2, respectively. b, Mitochondrial tRNAMet secondary structure with all known modifications highlighted in red. c,d, Schematic overview of m5C (c) and f5C (d) formation. SAM, S-adenosyl-l-methionine; SAH, S-adenosyl-l-homocysteine. en, Heat maps (e,g,i,k,m) of mt-tRNAMet centred on position C34 and adjacent cytosines showing modified (blue) and unmodified (grey) cytosines from gene-specific parallel fCAB-seq and bisulfite sequencing (BS-seq) in the indicated cell lines; and quantification (f,h,j,l,n) of cytosines that are unmodified, m5C- or f5C-modified as shown in the heat maps (average of three sequencing reactions per condition). Source data
Fig. 2
Fig. 2. Mitochondrial m5C controls energy metabolism in tumour cells.
a, Representative flow cytometry plot using MitoTracker DR (Mito) and OP-puro (OP) to isolate mitochondria. b, Quantification of mitochondrial protein synthesis in the cell populations shown in a infected with control shRNA (shCtr) or NSUN3 shRNA (sh#1), or treated with puromycin (Puro) (shCtr, sh#1: n = 4 flow sorts; Puro: n = 2 treatments). Box plots show minimum value, first quartile, median, third quartile and maximum value. c, Log2-transformed fold change of normalized TCA metabolite levels (pmol per 106 cells) (n = 5 mass spectrometry runs per condition). d, Oxygen consumption rate (OCR) in VDH15 cells infected with Ctr or NSUN3 shRNAs (sh#2) (shCtr: n = 5 injections; sh#2: n = 7 injections). e, OCR in VDH15 cells infected with empty vector (Ctr_EV) or with constructs overexpressing wild-type (WT) or mutant (MUT) NSUN3 proteins (Ctr_EV, NSUN3WT: n = 4 injections; NSUN3MUT: n = 6 injections). f, Quantification of basal extracellular acidification rate (ECAR) in VDH15 cells infected with shRNAs (shCtr, sh#2) or constructs overexpressing wild-type or mutant NSUN3 proteins. The empty vector (Ctr_EV) served as a control (Ctr_EV, WT: n = 12; MUT: n = 18; shCtr: n = 15; sh#2: n = 21 injections). g, Metabolic flux analysis quantifying mitochondrial and glycolytic ATP production in FaDu, VDH15 and SCC25 cells infected with shRNAs (shCtr, sh#1 and sh#2; n = 3 injections). hj, Electron microscopy of VDH01 cells infected with shCtr (h) or sh#1 (i). Higher magnifications are shown in j. C, cristae; Mito, mitochondria; N, nucleus; S: structure (representative images from 10 cells per condition; 2 infections). k, Relative circularity ratio of mitochondria in VDH01 cells infected with shCtr, sh#1 or sh#2 (Ctr: n = 91; sh#1: n = 86; sh#2: n = 93 mitochondria). l, Metabolic switch induced by loss of m5C in mt-tRNAMet. Data are mean ± s.d. (cg,k). Unpaired two-tailed t-test (b,c,f,g) or two-sided Šídák’s test (k). Exact P values are indicated. Source data
Fig. 3
Fig. 3. Mitochondrial m5C is required for metastasis.
a,b, Bioluminescence imaging (a) and tumour occurrence (b) of primary tumours (PT) and lymph node metastases (LN-Met) 21 days after orthotopic transplantation into the mouse tongue. Tumours derived from VDH01 cells were infected with control shRNA (shCtr) or NSUN3 shRNA (sh#1, sh#2) (left) or with an empty vector control (Ctr_EV) or wild-type or mutant NSUN3 overexpression constructs (right). c, Dimensions of the metastasis (LN-Met) relative to its matching primary tumour derived from VDH01 cells in the indicated conditions (shCtr: n = 7 mice; sh#1, sh#2: n = 6 mice; Ctr_EV: n = 9 mice; WT, MUT: n = 10 mice). d,e, Protein (d) and RNA (e) levels (read counts) of GLUT1 in VDH15-derived tumours transduced with shCtr or NSUN3 shRNA (sh#1, sh#2) (protein: representative images from 3 mice per condition; RNA: shCtr, sh#2: n = 4 mice or tumours; sh#1: n = 3 mice or tumours). Scale bars, 50 μm. f, Illustration of mitochondrial compartments (top) and GSEA showing the normalized average enrichment score of mitochondrial regulators in shNSUN3 cells in the respective compartments (bottom). g, Heat map using z-scores of differentially expressed (P ≤ 0.05) transcripts from the indicated complexes of the electron transport chain. h, GSEA of shCtr versus shNSUN3 tumour cells. DN, down; NES, normalized enrichment score. Box plots in c,e show minimum value, first quartile, median, third quartile and maximum value. Chi-squared test (b), two-sided Dunnett’s test (c) or Wald test (e). Random permutations (h). Exact P values are indicated. Source data
Fig. 4
Fig. 4. Efficient mitochondrial translation promotes invasion.
a, Scheme of 3D cultures. b, Intensity of MitoTracker (CMXROS) in VDH01 tumoroids. White square, magnified area. Arrowhead, measured area. c,d, CMXROS and phalloidin staining in FaDu tumoroids expressing shCtr (c) or shNSUN3 (d) constructs. Dotted squares, magnified areas i and ii (right). e, Invasion assay: tumoroids were placed into a 3D collagen matrix. f, VDH01 tumoroid labelled for CMXROS after 48 h cultured in collagen I. White square, magnified area. Arrowhead, invading leader cells. g, Quantification of the CMXROS-positive area in the VDH01 sphere body compared to leader cells after 48 h in culture (n = 4 spheres from 4 independent experiments). h, Sectioned VDH01-derived invading tumoroids labelled for TOMM20 (green) and phalloidin (red) after 48 h cultured in collagen I. Dotted squares, magnified areas i and ii (left). Arrowhead, mitochondria. i, Quantification of the mitochondrial length in leader and sphere body cells from sectioned VDH01-derived invading tumoroids (body: n = 23; leader n = 22 mitochondria from 9 cells of 3 casted tumoroids). Data are mean ± s.d. jl, Quantification of leader cells per tumoroid (j,k) and images of representative VDH01 tumoroids at 9 days (l) in invasion assays infected with control shRNA (shCtr) or shNSUN3 (sh#1, sh#2) (j) or with empty vector control (Ctr_EV), wild-type or mutant NSUN3 overexpression constructs (k) (shCtr: n = 16, sh#1: n = 17, sh#1: n = 12, Ctr_EV: n = 17, WT: n = 20, MUT: n = 23 tumoroids from 3 independent experiments). DAPI: nuclear counterstain (c,d,h). Representative pictures from a minimum of 3 tumoroids (bd,f,h). Scale bars, 20 μm (b,h); 30 μm (c,d); 40 μm (f); 50 μm (l). Box plots in j,k show minimum value, first quartile, median, third quartile and maximum value. Paired two-tailed t-test (g), unpaired two-tailed t-test (i) or two-sided Šídák’s test (j,k). Exact P values are indicated. Source data
Fig. 5
Fig. 5. Metastasis-initiating cells require methylated mitochondrial RNA.
a, Metastasis-initiating CD44+CD36+ cells. b,c, Flow cytometry (b) and CMXROS quantification (c) of CD36 and CD44 high (H) and low (L) VDH01 cells (n = 3 sorts). d, NSUN3 RNA in FaDu subpopulations (n = 9; 3 quantitative PCR with reverse transcription (RT–qPCR) runs; 3 infections). e, CD44HCD36H population in VDH15, SCC25 and FaDu tumoroids. shCtr, control; sh#1, NSUN3 shRNA (shCtr VDH15, shCtr FaDu, sh#1 SCC25, sh#1 FaDu: n = 3 flow sorts; shCtr SCC25, sh#1 VDH15 n = 4 flow sorts). f, GFP+ primary tumours (PT) and lymph node metastases (LN-Met) (left) and flow cytometry (middle and right) of primary tumours 21 days after transplantation. g, CD44HCD36H cells in infected primary tumours (VDH01): empty vector (Ctr_EV), wild-type NSUN3, mutant NSUN3 or shCtr, sh#1 and sh#2 (Ctr_EV, MUT, shCtr, sh#1, sh#2: n = 3 mice; WT: n = 4 mice). h, CD44HCD36H cells in primary tumours and matching LN-Met (VDH15) (PT: n = 7 mice; LN-MET: n = 3 mice). i, CD44 and CD36 flow cytometry using VDH01 tumoroids for translatome analyses. j, Unsupervised clustering of nascent protein synthesis levels. k, GO analysis (ToppGene) of cluster 3 (j). l, Cluster analyses (ClustVis; averaged processed counts) of translated MitoCarta2.0 genes (n = 656) (n = 3 flow sorts; 3 infections). mo, Tumoroids (m,n) and quantification (o) of leader cells per tumoroid (VDH01) in invasion assays infected as indicated or overexpressing (OEX) CD36, untreated or treated with 30 µM of palmitic acid (+PA) (shCtr, n = 20; sh#1, n = 19; sh#2, n = 20; shCtr + CD36OEX, n = 16; sh#1 + CD36OEX, n = 16; sh#2 + CD36OEX, n = 15; shCtr + CD36OEX + PA, n = 20; sh#1 + CD36OEX + PA, n = 18; sh#2 + CD36OEX + PA, n = 21 tumoroids; 3 independent experiments). pr, Illustration (p) and quantification (q) of CD44HCD36H cells and their viability (r) (n = 3 infections). Ann, Annexin V; PI, propidium iodide. Scale bars, 50 μm (m,n). Data in c,e,g,q,r are mean ± s.d. Box plots in d,h,o show minimum value, first quartile, median, third quartile and maximum value. Two-sided Šídák’s test (ce,g,o) or Dunnett’s test (q,r). Random sampling of whole genome (k). Exact P values are indicated. Source data
Fig. 6
Fig. 6. An NSUN3-driven gene signature is predictive for metastasis in patients with HNSCC.
a,b, Representative immunohistochemistry (a) and quantification (b) of NSUN3 protein expression in primary tumours from patients with HNSCC classified by pathological N-stage at diagnosis with no (N0: n = 28), one (N1: n = 19) or several (N2–N3: n = 32) metastases, or patients who have relapsed (Rel.: n = 4 relapse tumours from 3 patients). IRS, immunoreactivity score. c, Quantification of NSUN3 protein expression (IRS) for the indicated pathological stages (I–II: n = 25 patients, III–IVa–b: n = 52). Violin plot shows median with quartiles. d, Unsupervised cluster analyses identified four clusters of patients with HNSCC (TGCA) according to NSUN3-related gene expression (cluster 1, n = 141; cluster 2, n = 127; cluster 3, n = 174; cluster 4, n = 58 patients). FPKM, fragments per kilobase million. e,f, Frequency of the indicated pathological stages (e) and lymph node metastases (LN-Met) (f) in clusters identified in d. g,h, Immunohistochemistry for NSUN3 in primary HNSCC with metastases. Arrowheads, cells at the tumour–stroma border. Black square, higher magnification shown in h. Dotted line with arrow, tumour–stroma border. i, Strategy to quantify the Euclidian distance of NSUN3+ and NSUN3 cells from the tumour–stroma border. j, Proportion of NSUN3+ and NSUN3 cells at the indicated distance to the tumour–stroma border (n = 5 patients). Representative staining from 5 patients (g,h). Box plots in b,d show minimum value, first quartile, median, third quartile and maximum value. Two-sided Šídák’s test (b), two-tailed unpaired t-test (c), ordinary one-way ANOVA (d) or chi-squared test (f). Exact P values are indicated. Source data
Fig. 7
Fig. 7. Pharmacological inhibition of mitochondrial translation prevents metastasis.
a, Quantification of mitochondrial (Mito) protein synthesis using OP-puro in VDH01 tumour cells treated with the indicated antibiotics or a vehicle control (Ctr) (n = 3 drug treatments). Data are mean ± s.d. b,c, Quantification of invading leader cells (b) and representative bright field images of tumoroids (c) after exposure to the indicated antibiotics or control (Ctr, n = 19; AMP, n = 15; AMOX, n = 15; CAP, n = 19; LIN, n = 19; DOX, n = 19 tumoroids from 3 independent drug treatments). d,e, Bioluminescence imaging of SCC25 (left) and VDH01 (right) tumours (d) and quantification of tumour occurrence (e) in mice with orthotopically transplanted SCC25 (top) or VDH01 (bottom) tumours treated with the indicated antibiotics or phosphate-buffered saline (PBS) as a control (Ctr) for 8 days. f, Dimension of the lymph node metastasis relative to its matching primary tumour (PT) of SCC25 (top) or VDH01 (bottom) tumours treated with PBS (Ctr) or the indicated antibiotics (SCC25 Ctr, n = 8 mice; AMOX, n = 9 mice; DOX, n = 8 mice; TIG, n = 9 mice; VDH01 CTR, TIG, AMOX, n = 8 mice; DOX, n = 9 mice). Box plots in b,f show minimum value, first quartile, median, third quartile and maximum value. Two-sided Šídák’s test (a,b), chi-squared test (e) or unpaired two-tailed t-test (f). Exact P values are indicated. Source data
Extended Data Fig. 1
Extended Data Fig. 1. Depletion of NSUN3 removes m5C and f5C from mt-tRNAMet.
a. Schematic representation of fCAB- and bisulfite (BS) parallel sequencing (seq). b. Detection of m5C and f5C sites in the mitochondrial (mt) tRNA landscape using fCAB-Seq in normal human epithelial keratinocytes (NHEK). Plotted are all cytosines on the mitochondrial chromosome (ChrM) with a coverage >100 in both independent replicates. The two peaks correspond to C34 of mt-tRNAMet mediated by NSUN3 and C47, 48, 49 in mt-tRNASer2 mediated by NSUN2 respectively. c. Heat map comparing modification levels along ChrM in three independent cell lines. d. mt-tRNASer2 secondary structure with known modifications highlighted in red. e. Relative fold change (FC) of NSUN3 RNA levels in the indicated cell lines infected with control (Ctr) or NSUN3 shRNAs (sh#1, sh#2) (n = 3 independent infections). f. Sequence of bisulfite-converted mt-tRNAMet. g. m5C levels in the indicated cell lines shown in (h). h. Illustration of mt-tRNAMet in the anticodon loop (upper panel), and heat maps (lower panels) showing methylated (blue) and non-methylated (grey) cytosines identified by RNA BS-seq in the indicated cell lines expressing (shRNA ctr) or lacking NSUN3 (shRNA NSUN3). i,j. Log2 FC of NSUN3 (red) and ALKBH1 (grey) RNA levels in the indicated cell lines versus NHEK cells (i) (n = 3 independent infections) or after depletion of NSUN3 in time course (j) (n = 3 technical replicates per time point). k. Correlation of NSUN3 and ALKBH1 protein levels in cancer cell lines (Cancer Cell Line Encyclopedia). l,m. Correlation of ALKBH1 and NSUN3 RNA levels in normal oesophagus mucosa and TCGA normal oesophageal carcinoma (ESCA) and head and neck squamous cell carcinoma (HNSC) tissue (l) and tumour tissue (m). p = p-value of Spearman correlation coefficient. Shown is mean +/- SD (e,i,j). Two-sided Šídák’s test (e,i). Exact p-values are indicated Source data
Extended Data Fig. 2
Extended Data Fig. 2. NSUN3 regulates mitochondrial activity.
a. Western blot for NSUN3, MT-CO1, and MT-CO2 in SCC25 cells infected with control (Ctr) and NSUN3 shRNAs (#1, #2). HSP90: loading control. b. Quantification of NSUN3 protein levels in mitochondria isolated from the indicated subpopulations (n = 4 flow sorts). c. Illustration of the TCA cycle and its intermediate metabolites. d. Relative RNA levels of NSUN3 in the indicated cell lines expressing wild-type (WT) or methylation-deficient mutated (MUT) NSUN3 proteins (n = 3 RT–qPCRs). e. Fluorescence staining of GFP and MitoTracker Deep Red in VDH15 cells infected with WT or MUT NSUN3. Representative immunofluorescence from 30 stained cells. f. Sequence of NSUN3 constructs showing the substitution of cysteine (NSUN3WT) with alanine (NSUN3MUT). g-i. Representative images showing media colour of the indicated cells infected with Ctr or NSUN3 shRNAs after 48 h in culture. j-n. Oxygen consumption rate (OCR) (j,k) and extracellular acidification rate (ECAR) (l-n) in the indicated cell lines infected with Ctr or NSUN3 shRNAs (sh#1, sh#2). (j: n = 5; k: shCtr n = 4, sh#1 n = 5, sh#2 n = 6; l: shCtr n = 5, sh#1 n = 7; m: shCtr n = 5, sh#1 n = 6; n: shCtr n = 4, sh#1 n = 5 injections). o. ECAR in VDH15 cells infected with empty vector (ctr_ev), NSUN3WT or NSUN3MUT constructs (Ctr_ev, NSUN3WT: n = 4 injections; NSUN3MUT: n = 6 injections). Shown is mean +/- SD (b,d,j-o). Two-sided Tukey’s test (b) or Šídák’s test (d). Exact p-values are indicated Source data
Extended Data Fig. 3
Extended Data Fig. 3. NSUN3 regulates mitochondrial function and shape.
a. Percentage of live or dead cells using Annexin V and Propidium iodide (PI) staining of indicated cell lines infected with Control (Ctr) or NSUN3 shRNAs (sh#1, sh#2) or NSUN3 overexpression constructs containing wild-type (WT) or mutated (MUT) NSUN3, or the empty vector as a control (Ctr_ev) (n = 3 infections). b. Quantification of the mitochondrial DNA copy number in shCtr or NSUN3-depleted (sh#1, sh#2) FaDu cells (n = 3 infections). c. MitoSOX flow cytometry to quantify cellular ROS production in the indicated cells (n = 3 infections). d. Quantification of average mitochondrial length in VDH15 cells infected with NSUN3WT or NSUN3MUT constructs (NSUN3WT n = 18; NSUN3MUT: n = 14 cells). e. Fluorescent staining for overexpressed NSUN3 (GFP) and Phalloidin in VDH15 cells infected with NSUN3WT or NSUN3MUT constructs. Representative immunofluorescence out of 30 stained cells. f-h. Electron microscopy of FaDu cells infected with control (shCtr) or NSUN3 shRNAs (sh#1). Higher magnifications of mitochondria are shown in (h). Representative images from 10 cells per condition from 2 independent experiments. (i-k) Quantification of cristae per mitochondria (i,j) and circularity ratio (k) in the indicated cells (i: Ctr n = 118, sh#1 n = 116, sh#2: n = 117; j: Ctr n = 125, sh#1 n = 124, sh#2: n = 112; k: Ctr n = 103, sh#1 n = 131, sh#2: n = 115 mitochondria in 10 different cells from 2 independent experiments). Shown is mean +/- SD (a-d, i-k). Two-sided Šídák’s test (c,i-k). Two-tailed unpaired t-test (d). Exact p-values are indicated Source data
Extended Data Fig. 4
Extended Data Fig. 4. NSUN3-deficient tumours switch to glycolysis and fail to metastasize.
a, b. Bioluminescence imaging (a) and tumour occurrence (b) of primary tumours (PT), lymph node (LN) or lung metastases (Met), 21 days after orthotopic transplantations. Tumours derived from SCC25 or VDH15 cells infected with control (shCtr) or two different NSUN3 shRNAs (#1, #2). c-f. Dimension of the metastasis relative to its matching primary tumour (c) quantified by measuring the relative luminescence signal shown in (a), and tumour growth (d-f) of tumours derived from SCC25 (c,d; upper panels; n = 10 mice per condition), VDH15 (c,d; lower panels; n = 10 mice per condition) and VDH01 (e,f) cells infected with shCtr or shRNAs #1 or #2) (c,d,e), or with an empty vector control (Ctr_ev), a wildtype (WT), or mutant (MUT) NSUN3 overexpression construct (f; shCTR: n = 7 mice; sh#1, sh#2: n = 6 mice; Ctr_ev: n = 9 mice; WT, MUT: n = 10 mice). g. Immunostaining for GLUT1 in shCtr or shNSUN3 (sh#1, sh#2) infected SCC25 PTs. h-t. Hematoxylin and eosin (h,l,p), immunofluorescence (i-k; m-o; q-s) and quantification (t) of SCC25- and VDH15-derived primary tumours (day 21) infected with shCtr (upper panels), shNSUN3#1 (middle panels) or shNSUN3#2 (lower panels) stained for keratin 10 (K10), CD44, filaggrin (FLG) and DAPI as a nuclear counterstain (SCC25 CD44 and K10 staining: shCTR: n = 33, sh#1 n = 26, sh#2 n = 25 tumours areas from 3 mice; SCC25 FLG staining: shCTR: n = 46, sh#1 n = 35, sh#2 n = 33 tumour areas from 3 mice; VDH15: shCTR: n = 6, sh#1 n = 5, sh#2 n = 11 tumour areas from 3 mice). Representative images from 3 mice per condition (g,h-s). Scale bar: 100 μm. Box plot shows minimum, first quartile, median, third quartile, and maximum (c). Shown is mean +/- SEM (d-f) or SD (t). Chi-squared test (b). Two-tailed Mann Whitney test (c), or two-sided Dunnett’s test (d) and Šídák’s test (t). Exact p-values are indicated Source data
Extended Data Fig. 5
Extended Data Fig. 5. Mitochondria-driven gene signatures in primary tumours.
a, b. Illustration (a) of GFP-positive primary tumours in mouse tongues (b). c. RNA read counts for NSUN3 in control (shCtr) or NSUN3 shRNAs (sh#1 plus sh#2) primary tumours (shCtr n = 4 mice/tumours; shNSUN3: n = 7 mice/tumours). d. Correlation heat map of VDH15 primary tumour samples subjected to RNA-seq. e-f. Volcano plots of differentially expressed genes in VDH15 primary tumours infected with shCtr or the NSUN3 shRNAs sh#1 (e) or sh#2 (f). g. Overlap of differentially expressed genes in tumours infected with shNSUN3#1 or #2. h. GO analysis (GOrilla) for commonly differentially expressed genes shown in (g) (n = 1708). P value: Exact p-value for the observed enrichment. i. Heat map showing differentially expressed (p ≤ 0.05) transcripts from GO:0003735 in control (Ctr) or shNSUN3#1/#2 (NSUN3) primary tumours. j. Principal component (PC) analysis using expression values of mitochondrial regulators (MitoCarta2.0) in shCtr or shNSUN3 (sh#1, sh#2) tumour cells. k. Correlation of mitochondrial regulators expression in shNSUN3#1 and shNSUN3#2 tumour cells (r2= coefficient of determination). Shown is mean +/- SD (c). Two-tailed unpaired t-test (c). Wald test (e-g). Pearson r (k). Exact p-values are indicated Source data
Extended Data Fig. 6
Extended Data Fig. 6. NSUN3 is dispensable for tumoroid growth.
a-d. Immunostaining (a,c) and fluorescence intensity (b,d) of MT-CO2 or MT-CO1 and CD44 in the outlined area (dotted square) in SCC25 primary tumours at day 21. Shown are representative stainings from 4 mice. e-l. Bright field images (e-k) and illustration of 3D cultures (l) of tumoroids derived from the indicated tumour cells infected with shRNA control vector (shCtr), shRNA targeting NSUN3 (shNSUN3), control empty vector (Ctr_ev), NSUN3 wild-type (WT) or NSUN3 mutated overexpression construct (MUT) after 7 days. Shown are representative images from 3 independent experiments. m-p. Representative stainings (m-o) and quantification (p) of glucose uptake using 2DG-IR in control (shCtr) or NSUN3 shRNAs (sh#1, #2) FaDu-derived tumoroids (shCTR, sh#1: n = 8; sh#2 n = 6 tumoroids). DAPI: nuclear counterstain (a,c). Scale bar: 50 μm (a,c,e,f,I,j); 30 μm (g,h,k); 100 μm (m-o). Box plot shows minimum, first quartile, median, third quartile, and maximum (p). Two-sided Dunnett’s test (p). Exact p-values are indicated Source data
Extended Data Fig. 7
Extended Data Fig. 7. Spatial mitochondrial activity in tumoroids.
a-d. Immunofluoresence (a,c) and quantification (b,d) of MitoTracker (CMXROS) and Phalloidin (Phall) in 7 days cultured Fadu (a,b) or VDH01 (c,d)-derived tumoroids. e. Schematic representation of 3D culture assays and subsequent sectioning. Hematoxylin & Eosin staining of sectioned tumoroids (lower left) and invading tumoroids (lower right). f-k. Immunofluorescence (f,g,i,j,k) and quantification (h) of MT-CO1 and Phalloidin (Phall) in sectioned 7 days cultured FaDu-derived tumoroids. Shown are representative images from at least 3 independent experiments (a,c,f,g,i-k). l-n. Representative images (l,m) and quantification (n) of invading leader cells per tumoroid in shCtr and shNSUN3 infected VDH15 tumoroids. (shCTR n = 23; sh#1 n = 13 tumoroids). Scale bars: 30 μm (a); 40 μm (f,l,m); 50 μm (c). Box plot shows minimum, first quartile, median, third quartile, and maximum (n). Two-tailed unpaired t-test (n). Exact p-values are indicated Source data
Extended Data Fig. 8
Extended Data Fig. 8. Metastasis-initiating cells require NSUN3.
a-c. Flow cytometry of VDH15 (a), SCC25 (b) and VDH01 (c) cells for CD36 and CD44 (left panels) and quantification of the MMP (right panels; n = 3 flow sorts) in the indicated subpopulations. d, e. Fold change (FC) of mRNA levels of CD36, CD44, KRT10 (d) and MT-CO1, TFAM, SLUG, ITGA6 and KRT8 (e) in FaDu subpopulations (n = 9: 3 RT–qPCRs from 3 infections). f. Log2 FC in RNA levels of NSUN3, CD44 and CD36 in FaDu cells infected with a control shRNA (shCtr) or shRNAs for NSUN3 (shNSUN3#1/#2) (n = 6: 2 RT–qPCRs from 2 infections). g. Log2 FC of NSUN3, CD36 and CD44 RNA levels in FaDu subpopulations infected with sh#2 relative to shCtr (n = 6 or 4 RT–qPCRs from two flow sorts). h-i. Representative flow cytometry plots for CD36 and CD44 from tumour cells expressing (shCtr) (h) or lacking (shNSUN3#1) NSUN3 (i). j. Percentage of cells in the indicated sorted populations in from VDH15, SCC25 and FaDu tumoroids infected with shCtr or sh#1 (shCtr VDH15, shCtr FaDu, sh#1 SCC25, sh#1 FaDu: n = 3 flow sorts; shCtr SCC25, sh#1 VDH15 n = 4 flow sorts). k-l. Log2 FC of NSUN3, CD44 and CD36 RNA levels in FaDu (k) or VDH15 (l) cells infected with an empty vector control (Ctr_ev), NSUN3 wild-type (WT) or NSUN3 mutated (MUT) overexpressing construct (n = 3 RT–qPCRs). m. Percentage of cells in the indicated sorted populations from VDH15 tumoroids infected with Ctr_ev, NSUN3WT or NSUN3MUT constructs (n = 3 infections). Shown is mean +/- SD (a-c,f,k-m). Box plot shows minimum, first quartile, median, third quartile, and maximum (d,e,g). Two-sided Tukey’s test (a-f), or Šídák’s test (j). Two-tailed Unpaired t-test (k-m). Exact p-values are indicated Source data
Extended Data Fig. 9
Extended Data Fig. 9. A mitochondria-driven proteome defines metastasis-initiating cells.
a. Heat map of differentially translated mRNAs (p < 0.05) encoding proteins of the mitochondrial inner membrane, the oxidative phosphorylation pathway or cell adhesion molecules in the indicated CD44/CD36 subpopulation. H: high; L: low. b. GSEA on CD44HCD36L versus CD44HCD36H newly synthesized proteins showing normalized enrichment scores (NES) and adjusted p-values. c-e. Translation level of the differentiation marker sciellin (SCEL) (c), the proliferation marker cell division cycle associated 8 (CDCA8) (d), and CD44 (e) in the indicated cell populations. f-h. Representative flow cytometry plot for CD36 and CD44 (f, g) and quantification of CD36 protein levels (h) in tumour cells expressing control empty vector (Ctr_ev) or CD36 overexpression constructs (CD36 OEX). i-j. Relative log2 fold change (FC) of CD36 (i) and NSUN3 (j) RNA in VDH01 cells infected with a control shRNA (shCtr), two different shRNAs for NSUN3 (shNSUN3#1/#2), or the Ctr_ev and CD36OEX constructs. (n = 3 infections). k. Representative bright field images of VDH01 spheres infected with shCtr or shNSUN3#1 or #2), Ctr_ev, or CD36 OEX constructs (n = 3 infections). l-m. Quantification of maximal oxygen consumption rate (OCR) in VDH15 cells infected shCtr, shNSUN3#1 or #2, Ctr_ev, or CD36 OEX constructs (n = 7 injections). n. Treatment and time line for invasion assays. o. Quantification of the GFP signal in cells over time after infection with shCTR or shRNA targeting NSUN3 (n = 3 infections). Shown is mean +/- SD (c-e, h-j,l-o). Random permutations (b). Unpaired, two-sided Student’s t-test in which P values were adjusted by Benjamini-Hochberg FDR correction (c-e). Unpaired two-tailed t-test (h) or two-sided Šídák’s test (i,j,m). Exact p-values are indicated c-e,h-j,l,m) Source data
Extended Data Fig. 10
Extended Data Fig. 10. NSUN3-driven gene signatures in patients with HNSCC.
a, b. Representative immunohistochemistry for NSUN3 in primary oral (OSCC) or laryngeal (LaSCC) squamous carcinomas from 28 patients classified by pathological N stage with no (N0), 19 patients with one (N1: 19) or 32 patients with multiple (N2-3) metastases (a) or in the indicated pathological stages (I–II: n = 25 patients, III–IVa-b: n = 52) (b). Scale bar: 100 μm. c, d. Immunohistochemistry (c) and quantification (d) of NSUN3 protein levels in primary tumours (PTU; n = 17) and matching lymph node metastases (LN; n = 22) at the time of diagnosis. Dotted line: matching LN metastases. e. Flowchart to identify 4 clusters (C1-C4) of HNSCC patients (TCGA) based on NSUN3-driven gene signatures. f. Normalized enrichment scores (NES) and adjusted p-values (random permutations) for the indicated differentially expressed gene sets. g. Heat map showing 4 clusters (C1-C4) for unsupervised hierarchical clustering based on transcript levels of top 50 genes (gene set NSUN3High) and bottom 50 genes (gene set NSUN3Low). NSUN3 expression in each tumour is represented as low (blue), middle (green), and high (red).
Extended Data Fig. 11
Extended Data Fig. 11. Pharmacological inhibition of mitochondrial translation mimics loss of mitochondrial m5C and f5C.
a. Schematic overview of inhibition of mitochondrial translation by selected antibiotics. b. Molecular structure of the indicated antibiotics. c. Flow cytometry plots for MPP (MitoTracker DR) and OP-puro incorporation in FaDu cells exposed to the indicated antibiotics or vehicle control (CTR) for 48 h. d. Oxygen consumption rate (OCR; upper panels) and extracellular acidification rate (ECAR; lower panels) in CTR or antibiotics-treated cells (CTR: n = 11, CAP: n = 8, TIG: n = 5, DOX: n = 8, LIN: n = 6, AMOX: n = 8, AMP: n = 6 independent injections). e, f. Collagen-invading VDH01-derived tumoroids treated with tigecycline (TIG) or vehicle control (CTR) for 48 h (e) and quantification of leader cells (f) (CTR: n = 20, TIG: n = 23 tumoroids). g, h. Immunolabelling (g) and quantification (h) of glucose uptake through 2DG-IR in CTR- or TIG-treated tumoroids for 48 h (CTR: n = 6, TIG: n = 5 tumoroids). i-m. CD36 protein expression (i) and quantification of the indicated CD36/CD44 cell populations (j-l) in flow-sorted SCC25-derived tumoroids (m) (n = 3 drug treatments). Shown is mean +/- SD (d, i-l). Box plot shows minimum, first quartile, median, third quartile, and maximum (f,h). Two-tailed unpaired t-test (f,h) or two-sided Šídák’s test (j-l). Exact p-values are indicated Source data
Extended Data Fig. 12
Extended Data Fig. 12. Cell survival and tumour growth are unaffected by inhibition of mitochondrial translation.
a, b. Representative flow cytometry plots (a) and percentages (b) of live or dead cells after Annexin V and PI staining of indicated cell lines treated for 48 h with indicated antibiotics (n = 3 drug treatments) c. Tumour size quantified by measuring the relative photon flux of the luminescence signal at the indicated time points in SCC25- (left panel) or VDH01 (right panel)-derived tumours (SCC25 CTR: n = 8 mice, AMOX: n = 9 mice, DOX: n = 8 mice, DOX: n = 9 mice; VDH01 CTR, TIG, DOX: n = 8 mice, AMOX: n = 9 mice). Shown is mean +/- SD (b,c) Source data

Comment in

References

    1. Fendt SM, Frezza C, Erez A. Targeting metabolic plasticity and flexibility dynamics for cancer therapy. Cancer Discov. 2020;10:1797–1807. doi: 10.1158/2159-8290.CD-20-0844. - DOI - PMC - PubMed
    1. Haag S, et al. NSUN3 and ABH1 modify the wobble position of mt-tRNAMet to expand codon recognition in mitochondrial translation. EMBO J. 2016;35:2104–2119. doi: 10.15252/embj.201694885. - DOI - PMC - PubMed
    1. Nakano S, et al. NSUN3 methylase initiates 5-formylcytidine biogenesis in human mitochondrial tRNAMet. Nat. Chem. Biol. 2016;12:546–551. doi: 10.1038/nchembio.2099. - DOI - PubMed
    1. Van Haute L, et al. Deficient methylation and formylation of mt-tRNAMet wobble cytosine in a patient carrying mutations in NSUN3. Nat. Commun. 2016;7:12039. doi: 10.1038/ncomms12039. - DOI - PMC - PubMed
    1. Lambert AW, Pattabiraman DR, Weinberg RA. Emerging biological principles of metastasis. Cell. 2017;168:670–691. doi: 10.1016/j.cell.2016.11.037. - DOI - PMC - PubMed

MeSH terms