. 2022 Jul;607(7918):345-350.
doi: 10.1038/s41586-022-04895-8. Epub 2022 Jun 29.

Enteric viruses replicate in salivary glands and infect through saliva

Affiliations

Enteric viruses replicate in salivary glands and infect through saliva

S Ghosh et al. Nature. 2022 Jul.

Abstract

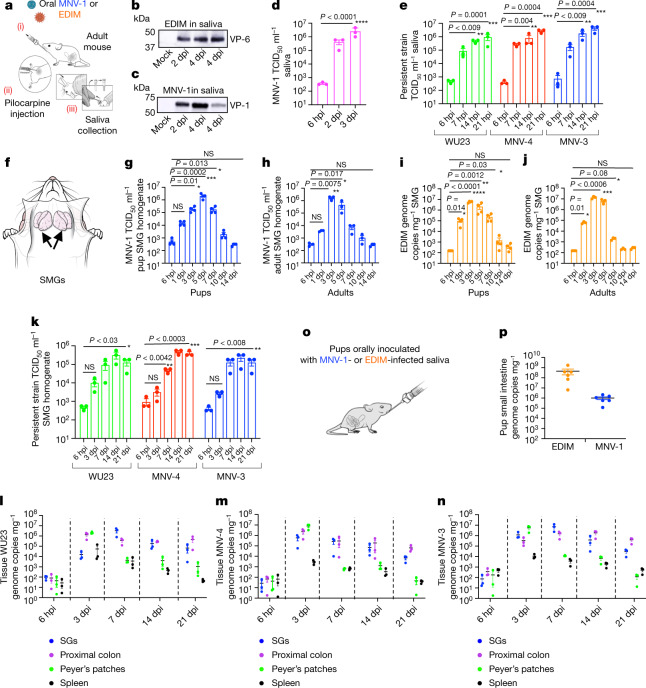
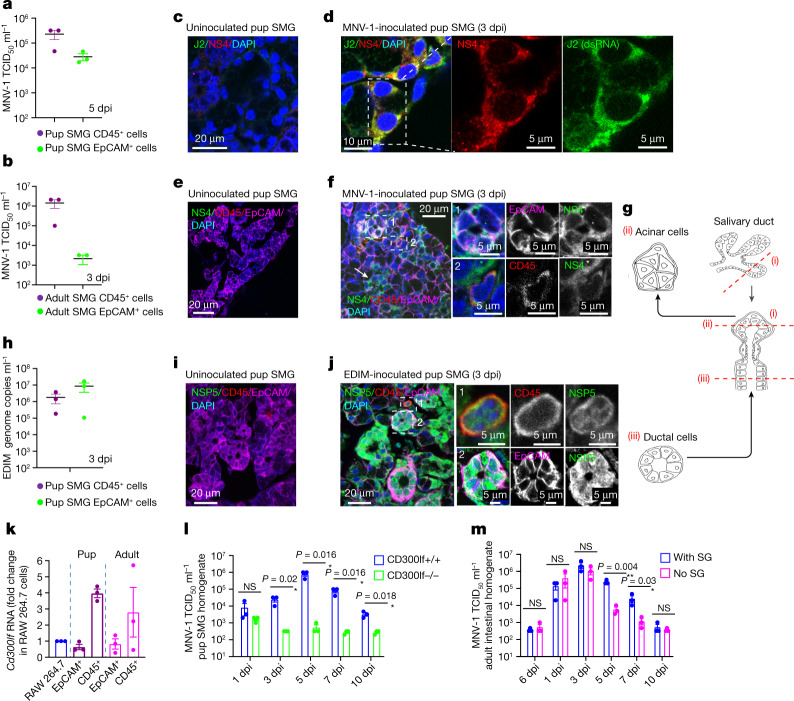
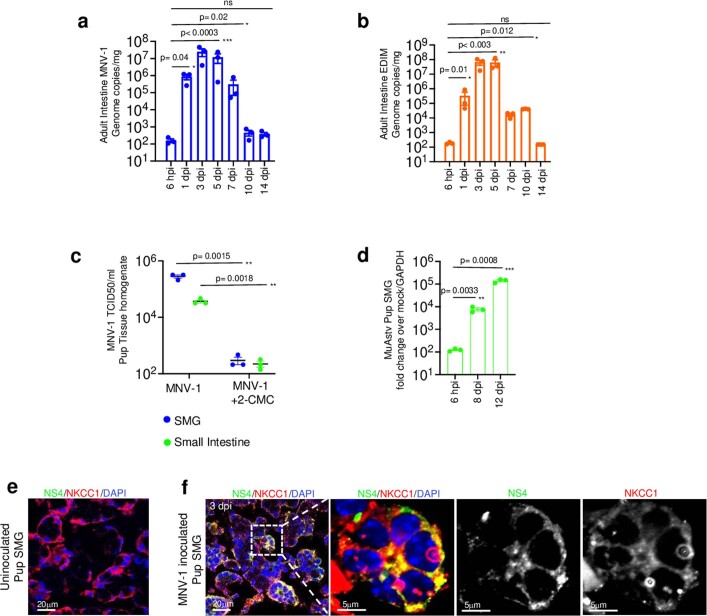
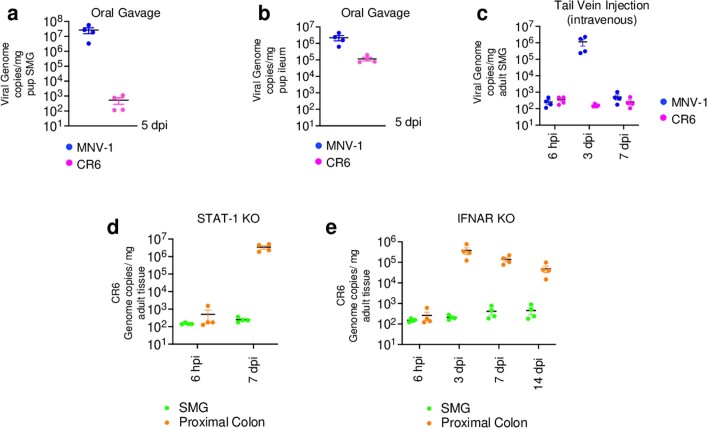
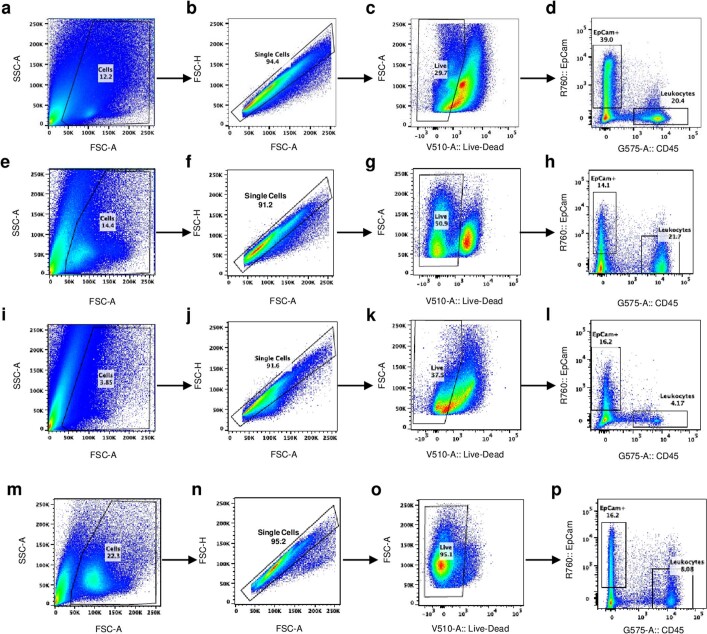
Enteric viruses like norovirus, rotavirus and astrovirus have long been accepted as spreading in the population through fecal-oral transmission: viruses are shed into feces from one host and enter the oral cavity of another, bypassing salivary glands (SGs) and reaching the intestines to replicate, be shed in feces and repeat the transmission cycle1. Yet there are viruses (for example, rabies) that infect the SGs2,3, making the oral cavity one site of replication and saliva one conduit of transmission. Here we report that enteric viruses productively and persistently infect SGs, reaching titres comparable to those in the intestines. We demonstrate that enteric viruses get released into the saliva, identifying a second route of viral transmission. This is particularly significant for infected infants, whose saliva directly transmits enteric viruses to their mothers' mammary glands through backflow during suckling. This sidesteps the conventional gut-mammary axis route4 and leads to a rapid surge in maternal milk secretory IgA antibodies5,6. Lastly, we show that SG-derived spheroids7 and cell lines8 can replicate and propagate enteric viruses, generating a scalable and manageable system of production. Collectively, our research uncovers a new transmission route for enteric viruses with implications for therapeutics, diagnostics and importantly sanitation measures to prevent spread through saliva.


Conflict of interest statement

The authors declare no competing interests.

Figures

Fig. 1
Fig. 1. Suckling infected pups directly transmit enteric viruses to mothers’ mammary glands.
a, Mouse pups orally inoculated with MNV-1or EDIM were left to nurse with mothers (dams). b, MNV-1 titres in pup intestines post-inoculation. c, EDIM replication in pup intestines post-inoculation. d, Intestinal sIgA of MNV-1- and EDIM-infected pups. bd, n = 3 number of biologically independent experiments, seven animals per experiment; each dot represents one animal. e, Milk sIgA of dams (n = 3, three dams per virus; each dot represents an experiment). f, Viral replication in dam mammary glands suckling MNV-1- or EDIM-inoculated pups (n = 3, 23 animals per virus; each dot represents one animal). gn, Immunostaining of mammary glands of dams suckling uninoculated or MNV-1- or EDIM-inoculated pups. o, Ten-day post-partum dams were orally inoculated with EDIM. p, EDIM replication in mammary glands and intestines of o (n = 3, eight animals, three each for 6 hpi and 2 dpi and two for 4 dpi per experiment; each dot represents one animal). q, Milk sIgA from dams orally inoculated with EDIM (n = 3, each dot represents an experiment). r, Pup/dam swap experiment scheme. s,t, EDIM levels in the mammary glands of dams (s) and small intestines of pups (t) (n = 3, each experiment included two cages and each cage consisted of one dam and two pups; each dot represents one animal). Data are the mean ± s.e.m. bd,e,f,p,q, Two-tailed unpaired t-test. Statistical information is found in Supplementary Table 4. The 6-hpi (b,c,f) and day-0 (d,e,p,q) values were taken as the starting input values. Calculations of the limit of detection (LOD) for the TCID50 and qPCR are described in the Methods. In Figs. 1–3, the LOD for TCID50 per millilitre was approximately 102; the LOD for the qPCR data was 78 ± 9 (s.e.m.) genome copies per milligram tissue. All micrograph experiment reproducibility information is found in the Methods. Source data
Fig. 2
Fig. 2. Enteric viruses replicate acutely and persistently in SGs and are transmitted through saliva.
a, Schematic of saliva collection. b,c, Saliva collected from EDIM-infected (b) or MNV-1-infected (c) mice probed with anti-VP-6 and anti-VP1, respectively (n = 3, five animals per experiment). d, MNV-1 titres in saliva (n = 3, three animals per experiment; each dot represents an experiment). e, WU23, MNV-4 and MNV-3 titres in saliva (n = 3, four animals per experiment; each dot represents an experiment). f, Schematic of mouse SMGs. g,h, MNV-1 titres in pup (n = 4) (g) and adult (h) SMGs (n = 3). i,j, EDIM replication in pup (i) (n = 4) and adult (j) SMGs (n = 3). gj, Each data point represents one animal, seven animals per experiment. k, WU23, MNV-4 and MNV-3 titres in SMGs (n = 3, five animals per experiment; each dot represents one animal). ln, Replication in the SGs, proximal colon, Peyer’s patches and spleen of adult mice inoculated with WU23 (l), MNV-4 (m) and MNV-3 (n) (n = 3, five animals per experiment; each dot represents data from one animal). o, Schematic of oral inoculation with infected saliva. p, Viral replication in the small intestines of pups orally inoculated with infected saliva (n = 3, each dot represents one animal, total six animals). Pups were also inoculated with uninfected saliva for baseline reference. Data are the mean ± s.e.m. d,e,gj,k, Two-tailed unpaired t-test. Statistical information is in Supplementary Table 4. For gel source data, see Supplementary Figure 1. The input for d,e,gk,ln, is 6 hpi. Source data
Fig. 3
Fig. 3. Murine norovirus and rotavirus replicate in the epithelial and immune cells of SMGs.
a,b, MNV-1 titres in epithelial (EpCAM+) and immune (CD45+) cells sorted from the SMGs of inoculated pups (a) and adults (b) (n = 3, each dot represents data from two animals, six animals in total). cf, Immunostaining of SMGs from uninoculated and MNV-1-inoculated pups with anti-NS4, anti-J2 (dsRNA), anti-EpCAM and anti-CD45. MNV-1 replication in acinar (arrows and box 1) and immune cells (box 2). g, Schematic of salivary duct structure. h, EDIM replication in EpCAM+ and CD45+ cells sorted from the SMGs of inoculated pups (n = 3, each dot represents two animals, six animals in total). i,j, Immunostaining of SMGs from uninoculated (i) and EDIM-inoculated (j) pups with anti-NSP5, anti-CD45 and anti-EpCAM. EDIM replication in immune (box 1) and ductal cells (arrows and box 2). k, Cd300lf expression in SMGs (n = 3, three adults and three pups per experiment). RAW246.7 and HeLa cells were used as positive and negative controls, respectively. l, MNV-1 titres in the SMGs of inoculated Cd300lf−/− and Cd300lf+/+ mice (n = 3, each dot represents one animal, five animals per experiment for each group). m, MNV-1 titres in the intestines of inoculated SG-removed or SG-intact adult mice (n = 3, each dot represents one animal, six animals per experiment for each group). a,b,h,k, Gating strategies are depicted in Extended Data Fig. 3. Data are the mean ± s.e.m. l,m, Two-tailed unpaired t-test between two groups for each time point. Statistical information is given in Supplementary Table 4. m, Input is 6 hpi. All micrograph experiment reproducibility information is found in the Methods. Source data
Fig. 4
Fig. 4. Enteric viruses replicate in salispheres and SG cell lines.
a, Schematic of MNV-1 or EDIM inoculation in salispheres. b, EDIM genome copies in EDIM-inoculated salisphere lysates (n = 4). c, MNV-1 replication in salispheres with 2-CMC (n = 3). d, MNV-1 titres in MNV-1-inoculated salisphere supernatants (n = 3). e, NS-SV-TT-DC inoculation scheme with HuNoV. f, Immunoblot of P0 cell lysates probed with anti-NS7 and anti-VP1. β-Actin was used as the loading control (n = 3). g,h, HuNoV genomic RNA levels in P0 and P4 cell lysates (g) and P4 supernatants (h) (n = 3). i, Scheme of vesicle pulldown with TIM-4 beads from stool filtrate. j, HuNoV genomic RNA levels in cell lysates of vesicle-cloaked or free virus-inoculated NS-SV-TT-DC cultures (n = 3). k, Cellular lysates of vesicle-cloaked or free virus-inoculated NS-SV-TT-DC cultures were analysed by immunoblotting with anti-NS7 (n = 3) and anti-β-actin. l,m, FISH with probes against the (−) HuNoV strand was performed on uninoculated (l) and vesicle-cloaked HuNoV (GII.4-WN)-inoculated (m) NS-SV-TT-DC and NS-SV-TT-AC cell cultures. Cell outlines are shown in yellow; the arrows point to (−) HuNoV RNA. n, Percentage of NS-SV-TT-DC and NS-SV-TT-AC cells with (−) HuNoV strand FISH staining (n = 6). Data are the mean ± s.e.m. bd,g,h,j,k,n, Each dot represents a biologically independent experiment; two-tailed unpaired t-test between two groups. Statistical information is shown in Supplementary Table 4. d,g,h,j,k, The input was 6 hpi. b,c,g,h,j, The LOD for qPCR was 102 genome copies ml−1. d, The LOD for TCID50 per millilitre was 2 × 102. All micrograph experiment reproducibility information is found in the Methods. For gel source data, see Supplementary Figure 1. Source data
Extended Data Fig. 1
Extended Data Fig. 1. MNV-1, EDIM and Astrovirus replication in SMGs and Intestine.
a, MNV-1, and b, EDIM replication in adult intestines (from 3 independent experiments, each dot represents 1 animal, total 7 animals/experiment). Bar graphs are mean ± Standard Error of Mean (SEM). c, MNV-1 titers in SMGs and small intestine isolated from inoculated pups, +/− 2-CMC treatment (from 3 independent experiments, each dot represents an experiment, 3 animals/experiment). 3 animals/ experiment were only treated with 2-CMC as a negative control. Dot plots are mean ± SEM. d, Murine Astrovirus genome copies in SMGs of inoculated pups (from 3 independent experiments, total 3 animals/experiment). GAPDH was used as control for normalization. Bar graphs are mean ± SEM. e, f Immunostaining of SMGs obtained from uninoculated, and MNV-1 inoculated pups with anti-NS4 and anti-NKCC1. Depicted are representative images obtained from 4 independent experiments (total 4 pups). All statistical tests were performed by two-tailed unpaired t-test. Statistical information is in Supplementary Table 4. All micrograph experiment reproducibility information is in Statistics and Reproducibility in Methods. Input for a, b, d is 6hpi. c, The LOD for TCID50 ml −1 is 102; a, b LOD for qPCR is 78 ± 9 (s.e.m.) genome copies mg −1 tissue. Source data
Extended Data Fig. 2
Extended Data Fig. 2. Investigating SMG infection of CR6.
MNV-1 and CR6 viral genome copies were measured in a, SMG and b, ileum of orally inoculated mice (n = 2, with 2 animals/experiment, each data point represents data from 1 animal. Data are mean ± SEM). Similarly in c, viral genome copies for MNV-1 and CR6 were measured in SMGs after tail vein injection of each virus (n = 4, with 3 animals/experiment each dot represents data from 1 animal. Data are mean ± SEM). CR6 genome copies were measured in d, STAT-1, and e, IFNAR knockout mice. In both experiments animals were orally gavaged and SMG and proximal colon tissues monitored for replication. For d, n = 2 with 2 animals/ experiment and e, n = 4 with 4 animals/ experiment, each dot represents data from 1 animal. Data are mean ± SEM. Input for c, d, e is 6 hpi. a–e, The LOD for qPCR data is 78 ± 9 (s.e.m) genome copies mg−1 tissue. Source data
Extended Data Fig. 3
Extended Data Fig. 3. Gating strategies for cell sorting.
Panels a–d, e–h, i–l and m–p represents gating strategies for Fig. 3a, b, h and k. Briefly, a panel represents the gating for cells, eliminating the cell debris followed by single cell selection in b, eliminating doublets. Panel c represents gating strategy for live/dead cells. Live cells selected from c, was subjected to cell sorting based on EpCam+ and CD45+ cells in d. Sorted cells obtained from d was analyzed in Fig. 3a. The same chronology is maintained for panels: e–h, i–l and m–p.
Extended Data Fig. 4
Extended Data Fig. 4. Ex-vivo replication of MNV-1, CR6 and human norovirus.
a, CD300lf expression in uninoculated salispheres (from 3 independent). RAW246.7 cells were used as positive control for comparison. Bar graph is mean ± SEM. b, Schematic of MNV-1/CR6 inoculation into salisphere culture. c, CR6 and MNV-1 replication in salispheres (from 4 independent experiments represented by a dot). Genome copies/ml was calculated based on standard curve plotted on log scale. Dot plots are mean ± SEM. d, Supernatants collected from CR6 inoculated salispheres (3 independent experiments, each dot represents an experiment) and analyzed by TCID50 and plotted on log scale. Bar graphs are mean ± SEM. e, Immunoblots of lysates from MNV-1 (48hpi) and CR6 (24 hpi & 48 hpi) inoculated salisphere cultures probed against VP-1 and GAPDH (blot representative of 2 independent experiments). f, Lysates from NS-SV-TT-DC cultures inoculated with vesicle-cloaked human noroviruses from two separate isolates (GII.4-WN and GII. 4-77.1) for 6 hpi and 96 hpi (but washed at 6 hpi) were probed with anti-NS6 antibody (from 3 independent experiments). g, Lysates from NS-SV-TT-AC cultures inoculated with vesicle-cloaked human noroviruses from isolate (GII. 4-77.1) for 6 hpi and 96 hpi (but washed at 6 hpi) were probed with anti-NS7 and anti-β actin (from 3 independent experiments represented by each dot) and analyzed by densitometry (dashed line box) and plotted as a bar graph; mean ± SEM. Samples were derived from the same experiment and blots were processed in parallel. Statistical test was performed using two-tailed unpaired t-test between 6 hpi and 96 hpi for each inoculum groups. Statistical information is in Supplementary Table 4. For gel source data, see Supplementary Figure 1. Input for d, g is 6 hpi and c is 12 hpi. c, The LOD for qPCR data from salisphere was 102 genome copies ml−1. d, The LOD for TCID50 ml−1 was approximately 2 x 102. Source data

Comment in

  • Norovirus from the mouths of babes.
    Kennedy EA, Baldridge MT. Kennedy EA, et al. Nature. 2022 Jul;607(7918):247-248. doi: 10.1038/d41586-022-01731-x. Nature. 2022. PMID: 35768603 No abstract available.

References

    1. Petri WA, Jr, et al. Enteric infections, diarrhea, and their impact on function and development. J. Clin. Invest. 2008;118:1277–1290. doi: 10.1172/JCI34005. - DOI - PMC - PubMed
    1. Posse, J. L., Dios, P. D. & Scully, C. in Saliva Protection and Transmissible Diseases (eds Posse, J. L., Dios, P. D. & Scully, C) 53–92 (Academic Press, 2017).
    1. Huang N, et al. SARS-CoV-2 infection of the oral cavity and saliva. Nat. Med. 2021;27:892–903. doi: 10.1038/s41591-021-01296-8. - DOI - PMC - PubMed
    1. Rodríguez JM, Fernández L, Verhasselt V. The gut–breast Axis: programming health for life. Nutrients. 2021;13:606. doi: 10.3390/nu13020606. - DOI - PMC - PubMed
    1. Rogier EW, et al. Secretory antibodies in breast milk promote long-term intestinal homeostasis by regulating the gut microbiota and host gene expression. Proc. Natl Acad. Sci. USA. 2014;111:3074–3079. doi: 10.1073/pnas.1315792111. - DOI - PMC - PubMed

Publication types

Substances