

Quantitative systems pharmacology modeling sheds light into the dose response relationship of a trispecific T cell engager in multiple myeloma
- PMID: 35768621
- PMCID: PMC9243109
- DOI: 10.1038/s41598-022-14726-5
Quantitative systems pharmacology modeling sheds light into the dose response relationship of a trispecific T cell engager in multiple myeloma
Abstract
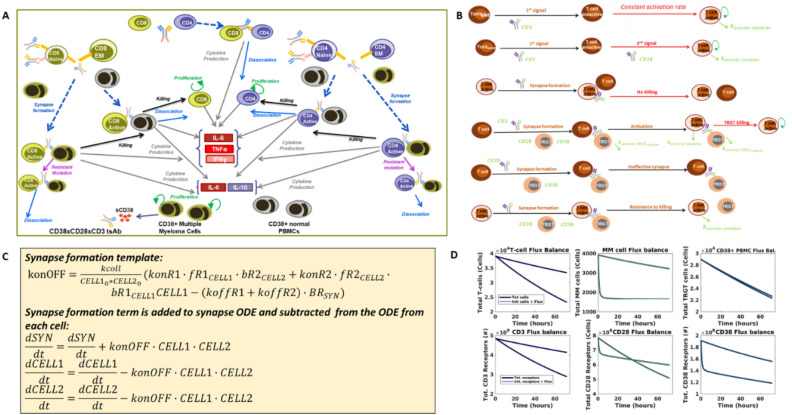
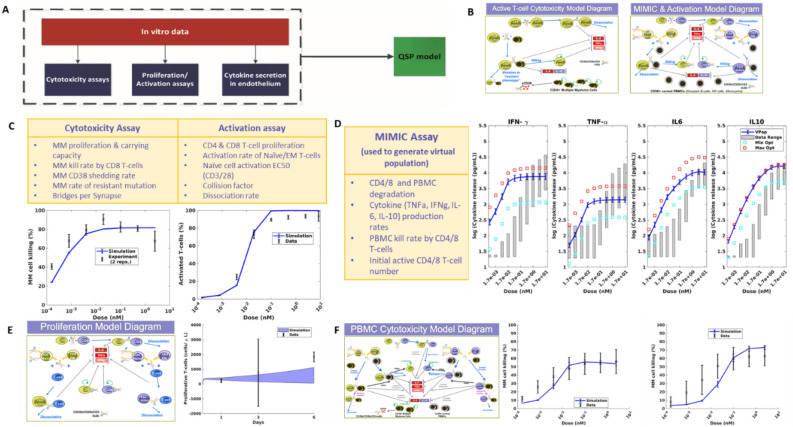
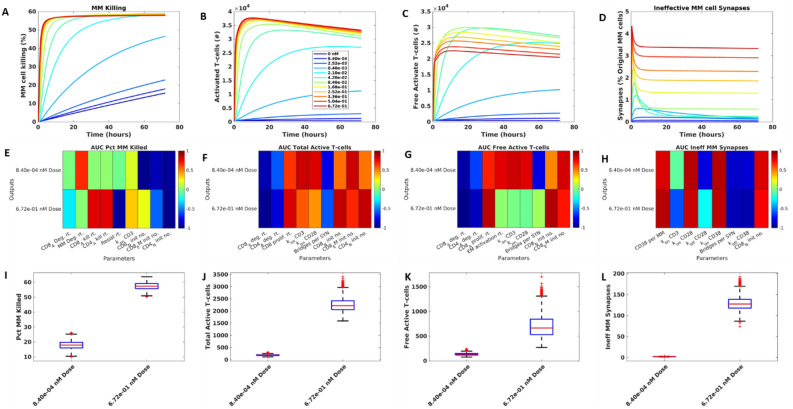
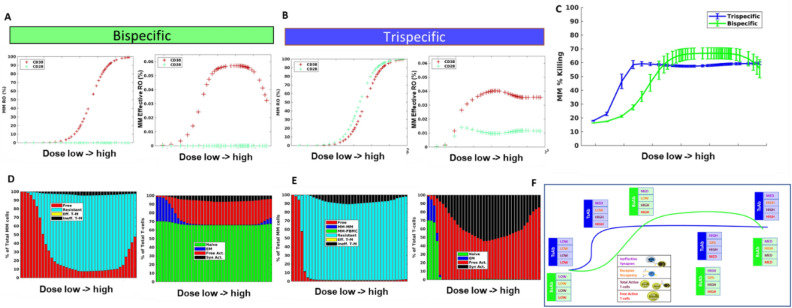
In relapsed and refractory multiple myeloma (RRMM), there are few treatment options once patients progress from the established standard of care. Several bispecific T-cell engagers (TCE) are in clinical development for multiple myeloma (MM), designed to promote T-cell activation and tumor killing by binding a T-cell receptor and a myeloma target. In this study we employ both computational and experimental tools to investigate how a novel trispecific TCE improves activation, proliferation, and cytolytic activity of T-cells against MM cells. In addition to binding CD3 on T-cells and CD38 on tumor cells, the trispecific binds CD28, which serves as both co-stimulation for T-cell activation and an additional tumor target. We have established a robust rule-based quantitative systems pharmacology (QSP) model trained against T-cell activation, cytotoxicity, and cytokine data, and used it to gain insight into the complex dose response of this drug. We predict that CD3-CD28-CD38 killing capacity increases rapidly in low dose levels, and with higher doses, killing plateaus rather than following the bell-shaped curve typical of bispecific TCEs. We further predict that dose-response curves are driven by the ability of tumor cells to form synapses with activated T-cells. When competition between cells limits tumor engagement with active T-cells, response to therapy may be diminished. We finally suggest a metric related to drug efficacy in our analysis-"effective" receptor occupancy, or the proportion of receptors engaged in synapses. Overall, this study predicts that the CD28 arm on the trispecific antibody improves efficacy, and identifies metrics to inform potency of novel TCEs.
© 2022. The Author(s).
Conflict of interest statement
All authors are or were employees of Sanofi at the time of their contribution and may hold shares and/or stock options in the company.
Figures
Similar articles
-
Pre-Clinical Assessment of SAR442257, a CD38/CD3xCD28 Trispecific T Cell Engager in Treatment of Relapsed/Refractory Multiple Myeloma.Cells. 2024 May 20;13(10):879. doi: 10.3390/cells13100879. Cells. 2024. PMID: 38786100 Free PMC article.
-
Ex Vivo Efficacy of SAR442257 Anti-CD38 Trispecific T-cell Engager in Multiple Myeloma Relapsed After Daratumumab and BCMA-targeted Therapies.Cancer Res Commun. 2024 Mar 12;4(3):757-764. doi: 10.1158/2767-9764.CRC-23-0434. Cancer Res Commun. 2024. PMID: 38421887 Free PMC article.
-
A trispecific antibody induces potent tumor-directed T-cell activation and antitumor activity by CD3/CD28 co-engagement.Immunotherapy. 2024 Feb;16(3):143-159. doi: 10.2217/imt-2023-0256. Epub 2023 Dec 21. Immunotherapy. 2024. PMID: 38126157
-
Bispecific T-cell engagers for treatment of multiple myeloma.Am J Hematol. 2023 Mar;98 Suppl 2:S13-S21. doi: 10.1002/ajh.26628. Epub 2022 Jun 28. Am J Hematol. 2023. PMID: 35702871 Review.
-
Perspectives on Outpatient Delivery of Bispecific T-Cell Engager Therapies for Multiple Myeloma.Curr Oncol. 2025 Apr 18;32(4):238. doi: 10.3390/curroncol32040238. Curr Oncol. 2025. PMID: 40277794 Free PMC article. Review.
Cited by
-
Strategies for clinical dose optimization of T cell-engaging therapies in oncology.MAbs. 2023 Jan-Dec;15(1):2181016. doi: 10.1080/19420862.2023.2181016. MAbs. 2023. PMID: 36823042 Free PMC article. Review.
-
Monoclonal Antibodies: The Greatest Resource to Treat Multiple Myeloma.Int J Mol Sci. 2023 Feb 5;24(4):3136. doi: 10.3390/ijms24043136. Int J Mol Sci. 2023. PMID: 36834545 Free PMC article. Review.
-
Virtual clinical trials of anti-PD-1 and anti-CTLA-4 immunotherapy in advanced hepatocellular carcinoma using a quantitative systems pharmacology model.J Immunother Cancer. 2022 Nov;10(11):e005414. doi: 10.1136/jitc-2022-005414. J Immunother Cancer. 2022. PMID: 36323435 Free PMC article. Clinical Trial.
-
Pre-Clinical Assessment of SAR442257, a CD38/CD3xCD28 Trispecific T Cell Engager in Treatment of Relapsed/Refractory Multiple Myeloma.Cells. 2024 May 20;13(10):879. doi: 10.3390/cells13100879. Cells. 2024. PMID: 38786100 Free PMC article.
-
ISB 2001 trispecific T cell engager shows strong tumor cytotoxicity and overcomes immune escape mechanisms of multiple myeloma cells.Nat Cancer. 2024 Oct;5(10):1494-1514. doi: 10.1038/s43018-024-00821-1. Epub 2024 Sep 11. Nat Cancer. 2024. PMID: 39261676 Free PMC article.
References
MeSH terms
Substances
LinkOut - more resources
Full Text Sources
Medical
Research Materials
