. 2022 Jun 29;5(1):638.
doi: 10.1038/s42003-022-03576-6.

Unifying turbulent dynamics framework distinguishes different brain states

Affiliations

Unifying turbulent dynamics framework distinguishes different brain states

Anira Escrichs et al. Commun Biol. .

Abstract

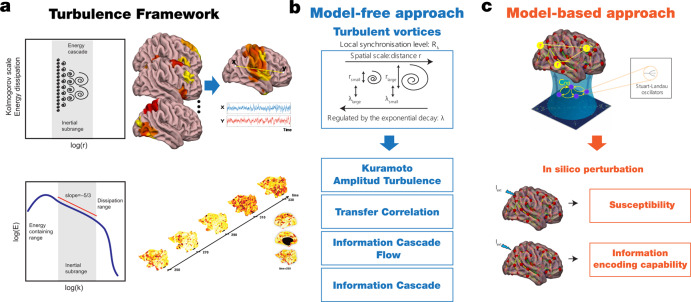
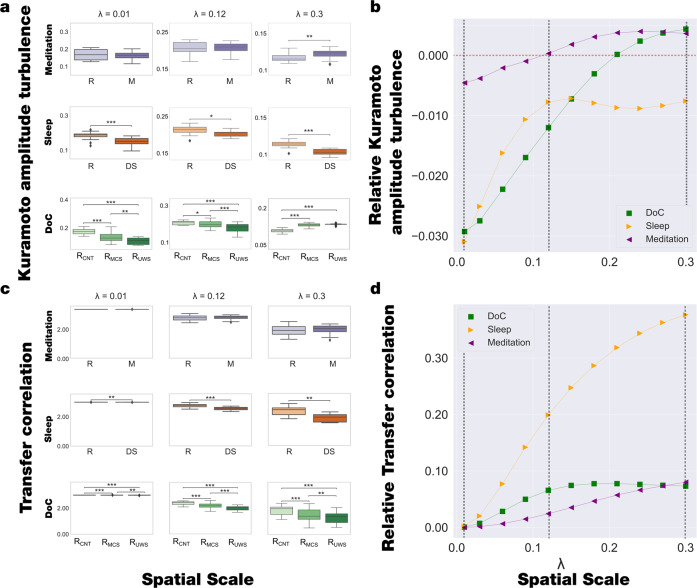
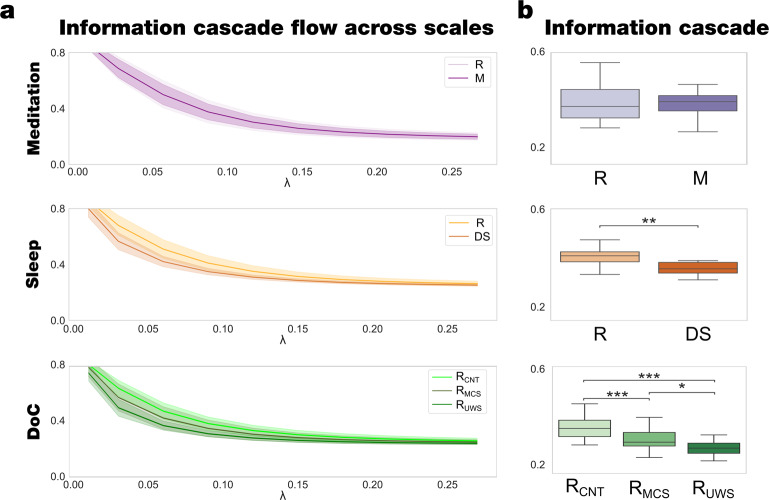
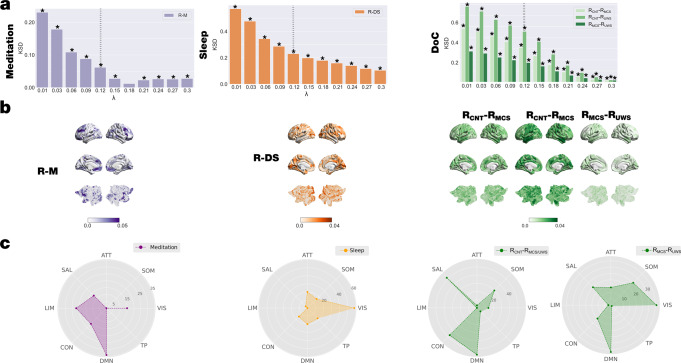
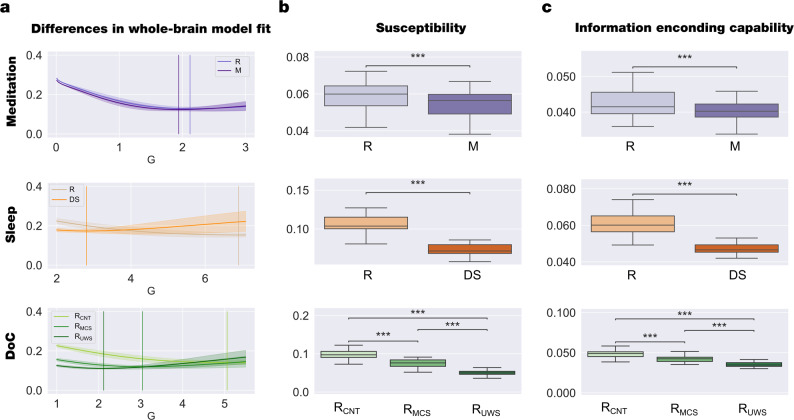
Significant advances have been made by identifying the levels of synchrony of the underlying dynamics of a given brain state. This research has demonstrated that non-conscious dynamics tend to be more synchronous than in conscious states, which are more asynchronous. Here we go beyond this dichotomy to demonstrate that different brain states are underpinned by dissociable spatiotemporal dynamics. We investigated human neuroimaging data from different brain states (resting state, meditation, deep sleep and disorders of consciousness after coma). The model-free approach was based on Kuramoto's turbulence framework using coupled oscillators. This was extended by a measure of the information cascade across spatial scales. Complementarily, the model-based approach used exhaustive in silico perturbations of whole-brain models fitted to these measures. This allowed studying of the information encoding capabilities in given brain states. Overall, this framework demonstrates that elements from turbulence theory provide excellent tools for describing and differentiating between brain states.


Conflict of interest statement

E.T. is an Editorial Board Member for Communications Biology, but was not involved in the editorial review of, nor the decision to publish this article. The remaining authors declare no competing interests.

Figures

Fig. 1
Fig. 1. Overview of framework.
a Turbulence in fluids is one the most common dynamical regime where the mixing motion governs (left panel). The energy cascade, i.e., how the energy travels across scale while dissipated and the statistical properties defined as power laws on the energy levels and structure functions (bottom panel) determine the turbulent behaviour of the fluid. The analogy between brain activity and Turbulence has been recently demonstrated using resting state data from a large dataset of 1,003 healthy human participants. b Model-free approach. The turbulent behaviour of brain activity is reflected in the similarity between the local level of synchronisation, determined by the local Kuramoto order parameter (R) at different scales (λ), and vortex with different spatial scales in fluid dynamics. The spatial scale (r) of the vortex is inversely related with the exponential decay of the local Kuramoto order parameter (λ). The turbulence regime also endows the brain with an efficient information cascade measured as the correlation of the local level of synchronisation across scales (Information Cascade Flow). The average across scales of the information cascade flow is defined as the Information cascade. The Transfer Correlation quantified as the correlation of local synchronisation across space at different scales also characterises the brain’s information processing. c In the Hopf whole-brain model, the dynamics of each brain area are described through a Stuart Landau non-linear oscillator. The system of local oscillators is connected through the anatomical connectivity to simulate the global dynamics, capable of reproducing statistical observables from fMRI data. We used as structural connectivity the long-range connections (LR) from human diffusion MRI measurements on top of an exponential distance rule (EDR) to fit the empirical functional connectivity as a function of the Euclidean distance (following the relation between the Kolmogorov’s second-order structure-function and the traditional FC). Using whole-brain modelling allows obtaining measures that rise from the in silico perturbative approach. We simulated external stimuli and evaluated the model’s reaction for each brain state by quantifying the susceptibility and information capability measures.
Fig. 2
Fig. 2. Model-free framework reveals significant differences in Kuramoto amplitude turbulence and transfer correlation in different brain states.
a The plots show the level of Kuramoto amplitude turbulence at different spatial scales, from λ = 0.01 (100 mm) to λ = 0. 3 (3 mm) in steps of 0.03, and show the comparison between brain states for λ = 0.01, λ = 0.12 and λ = 0.3. The meditation state showed significant increases in Kuramoto amplitude turbulence compared to the resting state only on higher scales. The DS shows significantly lower Kuramoto amplitude turbulence than the resting state across all spatial scales. By contrast, the Kuramoto amplitude turbulence showed significant decreases in RMCS and RUWS states in lower lambda scales but significant increases in higher scales compared to RCNT. b The plots were computed as the linear fit of the mean level of Kuramoto amplitude turbulence at each scale for the three brain states for the DOC dataset (i.e., RCNT, RMCS, and RUWS) and two brain states for sleep and meditation datasets (i.e., W, DS, and R, M, respectively). The plots display the obtained slopes as a function of the scale. In particular, DOC showed negative slopes at lower scales and increased with the scales up to positive slopes. The sleep dataset presented negative slopes at lower scales, increased up to λ = 0.12, and a negative slope value was kept almost constant. The meditation dataset also increased with scale but presented less variability than the other datasets. Dashed vertical lines indicate the scales displayed in A and the horizontal red dashed line highlights the zero slope. c We computed the transfer correlation (|Aλ|), which measures how the information travels across space at different spatial scales, i.e., we show the results as a constant k - |Aλ|, with k = 3 |Aλ|. The meditation state presents no significant differences on any scale compared to the resting state. In contrast, the transfer correlation significantly decreased for DS and RMCS, RUWS states compared to the resting state across all scales. d We performed the same computation as in panel B for the transfer correlation measure. In this case, DOC and sleep datasets presented a similar slope-scale relationship, whereas the meditation dataset presented less variability across scales. In the figure, P-values were assessed using the Wilcoxon rank-sum test and corrected for multiple comparisons, *P < 0.05, **P < 0.01 and ***P < 0.001.
Fig. 3
Fig. 3. Model-free framework showed differences in information cascade flow and information cascade in different brain states.
a The information cascade flow across scales is the predictability given by the level of synchronisation at a specific scale (λ) from the previous scale λ−∆λ (where ∆λ = 0.03 is the discretisation of scale). The meditation state presents no differences across the scales compared to the resting state, the information cascade flow significantly decreases for DS and RMCS, RUWS states compared to the resting across all scales. b The information cascade, defined as the average information cascade flow, differentiates RMCS, RUWS, and DS states from the resting state, while the meditation state presents no differences. P-values were assessed using the Wilcoxon rank-sum test and corrected for multiple comparisons, *P < 0.05, **P < 0.01 and ***P < 0.001.
Fig. 4
Fig. 4. Local node-level metastability was significantly different between brain states and revealed distinct signatures of network involvement.
We computed the node-level metastability as the standard deviation across time of the local Kuramoto order parameter (see Methods). a We performed the KSD between distributions of the node-level of metastability of each brain state within each dataset for each scale. The KSD for all datasets monotonically decreases, whereas the value of λ increases for all comparisons. b Render brains represent the absolute difference of the node-level metastability between each brain state for scale λ = 0.12, indicated with vertical dashed lines in panel A. We selected the top 15% quantile of absolute differences between conditions, identified the resting state networks to which they belong and quantified the number of nodes per network. c Radar plots represent the number of nodes on the top 15% quantile of the absolute difference by each comparison and resting-state network (CON: control; DMN: default mode; TP: temporal-parietal; VIS; visual; SOM: somatomotor; ATT: attentional; SAL: salience; LIM: limbic). The networks showing the highest differences between resting and meditation states were the limbic and default-mode networks. The comparison between deep sleep and resting state shows that nodes of the visual- and default-mode- networks present the highest difference. Finally, the comparison between RCNT and DOC patients (RMCS and RUWS) shows that the somatomotor-, salience-, control-, and default-mode- networks present the highest differences, whereas, specifically in the comparison between RMCS and RUWS nodes associated with the somatomotor- and control- networks present the highest differences. P-values were assessed using the Kolmogorov–Smirnov test and corrected for multiple comparisons, *P < 0.001.
Fig. 5
Fig. 5. Model-based framework revealed significant perturbative differences for different brain states.
a We show the evolution of the error of the whole-brain model FC fitting to the empirical fMRI data as a function of the global coupling strength, G. The error of the FC fitting was given by the square root of the difference between the simulated and empirical FC matrix. The optimal working point of the model was defined as the minimum value of the FC fitting, i.e., where the model shows maximal similarity to the empirical fMRI data. b We show the results of the susceptibility measure, which estimates how these models react to external periodical force perturbations. In all datasets, the resting state was the most susceptible to be perturbed. c We show the information encoding capability of the whole-brain models, which captures how different external stimulations are encoded in the dynamics. Similar to the susceptibility measure, the resting state was more susceptible to react to the perturbations. Susceptibility and information capability measures differentiated each brain state and between RMCS and RUWS groups. These results show that each brain state encodes the whole-brain dynamics with a particular complexity. P-values were assessed using the Wilcoxon rank-sum test and corrected for multiple comparisons; ***P < 0.001.

References

    1. Goldman JS, et al. Bridging single neuron dynamics to global brain states. Front. Syst. Neurosci. 2019;13:75. doi: 10.3389/fnsys.2019.00075. - DOI - PMC - PubMed
    1. Kringelbach ML, Deco G. Brain states and transitions: insights from computational neuroscience. Cell Rep. 2020;32:108128. doi: 10.1016/j.celrep.2020.108128. - DOI - PubMed
    1. Gervasoni D, et al. Global forebrain dynamics predict rat behavioral states and their transitions. J. Neurosci. 2004;24:11137–11147. doi: 10.1523/JNEUROSCI.3524-04.2004. - DOI - PMC - PubMed
    1. Deco G, Tononi G, Boly M, Kringelbach ML. Rethinking segregation and integration: contributions of whole-brain modelling. Nat. Rev. Neurosci. 2015;16:430–439. doi: 10.1038/nrn3963. - DOI - PubMed
    1. Carhart-Harris RL, et al. Neural correlates of the LSD experience revealed by multimodal neuroimaging. Proc. Natl Acad. Sci. 2016;113:4853–4858. doi: 10.1073/pnas.1518377113. - DOI - PMC - PubMed

Publication types