Clinical Trial
. 2022 Oct;28(11):1729-1743.
doi: 10.1177/13524585221094239. Epub 2022 Jun 29.

Early versus delayed treatment with glatiramer acetate: Analysis of up to 27 years of continuous follow-up in a US open-label extension study

Affiliations
Clinical Trial

Early versus delayed treatment with glatiramer acetate: Analysis of up to 27 years of continuous follow-up in a US open-label extension study

Corey C Ford et al. Mult Scler. 2022 Oct.

Abstract

Background: Glatiramer acetate (GA) is US-approved for relapsing multiple sclerosis.

Objectives: To describe GA long-term clinical profile. To compare effectiveness of early start (ES) versus delayed start (DS; up to 3 years) with GA.

Methods: Phase 3 trial participants entered a randomized placebo-controlled period then an open-label extension (OLE) with GA.

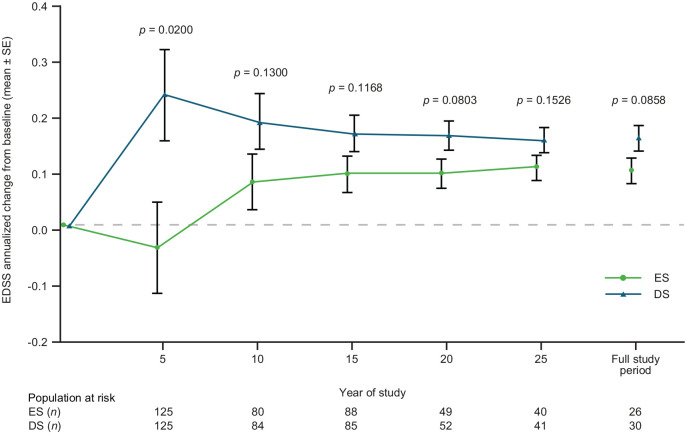
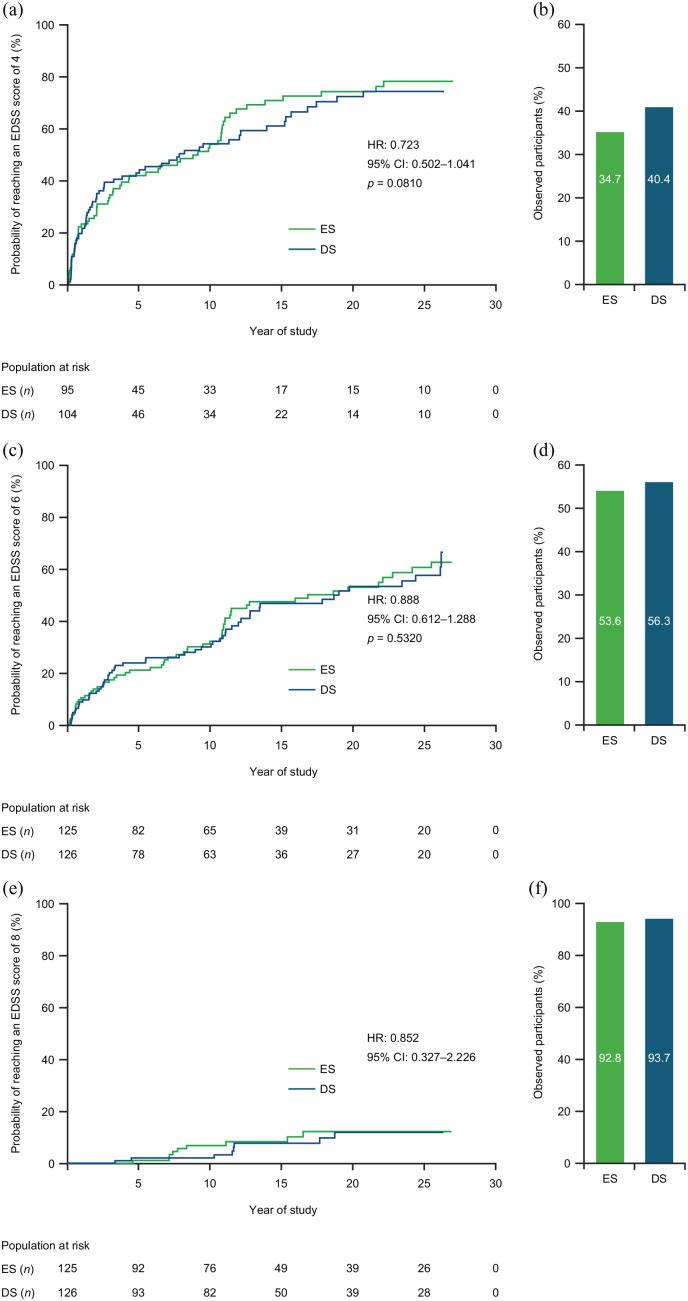
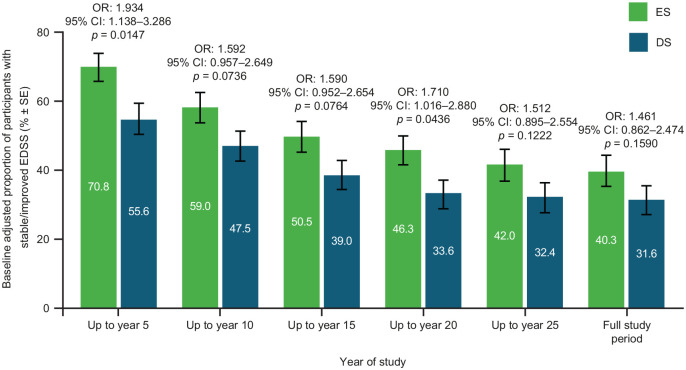
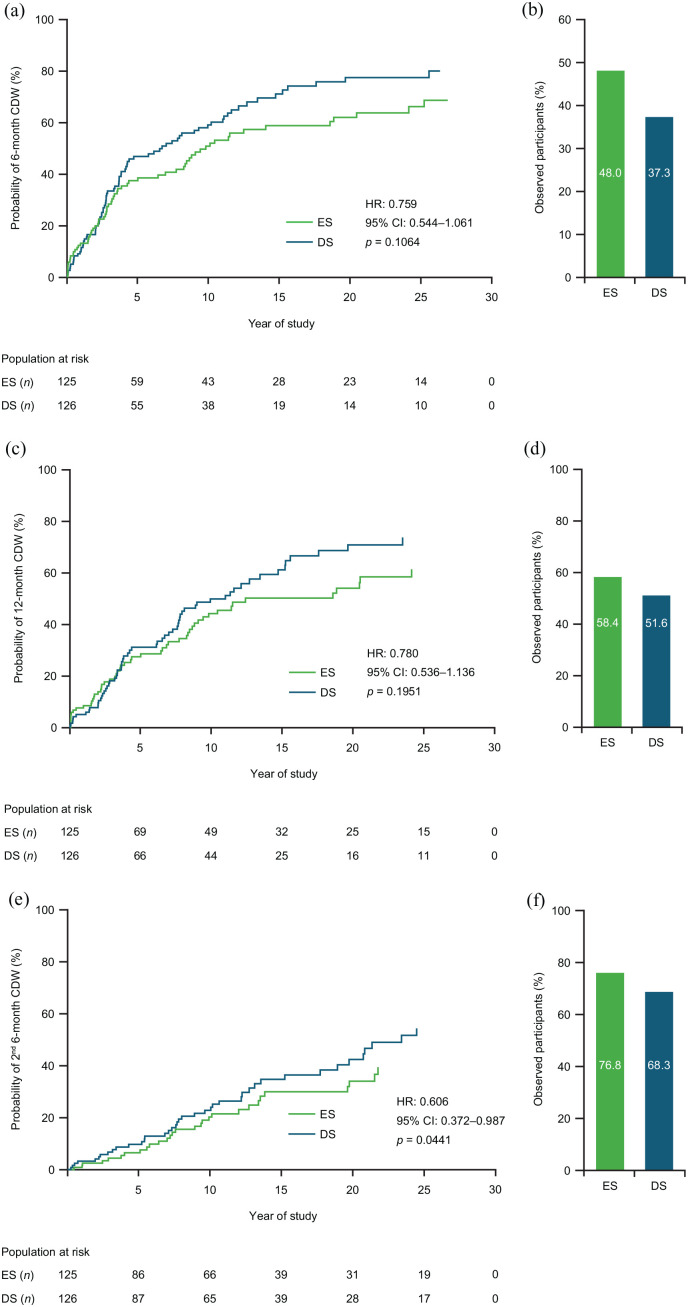
Results: Overall, 208 out of 251 (82.9%) randomized participants entered the OLE; 24 out of 101 (23.8%, ES) and 28 out of 107 (26.2%, DS) participants completed the OLE. Median GA treatment was 9.8 (0.1-26.3) years. Annualized change in Expanded Disability Status Scale (EDSS) score was lower with ES versus DS (p = 0.0858: full study; p = 0.002; Year 5). Participants with improved/stable EDSS was consistently higher with ES versus DS: 40.3% versus 31.6% (p = 0.1590; full study); 70.8% versus 55.6% (p = 0.015; Year 5). ES prolonged time-to-6-month confirmed disease worsening (CDW) versus DS (9.8 vs 6.7 years), time-to-12-month CDW (18.9 vs 11.6 years), and significantly reduced time-to-second-6-month CDW (p = 0.0441). No new safety concerns arose.

Conclusion: GA long-term treatment maintained clinical benefit with a similar safety profile to phase 3 results; a key limitation was that only 25% of participants completed the OLE. Early initiation of GA had sustained benefits versus delayed treatment.

Keywords: Clinical trial; disease-modifying therapies; glatiramer acetate; multiple sclerosis; quality of life; relapsing/remitting.


Conflict of interest statement

Declaration of Conflicting Interests: The author(s) declared the following potential conflicts of interest with respect to the research, authorship, and/or publication of this article: C.F. has received funding for research from Actelion, Adamas, Alkermes, Biogen, Genentech, Genzyme, Mallinckrodt, MedDay, Novartis, Roche, Sanofi-Aventis, Teva Pharmaceuticals, and TG Therapeutics; consulting fees from Merck Serono, Genzyme, and Actelion; and serving as a speaker for the MSAA and Consortium of MS Centers. J.A.C. reports personal compensation for consulting for Biogen, Bristol-Myers Squibb, Convelo, Genentech, Janssen, NervGen, Novartis, and PSI; speaking for H3 Communications; and serving as an Editor of Multiple Sclerosis Journal. A.D.G. has received personal compensation for consulting, serving on a scientific advisory board, or educational activities from Teva, SwanBio, GW Neuroscience, Janssen, Novartis and research support from Atara, Biogen, Genentech-Roche, Sanofi Genzyme, Novartis, and Teva Pharmaceuticals. J.W.L. has received personal compensation for consulting from Horizon, Mapi Pharmaceuticals, Biogen, Banner Life Sciences, and Genentech; is participating in clinical trials funded by Genentech, Biogen, Atara, EMD Serono, and Anokion; and has received research funding from the National MS Society and Genentech. R.P.L. reports personal compensation from Inform Consulting, bioStrategies Group, Schlesinger Group, Haven Consulting, Guidepoint Consulting, Decisions Resources Group, Health Advances, Novartis, Mallinckrodt, MedDay, UCB/Ra Pharmaceuticals, and Argenx; he has also received research funding from the National Multiple Sclerosis Society, NIH/NINDS, Argenx, Alexion, UCB/Ra Pharmaceuticals, Mallinckrodt, and Teva Pharmaceuticals; he has received publication royalties from Wiley Blackwell (International Neurology) and Oxford University Press (Neuroimmunology). C.L. has no relevant disclosures. A.P. has no relevant disclosures. J.R. receives research funding from NMSS, Guthy Jackson Charitable Foundation, NIH, Biogen, Teva Neuroscience, PCORI, and VA. H.R. has no relevant disclosures. J.S.W. has received personal compensation for consulting, serving on scientific advisory boards, data monitoring boards, speaking, or other activities with Alkermes, Avotres, Brainstorm Cell Therapeutics, Cleveland Clinic Foundation, EMD Serono, GW Pharma Ltd, Inmagene, MedDay Pharmaceuticals, NervGen Pharma Corp., Novartis/Sandoz, Roche/Genentech, Sanofi Genzyme, University of Alabama; and receives royalties for out-licensed monoclonal antibodies through UTHealth from Millipore Corporation. J.K.A. reports personal fees as a former employee of Teva Pharmaceuticals, she is an employee of Jazz Pharmaceuticals Inc,. S.E.K. is a former employee of Teva Pharmaceuticals, Netanya, Israel, and reports personal fees for consulting for Teva Pharmaceuticals. E.B.-H. reports personal fees as an employee of Teva Pharmaceuticals, Netanya, Israel. Y.S. is a former employee of Teva Pharmaceuticals, Netanya, Israel.

Figures

Figure 1.
Figure 1.
Annualized change from baseline in EDSS score by treatment group. The p values are from the mixed model repeated measures. EDSS: Expanded Disability Status Scale; ES: early start; DS: delayed start; SE: standard error.
Figure 2.
Figure 2.
Time-to-EDSS score and proportion of participants not reaching an EDSS score of (a and b) 4, (c and d) 6, or (e and f) 8. Kaplan–Meier curves. HR, CI, and p values are from the Cox proportional hazards model. CI: confidence interval; EDSS: Expanded Disability Status Scale; ES: early start; DS: delayed start; HR: hazard ratio.
Figure 3.
Figure 3.
Proportion of participants with stable/improved EDSS by treatment group. Stable/improved EDSS scores were defined as up to a 0.5-point increase from baseline, worsened EDSS scores were defined as a > 0.5 increase from baseline. Bars display percentage estimates ±SEs. OR, 95% CI and p values are from logistic regression model results; covariates used were baseline EDSS score and log of the number of relapses in the 2 years prior to study. CI: confidence interval; EDSS: Expanded Disability Status Scale; ES: early start; DS: delayed start; OR: odds ratio.
Figure 4.
Figure 4.
Annualized change from baseline in (a) ambulation index and in (b) FSS pyramidal function, by treatment group. The p values are from the mixed-model repeated measures. ES: early start; DS: delayed start; FSS: functional systems score; SE: standard error.
Figure 5.
Figure 5.
(a) Time-to-6-month CDW, (c) time-to-12-month CDW, and (e) time-to-second-6-month CDW; and participants free from (b) 6-month CDW, (d) 12-month CDW, and (f) 6-month CDW, by treatment group. Kaplan–Meier curves. HR, CI, and p values from the Cox proportional hazards model; covariates used were baseline EDSS score and log of the number of relapses in the 2 years prior to study. CDW defined as an increase in EDSS of 1 point from baseline for participants with a baseline EDSS of 5.0, or an increase in EDSS of 0.5 points from baseline for participants with a baseline EDSS of ⩾ 5.5. CDW: confirmed disease worsening; CI: confidence interval; EDSS: Expanded Disability Status Scale; ES: early start; DS: delayed start; HR: hazard ratio.
Figure 6.
Figure 6.
Proportion of participants meeting NEDA-2 criteria by treatment group. NEDA was defined as no relapse and no confirmed disease worsening. Bars display percentage estimates ±SEs. OR, 95% CI, and p values are from logistic regression model results; covariates used were baseline EDSS score and log of the number of relapses in the 2 years prior to study. CI: confidence interval; ES: early start; DS: delayed start; NEDA: no evidence of disease activity; OR: odds ratio; SE: standard error.
Figure 7.
Figure 7.
(a) ARR and (b) proportion of relapse-free participants by treatment group. The p values are from the negative binomial regression model (a) and logistic regression model (b). ARR: annualized relapse rate; CI: confidence interval; ES: early start; DS: delayed start; OR: odds ratio; SE: standard error.

References

    1. Musella A, Gentile A, Rizzo FR, et al.. Interplay between age and neuroinflammation in multiple sclerosis: Effects on motor and cognitive functions. Front Aging Neurosci 2018; 10: 238. - PMC - PubMed
    1. Gold R, Wolinsky JS, Amato MP, et al.. Evolving expectations around early management of multiple sclerosis. Ther Adv Neurol Disord 2010; 3(6): 351–367. - PMC - PubMed
    1. Thompson AJ, Baranzini SE, Geurts J, et al.. Multiple sclerosis. Lancet 2018; 391(10130): 1622–1636. - PubMed
    1. Freedman MS, Devonshire V, Duquette P, et al.. Treatment optimization in multiple sclerosis: Canadian MS Working Group Recommendations. Can J Neurol Sci 2020; 47(4): 437–455. - PubMed
    1. Grand’Maison F, Yeung M, Morrow SA, et al.. Sequencing of disease-modifying therapies for relapsing-remitting multiple sclerosis: A theoretical approach to optimizing treatment. Curr Med Res Opin 2018; 34(8): 1419–1430. - PubMed

Publication types

MeSH terms

Substances