. 2022 Jun 13:10:914053.
doi: 10.3389/fcell.2022.914053. eCollection 2022.

FBXO38 Ubiquitin Ligase Controls Sertoli Cell Maturation

Affiliations

FBXO38 Ubiquitin Ligase Controls Sertoli Cell Maturation

Nikol Dibus et al. Front Cell Dev Biol. .

Abstract

The ubiquitin ligase SCFFBXO38 controls centromeric chromatin by promoting the degradation of the ZXDB protein. To determine the importance of this pathway during development, Fbxo38-deficient mice were generated. The loss of FBXO38 resulted in growth retardation affecting several organs, including the male reproductive system. A detailed analysis of the mutant testes revealed pathological changes in the seminiferous tubules, accompanied by a significant decrease in sperm production and reduced fertility. In adult testes, FBXO38 was specifically expressed in Sertoli cells, a somatic population essential for spermatogenesis initiation and progression. Sertoli cells lacking FBXO38 exhibited stabilized ZXDB protein and upregulated centromeric chromatin. Furthermore, the gene expression profile revealed that the absence of FBXO38 led to a defect in Sertoli cell maturation, specifically characterized by dysregulation in genes controlling retinoic acid metabolism and intercellular communication. Consequently, we documented significant changes in their ability to initiate spermatogonial differentiation. In conclusion, we show that FBXO38 acts as a Sertoli cell maturation factor, affecting the Sertoli cell transcription program, centromere integrity, and, subsequently, the ability to control spermatogenesis.

Keywords: centromere; proteasome; retinoic acid; sertoli cell; spermatogenesis; ubiquitin; ubiquitin ligase.


Conflict of interest statement

The authors declare that the research was conducted in the absence of any commercial or financial relationships that could be construed as a potential conflict of interest.

Figures
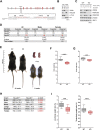
FIGURE 1
FIGURE 1
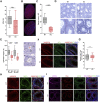
FBXO38 deficiency leads to growth retardation in mouse. (A) Scheme illustrating mouse Fbxo38 gene structure and its targeted disruption using a CRISPR/Cas9 genome-editing system. Two single guide RNAs (sgRNAs) were designed to target intron sequences (sequence in red) flanking exon four of the Fbxo38 gene. Translated exons are depicted in red color. PAM; protospacer adjacent motif, dashed line indicates deleted nucleotides in Fbxo38 ΔEx4/ΔEx4 animals. (B) SV40 immortalized MEF generated from Fbxo38 wild-type (WT) and knockout (KO) E13.5 embryos were subjected to lysis. Soluble and insoluble fractions were immunoblotted as indicated; ɑ-tubulin and histone H3 were used as loading and fractionation controls. (C) MEF (as in C) were treated with cycloheximide (CHX) for 3 h and pre-treated with MLN4924 for 1 h where indicated. Whole-cell lysates were immunoblotted as indicated. Staining of FBXO28 was used as a control for CUL1-dependent degradation. (D) Observed and expected mouse genotypes of weaned pups from heterozygous breedings. The proportion of mice with different genotypes was compared to expected Mendelian ratios by the Chi-square test. Significant deviations from the expected numbers are shown in red. (E) Representative images of Fbxo38 WT and KO littermate males of indicated age. Dpp; days postpartum. (F) Body weight of adult (17–21 weeks) Fbxo38 WT and KO males. Age distribution in both groups was the same (n = 15). Statistical significance was assessed by an unpaired two-tailed t-test. (G) Body length of animals as in (E). (H) Means ± standard deviations and p-values of organ weights of Fbxo38 WT and KO males as in (E) are summarized in the table. Statistical significance was assessed by an unpaired two-tailed t-test. Statistically significant p-values are highlighted in red (p-value < 0.05). (I) Liver (left) and testes (right) weight to body weight ratio of adult Fbxo38 WT and KO males (liver: n = 9; testes: n = 14). Individual data points are shown. Horizontal bars show mean values, boxes represent 25th and 75th percentiles. Statistical significance was assessed by an unpaired two-tailed t-test.
FIGURE 2
FIGURE 2
Reproduction and spermatogenesis are impaired in Fbxo38-deficient animals. (A) Litter size of WT females bred to Fbxo38 WT or KO males. Litters were recorded for the time period of 18–21 days after monitored vaginal plugs. Number of pups per litter are shown as individual data points, horizontal bars show mean values, boxes represent the 25th and 75th percentiles. Statistical significance was assessed by an unpaired two-tailed t-test. (B) Composite pictures of sagittal sections of Fbxo38 WT and KO testes labeled with peanut agglutinin (PNA) lectin and counterstained with DAPI. (C) Sperm counts of adult (17–21 weeks) Fbxo38 WT and KO males with the same age distribution in both groups. Spermatozoa were isolated from both caudae epididymides. Individual data points are shown, horizontal bars show mean values, boxes represent the 25th and 75th percentiles. Statistical significance was assessed by an unpaired two-tailed t-test. (D) Hematoxylin and eosin-stained testicular sections from 9-week-old Fbxo38 WT and KO males. Arrowheads point to atypical multinucleated cells, asterisks show disrupted tubules. Scale bar, 100 µm. (E) Height of germinal epithelium from young and adult Fbxo38 WT and KO animals (left) and methodological approach of measurement (right). Average height of germinal layer in two perpendicular axes was measured for each tubule (35 randomly selected round tubules from transversal section per animal). Horizontal bars show mean values, boxes represent the 25th and 75th percentiles. Statistical significance was assessed by an unpaired two-tailed t-test. Scale bar, 50 µm. (F) Seminiferous tubule sections of young adult (10 weeks) Fbxo38 WT and KO mice stained for Vimentin and WT1. DNA was visualized with DAPI. Scale bar, 50 µm. (G) The number of WT1-positive cells in round seminiferous tubules from sections of Fbxo38 WT and KO testes (n = 2; 24 tubules per animal). Horizontal bars show mean values, boxes represent the 25th and 75th percentiles. Statistical significance was assessed by an unpaired two-tailed t-test. (H) Seminiferous tubule sections of young adult (10 weeks) Fbxo38 WT and KO mice stained for Vimentin and SCP3. DNA was visualized with DAPI. Scale bar, 50 µm. (I) Seminiferous tubule sections of 17-week-old Fbxo38 WT and KO mice co-stained with antibodies against STRA8 and PITX2 and labeled with PNA. DNA was visualized using DAPI. Scale bar, 50 µm.
FIGURE 3
FIGURE 3
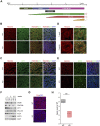
The timing of the first wave of spermatogenesis depends on FBXO38. (A) Schematic illustration of major events in the first wave of spermatogenesis. The timeline in the upper panel indicates postnatal age in weeks. The middle panel shows the occurrence of the individual processes in spermatogenesis and the lower panel indicates the time course of the formation of spermatogenic differentiation stages. (B,C) Testis sections of infant Fbxo38 wild-type (WT) and knockout (KO) littermate males at the age of 1 (B) and 2 weeks (C) postpartum stained for FBXO38 and WT1. DNA was visualized with DAPI. Scale bar, 50 µm. (D) Details of FBXO38 and WT1 localization in seminiferous tubule sections from WT mice at the age of 1 and 2 weeks from (B,C). White arrowheads show spermatogonia, red arrowheads point to Sertoli cells. Scale bar, 20 µm. (E) Co-immunofluorescence staining for FBXO38 and SCP3 of testis sections from Fbxo38 WT and KO mice at the age of 2 weeks. DAPI was used to stain DNA. Asterisks show tubules with negative SCP3 staining. Scale bar, 50 µm. (F) Western blot analysis of whole testes protein lysates from Fbxo38 WT and KO littermate males at the indicated age. Testes without tunica albuginea were homogenized and lysed in the presence of Benzonase nuclease and lysates were immunoblotted as indicated (G) Testis sections of Fbxo38 WT and KO littermate males at the age of 4.5 weeks labeled with peanut agglutinin (PNA) lectin and counterstained with DAPI. Scale bar, 200 µm. (H) Sperm counts of juvenile Fbxo38 WT and KO mice at the age of 6 weeks. Spermatozoa were isolated from the caudae epididymides. Individual data points are shown, horizontal bars show mean values, boxes represent the 25th and 75th percentiles. Statistical significance was assessed by the Mann-Whitney U test.
FIGURE 4
FIGURE 4
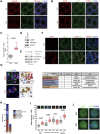
FBXO38 controls ZXDB protein and the centromeric chromatin in adult Sertoli cells. (A,B) Seminiferous tubule sections of young adult (10 weeks old) Fbxo38 wild-type (WT) and knockout (KO) mice co-stained for WT1 and FBXO38 (A) or ZXDB (B). DNA was visualized with DAPI. Scale bar, 50 µm. (C) Signal intensity of Sertoli cells from testicular sections of Fbxo38 WT and KO stained for ZXDB as in (B). The maximum normalized intensity of cells (n = 2; 15 Sertoli cells per animal) was measured. Horizontal bars show mean values, boxes represent the 25th and 75th percentiles. Statistical significance was assessed by an unpaired two-tailed t-test. (D) TM4 cells were either non-treated or treated with MLN4924 for 22 h. Whole-cell lysates were immunoblotted as indicated. (E) TM4 stably expressing HA-tagged ZXDA were subjected to cycloheximide chase. Where indicated, cells were pre-treated with MLN4924 for 1 h. Whole-cell lysates were immunoblotted as indicated. (F) Seminiferous tubule squash from adult Fbxo38 WT and KO mice stained with ZXDB antibody and anti-centromere antibodies (ACA). DNA was visualized with DAPI. Scale bar, 20 µm. (G) Representative images of testicular cell types (from KO animals) and staining for their characteristic markers used to identify the cell populations in a seminiferous tubule squash. The middle scheme illustrates the position and cell type shown in the left pictures. The table on the right depicts combination of the markers and features used for identification. (H) Composition of cell types in a seminiferous tubule squash as in (D). Each fraction is displayed as a percentage from the WT whole-squash count. Sertoli cell count was used for normalization between KO and WT animals. (I) The signal intensity of ACA staining in indicated cell types from testicular sections of Fbxo38 WT and KO mice as in (D). Maximum normalized intensity was measured. Individual data points from two independent experiments are shown. Horizontal bars show mean values, boxes represent the 25th and 75th percentiles. Statistical significance was assessed by an unpaired two-tailed t-test. (J) Representative magnified images of Sertoli cells from a seminiferous tubule squash from Fbxo38 WT and KO mice stained with ACA.
FIGURE 5
FIGURE 5
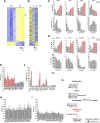
FBXO38-deficient Sertoli cells exhibit a maturation defect. (A) Normalized counts (fragments per kilobase million, FKPM) from RNA-seq analysis of Fbxo38 wild-type (WT) and knockout (KO) young adult (8 weeks old) Sertoli cells were visualized as a heat map showing gene expression normalized to the highest and lowest obtained count. Only 1,170 significantly regulated genes (FDR <0.05) are shown. The arrowhead points to Cyp26b1 gene. (B) Publicly available data of gene expressions in Sertoli cells from a different age of juvenile mouse males. The same set of genes as in (A) was visualized as a heat map showing gene expression normalized to the highest and lowest obtained count. Each time point represents the mean value of three different Sertoli cells isolations (GEO accession number GSE59698) (Zimmermann et al., 2015). Publicly available data were normalized using a GREIN application (http://www.ilincs.org/apps/grein/) (Mahi et al., 2019); dpp, days postpartum. (C) Upper panel: Expression (FKPM) of four markers of Sertoli cell maturation (Bmp4, Lhx9, Pdpn, and Cdh2) in Fbxo38 WT (grey) and KO (red) Sertoli cells (dataset as in A). Lower panel: Time course of publicly available gene expression of the same set of genes during Sertoli cell maturation. Each time point represents the mean value obtained from three different Sertoli cell isolations. Publicly available data were obtained and normalized as in (B). (D) Upper panel: Expression (FKPM) of four genes involved in retinoic acid metabolism (Aldh1a1, Aox1, Cyp26b1, and Rdh13) in Fbxo38 WT and KO Sertoli cells (dataset as in A). Lower panel: Time course of publicly available gene expression of the same set of genes during Sertoli cell maturation. Each time point represents the mean value obtained from three different Sertoli cell isolations. Publicly available data were obtained and normalized as in (B). (E) An average fold change (KO/WT; n = 3) of genes involved in retinoic acid metabolism. The graph represents an excerpt from the dataset shown in (A). Red columns show significantly upregulated genes in KO Sertoli cells (FDR <0.05). The blue columns show significantly downregulated genes in KO Sertoli cells (FDR <0.05). (F) An average count (FKPM) of genes involved in retinoic acid metabolism. The graph represents an excerpt from the dataset shown in (A). Each bar represents the mean value (WT—grey; KO—red; n = 3). (G) Schematic representation of retinoic acid metabolism with depicted fold changes in brackets—as in (D). The red font was used to highlight significantly upregulated genes in KO Sertoli cells (FDR <0.05). The blue font was used to highlight significantly downregulated genes in KO Sertoli cells (FDR <0.05). (H) Average fold changes (KO/WT; n = 3) of genes encoding laminins and collagens. The graph represents an excerpt from the dataset shown in (A). (I) Average fold changes (KO/WT; n = 3) of genes involved in the citric acid (Krebs) cycle. The graph represents an excerpt from the dataset shown in (A).

Similar articles

Cited by

References

    1. Akçimen F., Vural A., Durmuş H., Çakar A., Houlden H., Parman Y. G., et al. (2019). A Novel Homozygous FBXO38 Variant Causes an Early-Onset Distal Hereditary Motor Neuronopathy Type IID. J. Hum. Genet. 64 (11), 1141–1144. 10.1038/s10038-019-0652-y - DOI - PubMed
    1. Aleksandrova A., Galkin O., Koneni R., Fontes J. D. (2010). An N- and C-Terminal Truncated Isoform of Zinc Finger X-Linked Duplicated C Protein Represses MHC Class II Transcription. Mol. Cell Biochem. 337 (1-2), 1–7. 10.1007/s11010-009-0280-5 - DOI - PMC - PubMed
    1. Auharek S. A., de França L. R. (2010). Postnatal Testis Development, Sertoli Cell Proliferation and Number of Different Spermatogonial Types in C57BL/6J Mice Made Transiently Hypo- and Hyperthyroidic during the Neonatal Period. J. Anat. 216 (5), 577–588. 10.1111/j.1469-7580.2010.01219.x - DOI - PMC - PubMed
    1. Avelar G. F., Oliveira C. F. A., Soares J. M., Silva I. J., Dobrinski I., Hess R. A., et al. (2010). Postnatal Somatic Cell Proliferation and Seminiferous Tubule Maturation in Pigs: A Non-random Event. Theriogenology 74 (1), 11–23. 10.1016/j.theriogenology.2009.12.014 - DOI - PMC - PubMed
    1. Babicki S., Arndt D., Marcu A., Liang Y., Grant J. R., Maciejewski A., et al. (2016). Heatmapper: Web-Enabled Heat Mapping for All. Nucleic Acids Res. 44 (W1), W147–W153. 10.1093/nar/gkw419 - DOI - PMC - PubMed