

Cell Line Characteristics Predict Subsequent Resistance to Androgen Receptor-Targeted Agents (ARTA) in Preclinical Models of Prostate Cancer
- PMID: 35769712
- PMCID: PMC9234122
- DOI: 10.3389/fonc.2022.877613
Cell Line Characteristics Predict Subsequent Resistance to Androgen Receptor-Targeted Agents (ARTA) in Preclinical Models of Prostate Cancer
Abstract
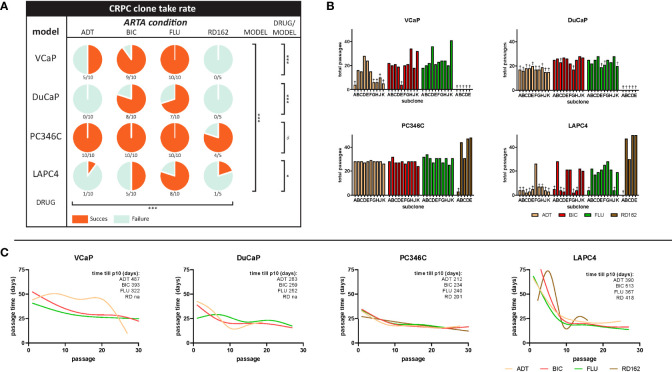
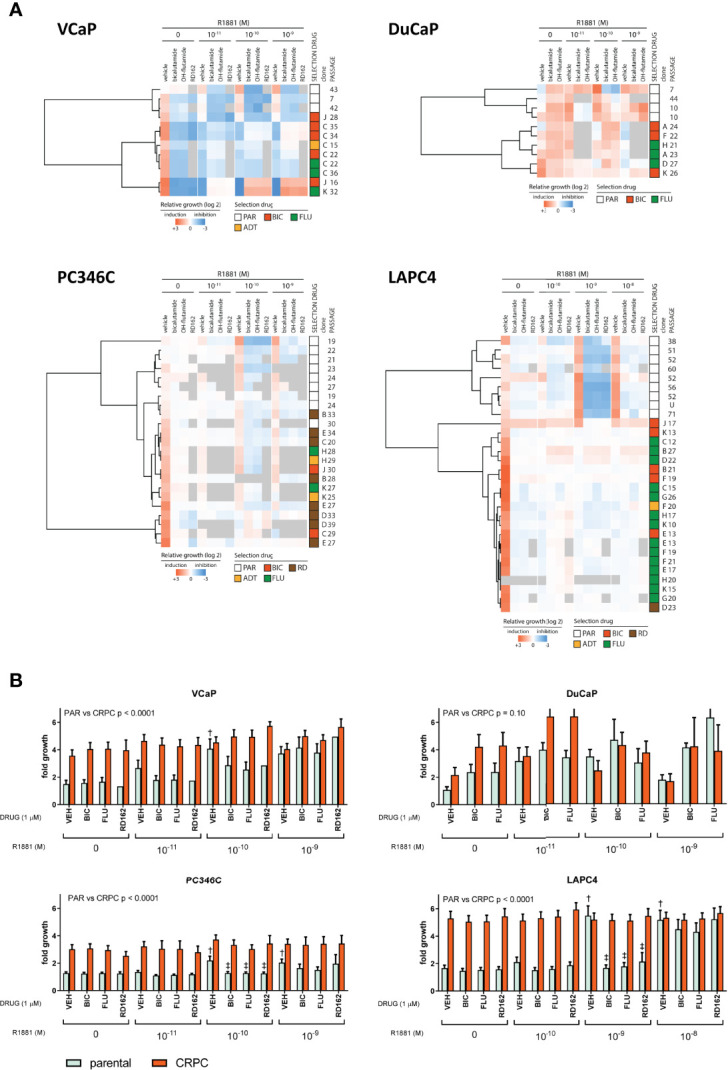
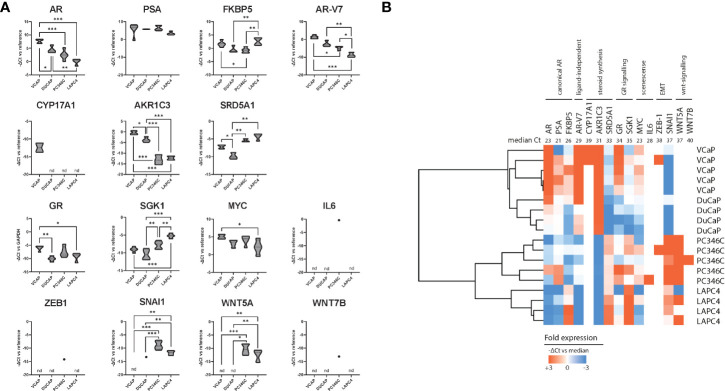
Treatment of prostate cancer (PCa) has changed considerably in the last decade due to the introduction of novel androgen receptor (AR)-targeted agents (ARTAs) for patients progressing on androgen deprivation therapy (ADT). Preclinical research however still relies heavily on AR-negative cell line models. In order to investigate potential differences in castration-resistant PCa (CRPC) growth, we set out to create a comprehensive panel of ARTA-progressive models from 4 androgen-responsive AR wild-type PCa cell lines and analyzed its androgen response as opposed to its ADT-progressive counterparts. Parallel cultures of VCaP, DuCaP, PC346C, and LAPC4 were established in their respective culture media with steroid-stripped fetal calf serum (FCS) [dextran-coated charcoal-stripped FCS (DCC)] without androgen (ADT) or in DCC plus 1 μM of the ARTAs bicalutamide, OH-flutamide, or RD162 (an enzalutamide/apalutamide analog). Cell growth was monitored and compared to those of parental cell lines. Short-term androgen response was measured using cell proliferation 3-(4,5-dimethylthiazol-2-yl)-2,5-diphenyltetrazolium bromide (MTT) assay. qRT-PCR was performed to assess the mRNA expression of markers for AR signaling, steroidogenesis, glucocorticoid receptor (GR) signaling, epithelial-mesenchymal transition (EMT), and WNT signaling. Out of 35 parallel cultures per cell line, a total of 24, 15, 34, and 16 CRPC sublines emerged for VCaP, DuCaP, PC346C, and LAPC4, respectively. The addition of bicalutamide or OH-flutamide significantly increased CRPC growth compared to ADT or RD162. VCaP, DuCaP, and PC346C CRPC clones retained an AR-responsive phenotype. The expression of AR and subsequent androgen response were completely lost in all LAPC4 CRPC lines. Markers for EMT and WNT signaling were found to be elevated in the resilient PC346C model and CRPC derivatives of VCaP, DuCaP, and LAPC4. Although the resistant phenotype is pluriform between models, it seems consistent within models, regardless of type of ARTA. These data suggest that the progression to and the phenotype of the CRPC state might already be determined early in carcinogenesis.
Keywords: ARTA; CRPC; DuCaP; LAPC4; PC346C; VCaP.
Copyright © 2022 Moll, Teubel, Erkens, Jozefzoon-Agai, Dits, van Rijswijk, Jenster and van Weerden.
Conflict of interest statement
The authors declare that the research was conducted in the absence of any commercial or financial relationships that could be construed as a potential conflict of interest.
Figures

Similar articles
-
A bypass mechanism of abiraterone-resistant prostate cancer: Accumulating CYP17A1 substrates activate androgen receptor signaling.Prostate. 2019 Jun;79(9):937-948. doi: 10.1002/pros.23799. Epub 2019 Apr 24. Prostate. 2019. PMID: 31017696 Free PMC article.
-
Treatment Sequences of Androgen Receptor–Targeted Agents for Prostate Cancer [Internet].Ottawa (ON): Canadian Agency for Drugs and Technologies in Health; 2021 Mar. Ottawa (ON): Canadian Agency for Drugs and Technologies in Health; 2021 Mar. PMID: 34260165 Free Books & Documents. Review.
-
Continued androgen signalling inhibition improves cabazitaxel efficacy in prostate cancer.EBioMedicine. 2021 Nov;73:103681. doi: 10.1016/j.ebiom.2021.103681. Epub 2021 Nov 5. EBioMedicine. 2021. PMID: 34749299 Free PMC article.
-
Therapeutic Potential of Bipolar Androgen Therapy for Castration-Resistant Prostate Cancer: In Vitro and In Vivo Studies.Biomedicines. 2024 Jan 15;12(1):181. doi: 10.3390/biomedicines12010181. Biomedicines. 2024. PMID: 38255286 Free PMC article.
-
Androgen receptors in hormone-dependent and castration-resistant prostate cancer.Pharmacol Ther. 2013 Dec;140(3):223-38. doi: 10.1016/j.pharmthera.2013.07.003. Epub 2013 Jul 13. Pharmacol Ther. 2013. PMID: 23859952 Review.
Cited by
-
Advances in research regarding epithelial-mesenchymal transition and prostate cancer.Front Cell Dev Biol. 2025 May 30;13:1583255. doi: 10.3389/fcell.2025.1583255. eCollection 2025. Front Cell Dev Biol. 2025. PMID: 40519259 Free PMC article. Review.
-
The MicroRNA miR-454 and the mediator complex component MED12 are regulators of the androgen receptor pathway in prostate cancer.Sci Rep. 2025 Mar 25;15(1):10272. doi: 10.1038/s41598-025-95250-0. Sci Rep. 2025. PMID: 40133664 Free PMC article.
-
RRP9 promotes prostate cancer metastasis and epithelial-mesenchymal transition through activation of the AKT/GSK3β/β-Catenin signaling pathway.Discov Oncol. 2025 Jun 17;16(1):1129. doi: 10.1007/s12672-025-02833-4. Discov Oncol. 2025. PMID: 40526312 Free PMC article.
-
Replacement of nitro function by free boronic acid in non-steroidal anti-androgens.RSC Med Chem. 2024 Sep 10;15(12):4018-38. doi: 10.1039/d4md00343h. Online ahead of print. RSC Med Chem. 2024. PMID: 39345716 Free PMC article.
References
-
- Cornford P, van denBergh RCN, Briers E, Van denBroeck T, Cumberbatch MG, De Santis M, et al. . EAU-EANM-ESTRO-ESUR-SIOG Guidelines on Prostate Cancer. Part II-2020 Update: Treatment of Relapsing and Metastatic Prostate Cancer. Eur Urol (2021) 79(2):263–82. doi: 10.1016/j.eururo.2020.09.046 - DOI - PubMed
LinkOut - more resources
Full Text Sources
Research Materials