. 2022 Jun 13:12:872017.
doi: 10.3389/fonc.2022.872017. eCollection 2022.

Increased Expression of Mitochondrial UQCRC1 in Pancreatic Cancer Impairs Antitumor Immunity of Natural Killer Cells via Elevating Extracellular ATP

Affiliations

Increased Expression of Mitochondrial UQCRC1 in Pancreatic Cancer Impairs Antitumor Immunity of Natural Killer Cells via Elevating Extracellular ATP

Hui Cong et al. Front Oncol. .

Abstract

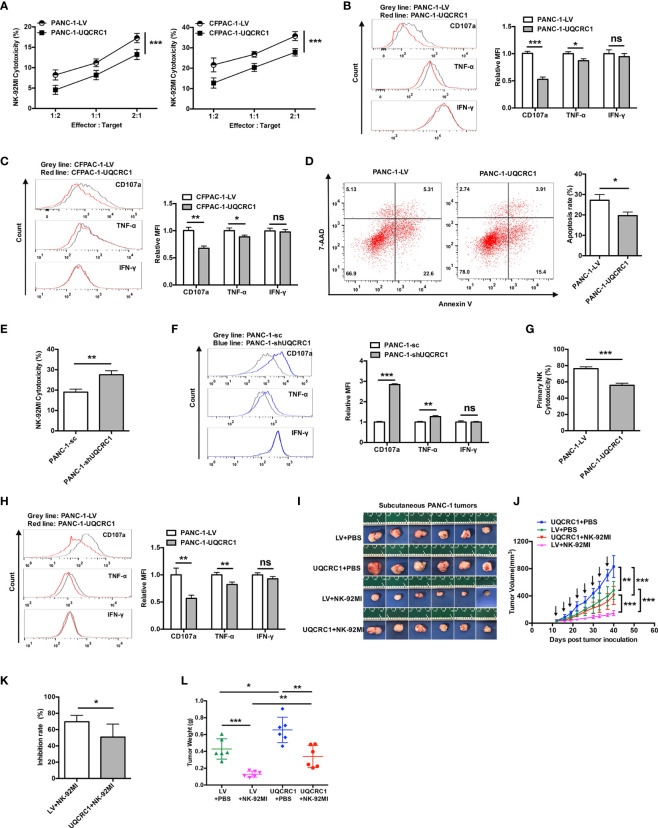
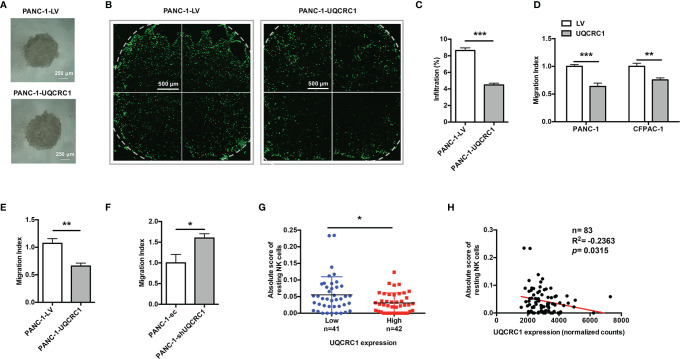
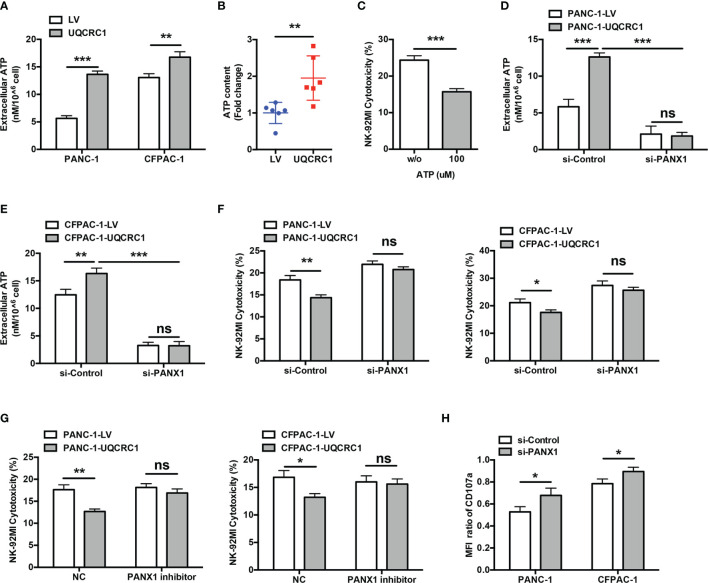
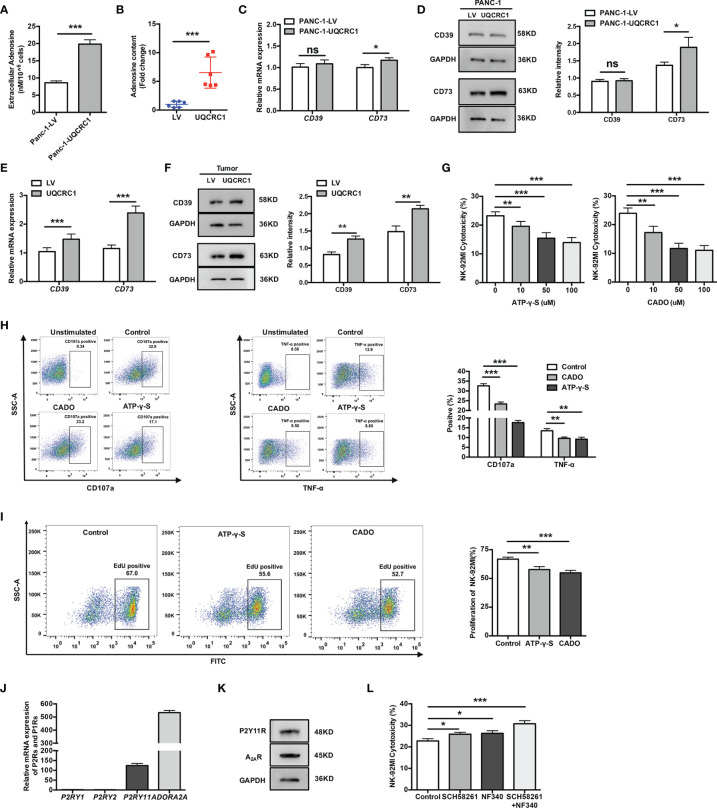
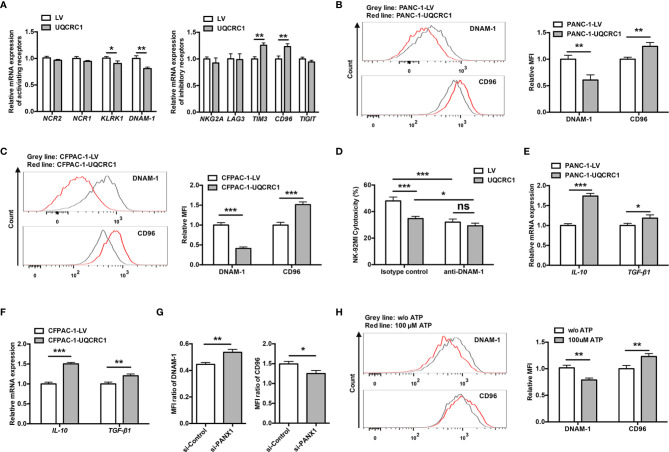
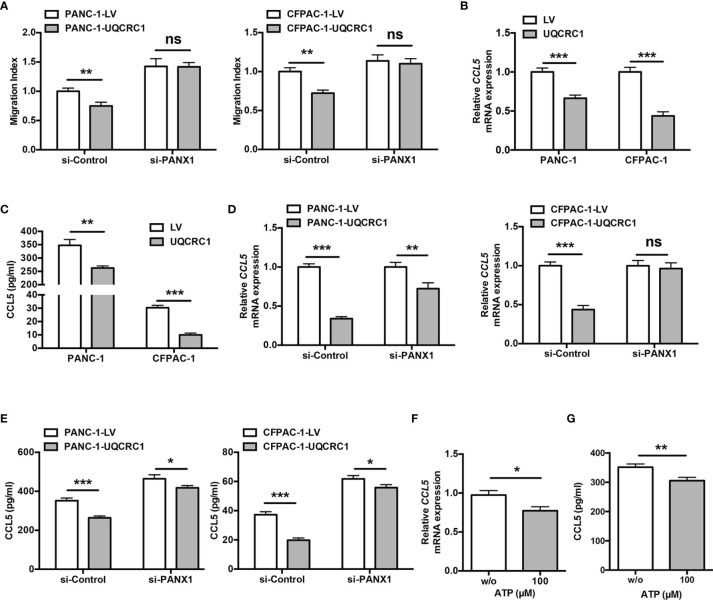
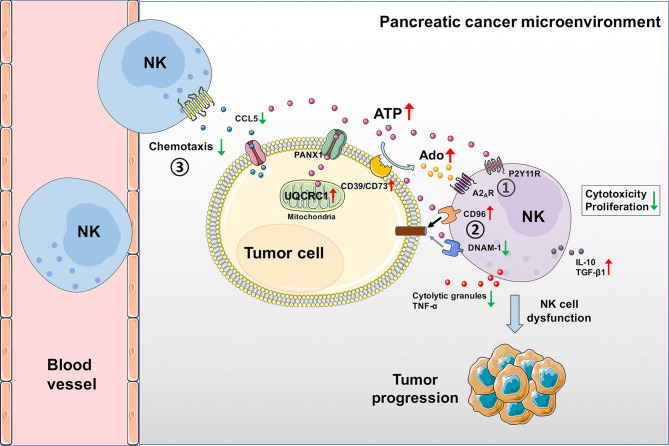
Pancreatic cancer (PC) is one of the most lethal malignancies characterized by a highly immunosuppressive tumor microenvironment (TME). Previously, we have reported that ubiquinol-cytochrome c reductase core protein I (UQCRC1), a key component of mitochondrial complex III, is generally upregulated in PC and produces extracellular ATP (eATP) to promote PC progression. Here, we sought to investigate whether the oncogenic property of UQCRC1 is generated through its effects on natural killer (NK) cells in the TME. We found that UQCRC1 overexpression in PC cells inhibited cytotoxicity of NK cells, as well as the infiltration of NK cells toward PC, whereas knockdown of UQCRC1 enhanced the cytotoxicity and chemotaxis of NK cells. Adoptive NK cell therapy in the subcutaneous mouse model and CIBERSORTx analysis with human PC specimens confirmed UQCRC1 elicited immunosuppressive effects on NK cells. Such UQCRC1-induced impairment of NK cells was mediated by eATP and its metabolite adenosine via P2Y11R and A2AR, respectively. Mechanistically, we found the UQCRC1/eATP axis reduced the expression of chemokine CCL5 in cancer cells and altered the balance of activating receptor DNAM-1 and inhibitory receptor CD96 on NK-92MI cells, resulting in decreased chemotaxis and exhausted phenotype of NK-92MI cells. Taken together, our study provides the evidence to support a novel mechanism by which energy metabolism change in cancer cells remodels the TME and impedes NK cell surveillance. It also suggests that targeting UQCRC1 may be a potential combined strategy for PC immunotherapy.

Keywords: Extracellular adenosine triphosphate; NK cells; UQCRC1; extracellular adenosine; pancreatic cancer.


Conflict of interest statement

The authors declare that the research was conducted in the absence of any commercial or financial relationships that could be construed as a potential conflict of interest.

Figures

Figure 1
Figure 1
UQCRC1 expressed in cancer cells inhibits the cytotoxicity of NK cells against PC. (A) Cytotoxicity of NK-92MI cells against UQCRC1-overexpressing or control PC cells (PANC-1 or CFPAC-1). The effector cells were co-cultured for 6 h with target cells at an effector: target (E: T) ratios of 2:1, 1:1, and 1:2. (B) Representative flow cytometry plots and quantification of CD107a, TNF-α, and IFN-γ expression in NK-92MI cells after co-culture with UQCRC1-overexpressing (red) or control (grey) PANC-1 and (C) CFPAC-1 cells at a ratio of 1:1 for 6 h. (D) Representative flow cytometry plots and quantification of NK cell-induced tumor cell apoptosis rates of tumor cells in the UQCRC1-overexpressing or control tumor spheroids after co-culture for 24 h. (E) Cytotoxicity of NK-92MI cells against UQCRC1-knockdown or control PANC-1 cells at an E: T ratio of 2:1. (F) Representative flow cytometry plots and quantification of CD107a, TNF-α, and IFN-γ expression in NK-92MI cells after co-culture with UQCRC1-knockdown (blue) or the control (grey) PANC-1 cells. (G) Cytotoxicity of primary NK cells against UQCRC1-overexpressing or control PANC-1 cells at an E: T ratio of 5:1. (H) Representative flow cytometry plots and quantification of CD107a, TNF-α, and IFN-γ expression in primary NK cells after co-culture with UQCRC1-overexpressing (red) or the control (grey) PANC-1 cells at a ratio of 1:1 for 6 h. (I–L) The subcutaneous xenografts, tumor growth curves, tumor inhibition rate, and the tumor weights in NPSG mice inoculated with UQCRC1-overexpressing or control PANC-1 cells for 40 days (n = 6). Black arrows indicate the day on which mice accepted PBS or NK cell therapy. All data are presented as the mean ± SD (n = 3 independent biological replicates unless otherwise indicated). *, p < 0.05; **, p < 0.01; ***, p < 0.001; ns, not significant.
Figure 2
Figure 2
UQCRC1 expressed in cancer cells impairs the migration and infiltration of NK cells into PC. (A) Microscopic images of UQCRC1-overexpressing and control PANC-1 spheroids (magnification 4x). Scale bar = 250μm. (B) The confocal microscopic images of PANC-1 spheroids after co-culture with NK-92MI cells at an E: T ratio of 2: 1 for 24 h. Scale bar = 500μm. (C) Flow cytometric analyses of the proportions of NK-92MI cells infiltrated in the spheroids after 24 h of co-culture. (D) Transwell migration assay of NK-92MI cells toward the culture supernatant from UQCRC1-overexpressing or control PC cells. (E) Transwell migration assay of primary NK cells toward the culture supernatant from UQCRC1-overexpressing or control PANC-1 cells. (F) Transwell migration assay of NK-92MI cells toward the culture supernatant from UQCRC1-knockdown or control PANC-1 cells. (G) Comparison of the infiltration of resting NK cells in PC samples grouped by UQCRC1 expression (n=83). (H) The correlation analysis between UQCRC1 expression and the infiltration of resting NK cells in PC samples (n = 83). All data are presented as the mean ± SD (n = 3 independent biological replicates unless otherwise indicated). *, p < 0.05; **, p < 0.01; ***, p < 0.001.
Figure 3
Figure 3
Increased eATP mediates the UQCRC1-induced inhibition of NK cell cytotoxicity. (A) The eATP levels in the culture supernatant from UQCRC1-overexpressing and control PC cells. (B) The ATP content in UQCRC1-overexpressing and control subcutaneous xenografts. (C) The cytotoxicity of NK-92MI cells against parental PANC-1 cells in the presence of exogenous ATP. Before co-culture, the NK-92MI cells were pre-treated with 100 μM ATP for 3 h. (D) The eATP levels of UQCRC1-overexpressing and control PANC-1 or (E) CFPAC-1 cells after PANX1 knockdown. (F) The cytotoxic activity of NK-92MI cells against si-PANX1-treated UQCRC1-overexpressing or control PC (PANC-1 or CFPAC-1) cells. (G) The cytotoxicity of NK-92MI cells against UQCRC1-overexpressing or control PC cells (PANC-1 or CFPAC-1) in the presence of PANX1 inhibitor. Before co-culture, the PC cells were pre-treated with 100 μM 10Panx for 24h. (H) The expression changes of CD107a in NK-92MI cells after co-culture with si-PANX1-treated UQCRC1-overexpressing or control PC cells. The MFI ratio of CD107a was calculated as the MFI of CD107a in NK cells incubated with UQCRC1-overexpressing tumor cells divided by the MFI of CD107a in NK cells incubated with control cells. All data are presented as the mean ± SD (n = 3 independent biological replicates). *, p < 0.05; **, p < 0.01; ***, p < 0.001; ns, not significant.
Figure 4
Figure 4
ATP and its metabolite adenosine inhibit NK cells by engaging P2Y11R and A2AR. (A) The Ado levels in the culture supernatant of UQCRC1-overexpressing and control PANC-1 cells. (B) The Ado content in UQCRC1-overexpressing and control PC subcutaneous xenografts. (C) The relative mRNA levels of CD39 and CD73 in UQCRC1-overexpressing and control PANC-1 cells. (D) The representative images of the protein levels of CD39 and CD73 in UQCRC1-overexpressing and control PANC-1 cells. (E) The relative mRNA levels of CD39 and CD73 in UQCRC1-overexpressing and control tumor xenografts. (F) The representative images of the protein levels of CD39 and CD73 in UQCRC1-overexpressing and control tumor xenografts. (G) The cytotoxicity of NK-92MI cells against parental PANC-1 cells in the presence of ATP-γ-S or CADO. Before co-culture, the NK-92MI cells were pre-incubated with 100 μM ATP-γ-S or 50 μM CADO for 3 h. (H) Representative flow cytometry plots and quantification of CD107a positive or TNF-α positive NK-92MI cells after co-culture with parental PANC-1 cells in the presence of ATP-γ-S or CADO. Before co-culture, the NK-92MI cells were pretreated as above-mentioned. (I) The proliferation rate of NK-92MI cells after being treated with 100 μM ATP-γ-S or 50 μM CADO for 24 h. (J) The relative mRNA expression of P2RY1, P2RY2, P2RY11, and ADORA2A in NK-92MI cells. (K) The protein levels of P2Y11R and A2AR in NK-92MI cells by Western Blot. (L) The cytotoxicity of NK-92MI cells toward UQCRC1-overexpressing PANC-1 cells. Before co-culture, the NK-92MI cells were pretreated with 1 μM SCH58261 and/or 10 μM NF340 for 30 min. All data are presented as the mean ± SD (n = 3 independent biological replicates). *, p < 0.05; **, p < 0.01; ***, p < 0.001; ns, not significant.
Figure 5
Figure 5
UQCRC1/eATP axis induces NK cells to a more inhibitory phenotype via altering the balance of DNAM-1 and CD96. (A) The relative mRNA expression of genes encoding activating or inhibitory receptors in NK-92MI cells after co-culture with UQCRC1-overexpressing or control PANC-1 cells for 6 h. (B) Representative flow cytometry plots and quantification of DNAM-1 and CD96 on NK-92MI cells after co-cultured with UQCRC1-overexpressing (red) or control (grey) PANC-1 cells. (C) Representative flow cytometry plots and quantification of DNAM-1 and CD96 on NK-92MI cells after co-culture with UQCRC1-overexpressing (red) or control (grey) CFPAC-1 cells. (D) The cytotoxicity of NK-92MI cells against PANC-1 cells at an E: T ratio of 5:1 in the presence or absence of anti-DNAM-1 blocking antibody (n=4). (E) The relative mRNA levels of IL-10 and TGF-β1 in NK-92MI cells after co-culture with UQCRC1-overexpressing or control PANC-1 or (F) CFPAC-1 cells. (G) The expression changes of DNAM-1 and CD96 on NK-92MI cells after co-culture with si-PANX1-transfected UQCRC1-overexpressing or control CFPAC-1 cells. The MFI ratio of DNAM-1 was calculated as the MFI of DNAM-1 in NK cells incubated with UQCRC1-overexpressing cells divided by the MFI of DNAM-1 in NK cells incubated with control cells. The same method was used to calculate the MFI ratio of CD96. (H) Representative flow cytometry plots and quantification of DNAM-1 and CD96 on NK-92MI cells after co-incubated with parental CFPAC-1 cells in the presence of 100 μM ATP for 6 h. All data are presented as the mean ± SD (n = 3 independent biological replicates unless otherwise indicated). *, p < 0.05; **, p < 0.01; ***, p < 0.001; ns, not significant.
Figure 6
Figure 6
UQCRC1/eATP axis impairs NK cell chemotaxis via decreasing CCL5 expression in PC cells. (A) The transwell migration assay of NK-92MI cells toward the culture supernatant from si-PANX1-transfected UQCRC1-overexpressing or control PC (PANC-1 or CFPAC-1) cells. (B) Relative mRNA levels of CCL5 in UQCRC1-overexpressing and control PC cells. (C) ELISA assay of CCL5 levels in culture supernatant of UQCRC1-overexpressing and control PC cells after 24 h of incubation. (D) The relative mRNA levels of CCL5 in UQCRC1-overexpressing or control PC (PANC-1 or CFPAC-1) cells after PANX1 knockdown. (E) ELISA assay of CCL5 levels in culture supernatant of UQCRC1-overexpressing and control PC cells after PANX1 knockdown. (F) The relative mRNA levels of CCL5 in the parental PANC-1 cells after being treated with or without 100 μM ATP for 24 h. (G) ELISA assay of CCL5 levels in culture supernatant of parental PANC-1 cells after being treated with or without 100 μM ATP for 24 h. All data are presented as the mean ± SD (n = 3 independent biological replicates). *, p < 0.05; **, p < 0.01; ***, p < 0.001; ns, not significant.
Figure 7
Figure 7
Schematic diagram of UQCRC1-induced inhibition of NK cells in the PC microenvironment. UQCRC1 upregulation in PC cells impairs the cytotoxicity and migration of NK cells by generating extra eATP, thereby promoting tumor progression. The overproduced eATP exerts its suppressive effect on NK cells in three ways: (1) Increased eATP can be hydrolyzed to eAdo by elevated expression of CD39 and CD73 on the surface of UQCRC1-overexpressing cancer cells. The eATP and eAdo inhibit the cytotoxicity and proliferation of NK cells by engaging P2Y11R and A2AR. (2) Increased eATP induces NK cells to a more inhibitory phenotype by reducing DNAM-1 expression and increasing CD96 expression, reflected by elevated levels of IL-10 and TGF-β1. (3) Increased eATP decreases the chemotaxis of NK cells by reducing the CCL5 expression and secretion of UQCRC1-overexpressing cancer cells.

Similar articles

Cited by

References

    1. Siegel RL, Miller KD, Jemal A. Cancer Statistics, 2020. CA Cancer J Clin (2020) 70(1):7–30. doi: 10.3322/caac.21590 - DOI - PubMed
    1. Weinberg SE, Chandel NS. Targeting Mitochondria Metabolism for Cancer Therapy. Nat Chem Biol (2015) 11(1):9–15. doi: 10.1038/nchembio.1712 - DOI - PMC - PubMed
    1. Ashton TM, McKenna WG, Kunz-Schughart LA, Higgins GS. Oxidative Phosphorylation as an Emerging Target in Cancer Therapy. Clin Cancer Res (2018) 24(11):2482–90. doi: 10.1158/1078-0432.CCR-17-3070 - DOI - PubMed
    1. Liang C, Qin Y, Zhang B, Ji S, Shi S, Xu W, et al. . Energy Sources Identify Metabolic Phenotypes in Pancreatic Cancer. Acta Biochim Biophys Sin (Shanghai) (2016) 48(11):969–79. doi: 10.1093/abbs/gmw097 - DOI - PubMed
    1. Vaziri-Gohar A, Zarei M, Brody JR, Winter JM. Metabolic Dependencies in Pancreatic Cancer. Front Oncol (2018) 8:617. doi: 10.3389/fonc.2018.00617 - DOI - PMC - PubMed

LinkOut - more resources