. 2022 Jun 13:13:929490.
doi: 10.3389/fgene.2022.929490. eCollection 2022.

Transcriptional Basis for Haustorium Formation and Host Establishment in Hemiparasitic Psittacanthus schiedeanus Mistletoes

Affiliations

Transcriptional Basis for Haustorium Formation and Host Establishment in Hemiparasitic Psittacanthus schiedeanus Mistletoes

Enrique Ibarra-Laclette et al. Front Genet. .

Abstract

The mistletoe Psittacanthus schiedeanus, a keystone species in interaction networks between plants, pollinators, and seed dispersers, infects a wide range of native and non-native tree species of commercial interest. Here, using RNA-seq methodology we assembled the whole circularized quadripartite structure of P. schiedeanus chloroplast genome and described changes in the gene expression of the nuclear genomes across time of experimentally inoculated seeds. Of the 140,467 assembled and annotated uniGenes, 2,000 were identified as differentially expressed (DEGs) and were classified in six distinct clusters according to their expression profiles. DEGs were also classified in enriched functional categories related to synthesis, signaling, homoeostasis, and response to auxin and jasmonic acid. Since many orthologs are involved in lateral or adventitious root formation in other plant species, we propose that in P. schiedeanus (and perhaps in other rootless mistletoe species), these genes participate in haustorium formation by complex regulatory networks here described. Lastly, and according to the structural similarities of P. schiedeanus enzymes with those that are involved in host cell wall degradation in fungi, we suggest that a similar enzymatic arsenal is secreted extracellularly and used by mistletoes species to easily parasitize and break through tissues of the host.

Keywords: Psittacanthus schiedeanus; haustorium; mistletoe; parasitic plant; transcriptome.


Conflict of interest statement

The authors declare that the research was conducted in the absence of any commercial or financial relationships that could be construed as a potential conflict of interest.

Figures
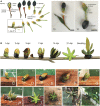
FIGURE 1
FIGURE 1
The Psittacanthus schiedeanus mistletoe seed inoculation experiment. (A) One-seeded ripe fruits had their epicarp manually removed, and seeds collected were then placed and glued with their viscin on wooden rectangle sticks (30–50 cm long) and placed at 5 cm from each other. Images show emerging embryo when manually pushed out before being placed on the wooden rectangle sticks aided by the green viscin and an extracted embryo with viscin at the base and epicarp removed. These are referred in the text as pre-inoculation, pre-sprouting seeds (time 0; T0). Morphology and anatomy of the infructescence and fruit are illustrated in Supplementary Figure S1. (B) Illustration of different development stages of inoculated seeds after 1–28 days after inoculation/germination (dai/dag) based on photographs. The plant material used for the RNA-seq study consisted of chlorophyllous material from the manually extracted seeds (T0), as illustrated in (A) and from four different development stages of the seeds formed by the polycotylous embryo (T1T4: 7, 14, 21, and 28 dai/dag. (C–F) Images of inoculated seeds placed on the wooden rectangle sticks, from one to 4 days after inoculation/germination (T1T4). Note how the viscin dries out, the base of the embryo becomes black (the scar-like dark-area that potentially includes the suspensor that is pushed aside by the emerging haustorial organ, which is not morphologically terminal, but it develops from the flanks of the apical dome; (Kuijt, 1970; Kuijt, 2009) and the embryo’s envelope or seed cover breaks about the middle after 4 days of seed inoculation. (GJ) Images of seeds after 7 (T7), 14 (T14), 21 (T21) and 28 (T28) dai/dag, with samplings taken for the RNA-seq study from T0, T1T4, T7, T14, T21 and T28. After seven dai/dag the polycotylous embryo starts opening by day 7 (cotyledons spread) and becomes fully open by day 21. After 28 dai/dag, the prismatic lobes (67 cotyledons) of the star-shaped bodies (polycotylous embryo), and which maybe enclose the embryo, start to lose turgor and after a period, they perished. (K) Seed inoculated on a branch of a live host after 3540 days. Note the putative leaf primordia at center of the star-shaped body. (L) Seedling with the first true leaves starting to emerge after 5 months of inoculation/germination. Photos by Juan Francisco Ornelas (A,C–L). Scale bar = 0.5 cm. Illustrations by Julieta Ornelas Peresbarbosa (A,B).
FIGURE 2
FIGURE 2
Phylogenetic tree and percent of Psittacanthus schiedeanus genes annotated by homology-based inference. The Bayesian phylogenetic tree (on the left) was constructed based on 17 single-copy orthologs nuclear genes (a total of 19,692 nt) shared among 21 angiosperm plant species analyzed. Numbers near the nodes indicate Bayesian posterior probabilities. On the right of the phylogenetic tree and for each plant species included, the percent of P. schiedeanus uniGenes that were annotated based on their homologous proteins. Homolog’s search was carried out by using the BLASTp algorithm (cut-off e-value of 10−5).
FIGURE 3
FIGURE 3
Expression patterns of Differentially Expressed uniGenes (DEG) identified in the transcriptome of Psittacanthus schiedeanus and involved in the compound endosperm development. (A) Elbow criterion applied over the curve of within-class sum-of-squares per number of clusters. The gray point is considered the elbow (k = 6). (B) t-SNE plot which shows clustering of 2,096 DEGs. The uniGenes coordinates are based on t-SNE dimensionality reduction according to the six expression profile categories (Clusters A–F) defined by the elbow method. uniGenes are represented by distinct marks shape and colored according to their cluster membership. In (C), a heatmap (Log2-transformed Fold Change (FC) values) of DEG and belonging to each of the six distinctly defined clusters and represented in t-SNE map. As indicated at the bottommost, each column in the heatmap corresponds to each of the sampling points or days after germination (dag) [T1 (7 dag); T2 (14 dag); T3 (21 dag); T4 (28 dag)]. The cluster color code is on the left of the heatmap. The color scale bar indicates up (red) or down-regulation (blue) on each compound endosperm development stage (T1–T4) relative to the T0 (the mistletoe pre-sprouting seeds). Finally, in (D) panel, box plots depicting the expression pattern of DEG on each of the defined clusters (Clusters A–F; top to bottom, left to right). The median (middle quartile) marks the mid-point of the data and is shown by the line that divides each of the boxes into two parts. The top and bottom whiskers indicate the maximum and minimum expression values, respectively, excluding outliers. In this panel, dots (uniGenes) were colored according to each of the expression profile categories defined by t-SNE algorithm while their intensities (light to dark in color) represent the timeline of sampling points (7, 14, 21, and 28 dag, respectively).
FIGURE 4
FIGURE 4
Gene Ontology enrichment of upregulated Psittacanthus schiedeanus uniGenes and involved in compound endosperm development after seed germination. (A) Manhattan plot illustrating the GO enrichment analysis results separated into the three major categories: MF (molecular functions), BP (biological processes), and CC (cellular components). The number in the source name in the x-axis labels shows how many GO terms were significantly enriched (g:SCS threshold, p-value ≤0.05). (B) Biological processes CirGO visualization plot. Intensity shades of colored categories reflect hierarchical relations between GO classes that were found enriched. Each subclass is represented in the plot by a white divisor line within each parent class, i.e., solid colors of the central pie charts. Features identities and names of all enriched functional categories (GO-terms) are reported in Supplementary Table S10.
FIGURE 5
FIGURE 5
Gene Ontology enrichment of downregulated Psittacanthus schiedeanus uniGenes involved in compound endosperm development after seed germination. (A) Manhattan plot illustrating the GO enrichment analysis results separated into the three major categories: MF (molecular functions), BP (biological processes), and CC (cellular components). The number in the source name in the x-axis labels shows how many GO terms were significantly enriched (g:SCS threshold, p-value ≤0.05). (B) Biological processes CirGO visualization plot. Intensity shades of colored categories reflect hierarchical relations between GO classes that were found to be enriched. Each subclass is represented in the plot by a white divisor line within each parent class, i.e., solid colors of the central pie charts. Features identities and names of all enriched functional categories (GO-terms) are reported in Supplementary Table S10.
FIGURE 6
FIGURE 6
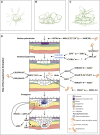
Germination in Psittacanthus schiedeanus and genes network presumably involved in haustorium formation. (A) Seedling inverted which show the emergence of the (oval) primary haustorium just below the small suspensor scar. (B) Older seedling showing the grooved haustorial cushion formed upon penetration. (C) Established seedling with early primary leaves. The tips of prismatic lobes of star-shaped bodies are removed in (B,C) (Re-drawn from Kuijt, 1970, ; Drawings by Julieta Ornelas Peresbarbosa). (D) Gene’s network regulating intrusive organ formation (haustorium) in P. schiedeanus. Different colors denote different tissues. Initiation and emergence rely on gene networks regulated by auxin (IAA), jasmonic acid (JA), and strigolactones. The yellow star next to the name of some proteins indicates that they were identified as DEGs. Genes/proteins with a question mark refer those that were not identified into the uniGenes collection generated in the present study. Abbreviations: GATAs, members of GATA family of transcription factors, zinc finger DNA binding proteins that control the development of diverse organs and tissues; ARFs, members of the auxin response factor family; IAAs, transcription regulators acting as repressors of auxin-inducible genes; LBDs, LOB domain-containing proteins; E2FE, E2F-like protein, an inhibitor of the endocycle, preserves the mitotic state of proliferating cells by suppressing transcription of genes that are required for cells to enter the DNA endoreduplication cycle; CYCB1s, Cycling family proteins; AGOs, ARGONAUTE family proteins; GH3s, Auxin-responsive GH3 family proteins; MAX2, MORE AXILLARY BRANCHES 2, members of the F-box leucine-rich repeat family of proteins; MAX1, MORE AXILLARY BRANCHES 1, members of the CYP711A cytochrome P450 family; MAX3,4, MORE AXILLARY BRANCHES 3,4 encodes proteins with similarity to carotenoid cleaving deoxygenases; PIN3, a regulator of auxin efflux, involved in differential growth; LAX2, a member of the AUX1 LAX family of auxin influx carriers; EXPs, expansins; PLTs, PLETHORA proteins; WOXs, WUSCHEL related homeobox proteins. Expression profiles of each of P. schiedeana uniGenes considered as orthologs (and paralogs) to each protein represented in the figure are shown in Supplementary Table S14.
FIGURE 7
FIGURE 7
3D structure from some polygalacturonases (PG) members of GH28 family. From top to bottom, the PG from the phytopatogenic fungus Fusarium moniliforme (reference protein, PDB ID: 1HG8; Federici et al., 2001)) followed by the modelled PG of the mistletoe Psittacanthus schiedeanus. The PG from P. schiedeanus [UN045719, UN068437, and UN097465; cyan, green, and purple, respectively] were superimposed one by one with reference protein (red). From left to right (besides the 3D structures), a magnified image with the highly conserved amino acid residues which form the cleft of the active site, is shown. This image is followed by others with the estimated distance between the catalytic residues (three aspartic acid (Asp) residues) and finally, an electrostatic surface charge representation. The yellow dotted circles show the active site with a relatively low presence of positive charges. After alignment and the superimposing of the 3D modelled structures, the equivalent position of every amino acid residue into the active site is shown. PG 3D proteins models from P. schiedeanus were constructed in silico based on the homology to cited proteins and their solved crystal structure.
FIGURE 8
FIGURE 8
3D structure from an endo-β-1,4-mannanase (EβM-1,4) from Psittacanthus schiedeanus (enzyme member of GH5-7 family). From top to bottom, the EβM-1,4 from the phytopathogenic fungus Aspergillus niger BK01 (reference protein, PDB ID: 3WH9) followed by one of the modelled EβM-1,4 of the mistletoe P. schiedeanus. The EβM-1,4 from P. schiedeanus (UN045719, cyan) was superimposed with reference protein (red). From left to right (besides the 3D structures), a magnified image with the highly conserved amino acid residues which form the slot-like pocket from the active site is shown. This image is followed by another with the estimated distance between the catalytic residues (two glutamic acid (Glu) residues) and finally, an electrostatic surface charge representation. The yellow dotted circles show the active site with a relatively low presence of positive charges. After alignment and the superimposing of the 3D modelled structures, the equivalent position of every amino acid residue into the active site is shown. EβM-1,4 3D protein model from P. schiedeanus were constructed in silico based on the homology to cited proteins and their solved crystal structure.

References

    1. Almagro Armenteros J. J., Sønderby C. K., Sønderby S. K., Nielsen H., Winther O. (2017). DeepLoc: Prediction of Protein Subcellular Localization Using Deep Learning. Bioinformatics 33, 3387–3395. 10.1093/bioinformatics/btx431 - DOI - PubMed
    1. Alonge M., Soyk S., Ramakrishnan S., Wang X., Goodwin S., Sedlazeck F. J., et al. (2019). RaGOO: Fast and Accurate Reference-Guided Scaffolding of Draft Genomes. Genome Biol. 20, 224. 10.1186/s13059-019-1829-6 - DOI - PMC - PubMed
    1. Altschul S. F., Gish W., Miller W., Myers E. W., Lipman D. J. (1990). Basic Local Alignment Search Tool. J. Mol. Biol. 215, 403–410. 10.1016/s0022-2836(05)80360-2 - DOI - PubMed
    1. Armand S., Wagemaker M. J. M., Sánchez-Torres P., Kester H. C. M., van Santen Y., Dijkstra B. W., et al. (2000). The Active Site Topology of Aspergillus niger Endopolygalacturonase II as Studied by Site-Directed Mutagenesis. J. Biol. Chem. 275, 691–696. 10.1074/jbc.275.1.691 - DOI - PubMed
    1. Arnold K., Bordoli L., Kopp J., Schwede T. (2006). The SWISS-MODEL Workspace: a Web-Based Environment for Protein Structure Homology Modelling. Bioinformatics 22, 195–201. 10.1093/bioinformatics/bti770 - DOI - PubMed

LinkOut - more resources