. 2023 Jan 1;108(1):83-97.
doi: 10.3324/haematol.2021.279930.

The efficacy of combination treatment with elotuzumab and lenalidomide is dependent on crosstalk between natural killer cells, monocytes and myeloma cells

Affiliations

The efficacy of combination treatment with elotuzumab and lenalidomide is dependent on crosstalk between natural killer cells, monocytes and myeloma cells

Kelden Richardson et al. Haematologica. .

Abstract

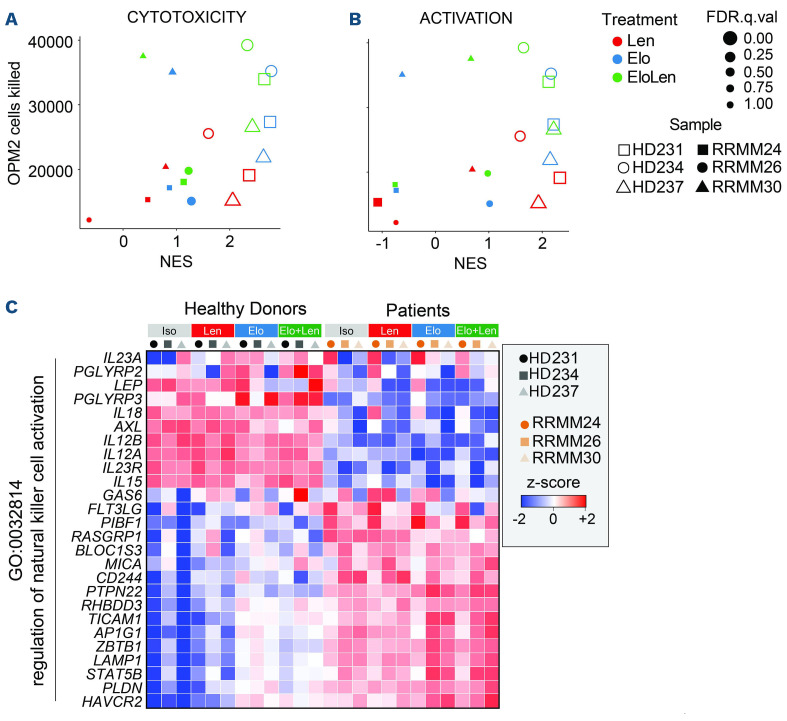
Patients with refractory relapsed multiple myeloma respond to combination treatment with elotuzumab and lenalidomide. The mechanisms underlying this observation are not fully understood. Furthermore, biomarkers predictive of response have not been identified to date. To address these issues, we used a humanized myeloma mouse model and adoptive transfer of human natural killer (NK) cells to show that elotuzumab and lenalidomide treatment controlled myeloma growth, and this was mediated through CD16 on NK cells. In co-culture studies, we showed that peripheral blood mononuclear cells from a subset of patients with refractory relapsed multiple myeloma were effective killers of OPM2 myeloma cells when treated with elotuzumab and lenalidomide, and this was associated with significantly increased expression of CD54 on OPM2 cells. Furthermore, elotuzumab- and lenalidomide-induced OPM2 cell killing and increased OPM2 CD54 expression were dependent on both monocytes and NK cells, and these effects were not mediated by soluble factors alone. At the transcript level, elotuzumab and lenalidomide treatment significantly increased OPM2 myeloma cell expression of genes for trafficking and adhesion molecules, NK cell activation ligands and antigen presentation molecules. In conclusion, our findings suggest that multiple myeloma patients require elotuzumab- and lenalidomide-mediated upregulation of CD54 on autologous myeloma cells, in combination with NK cells and monocytes to mediate an effective anti-tumor response. Furthermore, our data suggest that increased myeloma cell CD54 expression levels could be a powerful predictive biomarker for response to elotuzumab and lenalidomide treatment.


Figures

Figure 1.
Figure 1.
Combined treatment with elotuzumab and lenalidomide enhances natural killer-cell anti-myeloma activity in vivo.
Figure 2.
Figure 2.
Elotuzumab- and lenalidomide-induced anti-myeloma activity of peripheral blood mononuclear cells from healthy donors and myeloma patients. Peripheral blood mononuclear cells (PBMC) from healthy donors (HD, n=9), patients with newly diagnosed multiple myeloma (NDMM, n=12) or refractory relapsed multiple myeloma (RRMM, n=11) were co-cultured with CTV-labeled OPM2 cells at a 2:1 ratio for 24 hours in the presence of 10 µg/mL human IgG1 isotype control, 10 µM lenalidomide, 10 µg/mL elotuzumab or elotuzumab + lenalidomide. (A) Flow cytometry gating strategy identifying viable CTV-labeled OPM2 myeloma cells, natural killer (NK) cells and NK phenotype markers. (B) OPM2 cell killing data were compared within individual cohorts (HD, NDMM and RRMM) for different drug treatments across the 24-hour co-culture period. (repeated measure one-way analysis of variance [ANOVA]). (C) Flow cytometry analysis identified the number of OPM2 cells killed during the 24-hour period of co-culture. OPM2 killing data were compared between patient cohorts for individual drug treatments, and RRMM patients with high cytotoxicity are highlighted in red (two-way ANOVA, mean ± standard error of mean [SEM]). (D) HD, NDMM and RRMM patients’ NK cell CD16 expression changes in response to different drug treatments during the 24-hour co-culture (2-way ANOVA, mean ± SEM). (E, F) Supernatants from triplicate wells of PBMC and OPM2 co-cultures were taken at 24 hours for cytokine bead array analysis. The graphs show comparative changes between cohorts (HD, NDMM and RRMM patients) for (E) interferon gamma and (F) tumor necrosis factor secretion (two-way ANOVA, mean ± SEM). *P<0.05, **P<0.01, ***P<0.001, ****P<0.0001. FSC: forward scatter; SSC: side scatter; Iso: human IgG1 isotype control; Elo: elotuzumab; Len: lenalidomide: IFN: interferon; TNF: tumor necrosis factor.
Figure 3.
Figure 3.
Elotuzumab and lenalidomide treatment upregulated CD54 expression on natural killer cells. Peripheral blood mono-nuclear cells were co-cultured for 24 hours with OPM2 target cells (2:1), 10 µg/mL elotuzumab and 10 µM lenalidomide then analyzed by flow cytometry. (A) Representative overlay histograms show elotuzumab + lenalidomide-induced upregulation of CD54, CD69 and CD107a expression on natural killer (NK) cells from healthy donors (HD). (B-E) CD54, CD69 and CD107a expression was compared between NK cells from HD, patients with newly diagnosed multiple myelom (NDMM) and patients with refractory relapsed multiple myeloma (RRMM) in response to elotuzumab, lenalidomide or elotuzumab + lenalidomide treatment. Each data point represents the change in mean fluorescence intensity from baseline expression. Red triangles correspond to RRMM patients with high cytotoxic activity, as shown in Figure 2B. (B-D) Comparison between patients’ cohorts for NK cell CD54, CD69 and CD107a expression changes induced by drug treatments (two-way analysis of variance [ANOVA], mean ± standard error of mean [SEM]). (E) Comparison within each cohort for NK cell CD54, CD69 and CD107a expression changes induced by different drug treatment(s) (repeated measures one-way ANOVA, mean ± SEM). *P<0.05, **P<0.01, ***P<0.001, ****P<0.0001. MFI: mean fluorescence intensity; Iso: human IgG1 isotype control; Elo: elotuzumab; Len: lenalidomide.
Figure 4.
Figure 4.
Transcriptomic analysis of natural killer cells from patients with refractory relapsed multiple myeloma reveals that these cells respond differently to elotuzumab and lenalidomide combination treatment. (A) Schematic overview of the experimental RNA-sequencing strategy. Peripheral blood mononuclear cells (PBMC) from donors and patients (n=3 each group) were treated with lenalidomide, elotuzumab or their combination prior to fluorescence activated cell sorting of natural killer (NK) cells and whole-transcriptomic RNA sequencing. (B) OPM2 cell killing by PBMC from healthy donors and patients in the presence of isotype antibody, lenalidomide, elotuzumab, or elotuzumab + lenalidomide. (C) Principle component analysis of RNA expression in 24 samples of NK cells from healthy donors (circles: left panel) or patients with refractory relapsed multiple myeloma (triangles: right panel) following treatment. RRMM: refractory relapsed multiple myeloma; Iso: human IgG1 isotype control; Elo: elotuzumab; Len: lenalidomide; HD: healthy donor.
Figure 5.
Figure 5.
Natural killer cells from patients with refractory relapsed multiple myeloma have reduced gene signatures for cytotoxicity, activation and impaired regulation of activation. Scatterplots comparing in vitro killing capacity for individual natural killer (NK) cell sources with normalized enrichment scores for (A) KEGG Natural Killer Cell Mediated Cytotoxicity and (B) GO Regulation of Natural Killer Cell Activation. Colors indicate three treatment groups: lenalidomide, elotuzumab, and elotuzumab + lenalidomide. Size indicates false discovery rate q-value. All comparisons were made relative to isotype control treatment. Pearson correlation coefficients and P values are indicated. (C) Normalized z-score heatmap of GO:0032814: Regulation of NK cell activation pathway genes according to treatment for samples from both healthy donors and patients with refractory relapsed multiple myeloma. NES: normalized enrichment score; FDR: false discovery rate; Elo: elotuzumab; Len: lenalidomide; HD: healthy donor; RRMM: refractory relapsed multiple myeloma.
Figure 6.
Figure 6.
Elotuzumab and lenalidomide treatment upregulated CD54 on OPM2 cells and the treatment effects were dependent on both natural killer cells and monocytes. (A, B) Peripheral blood mononuclear cells (PBMC) and OPM2 cell co-cultures (2:1) were treated with elotuzumab and/or lenalidomide and analyzed via flow cytometry. Red data points indicate cells from refractory relapsed multiple myeloma (RRMM) patients with high cytotoxicity from Figure 2B. (A) Change in CD54 expression on OPM2 target cells when co-cultured with PBMC from healthy donors or RRMM patients, standardized to human IgG1 isotype control-treated cultures. (B) Pearson correlation between OPM2 CD54 expression change and RRMM cytotoxicity (R and P values are shown). (C, D) In the presence of elotuzumab and lenalidomide treatment OPM2 cells were co-cultured for 24 hours with either whole PBMC (PBMC:OPM2 2:1), PBMC depleted of CD14+ monocytes (PBMC CD14-) or NK cells (PBMC CD56-). The graphs show the number of OPM2 target cells killed (C), and the change in OPM2 target CD54 expression level (D). (E, F) OPM2 cells were co-cultured for 24 hours with either whole PBMC (PBMC:OPM2 2:1), isolated CD14+ cells (CD14), isolated NK cells (CD56) or CD14+ and NK cells (CD14+CD56). The graphs show the number of OPM2 target cells killed (E), and the change in OPM2 target CD54 expression level (F). Two-way analysis of variance, *P<0.05, **P<0.01, ***P<0.001, ****P<0.0001, n=3. MFI: mean fluorescence intensity; Iso: human IgG1 isotype control; Elo: elotuzumab; Len: lenalidomide.
Figure 7.
Figure 7.
Transcriptome analysis reveals that natural killer cells, monocytes and OPM2 myeloma cells change their gene expression differentially in response to drug treatments. (A) Schematic overview of the experimental RNA-sequencing strategy. Peripheral blood mononuclear cells from healthy donors (n=3) were treated with lenalidomide, elotuzumab or their combination prior to fluorescence activated sorting of natural killer cells (CD56+), monocytes (CD14+) and OPM2 cells and subsequent whole-transcriptomic RNA sequencing. (B) Dotplot of normalized ICAM-1 (CD54) expression in treatment groups in OPM2 cells and CD14+ monocytes. (C) Venn diagrams of overexpressed genes (log2 fold change >2; P value < 0.05) in each cell type and treatment group. PBMC: peripheral blood mononuclear cells; Control Ig and Iso: human IgG1 isotype control; Elo: elotuzumab; Len: lenalidomide, N.S.: not statistically significant; NK: natural killer.
Figure 8.
Figure 8.
Ontological analysis reveals increased expression of effector cell trafficking signals, adhesion and MHC class II molecules in tumor cells in response to elotuzumab and lenalidomide combination therapy. (A, B) Ontological enrichment analysis within the GO: Molecular Functions database using overexpressed genesets for either monocytes (A) or OPM2 cells (B). Only significantly enriched ontologies are shown (adjusted P value < 0.05). Genes contributing to each ontology are shown. No enrichments for lenalidomide treatment were identified. (C) Heatmaps showing normalized relative mRNA expression of transcripts encoding chemokines, cytokines and receptors important for natural killer-cell activation and functionality on monocytes (left panel) and OPM2 cells (right panel). Arrows indicate significance for the elotuzumab + lenalidomide and elotuzumab treatment groups with direction of change indicated. (D) OPM2 cell log2 mRNA expression of genes showing significantly different expression when treated with the elotuzumab + lenalidomide combination versus elotuzumab treatment alone. GO: gene ontology; Iso: human IgG1 isotype control; Elo: elotuzumab; Len: lenalidomide; MHC: major histocompatibility complex.

References

    1. Siegel RL, Miller KD, Jemal A. Cancer statistics, 2016. CA Cancer J Clin. 2016;66(1):7-30. - PubMed
    1. Varga C, Maglio M, Ghobrial IM, Richardson PG. Current use of monoclonal antibodies in the treatment of multiple myeloma. Br J Haematol. 2018;181(4):447-459. - PubMed
    1. Hsi ED, Steinle R, Balasa B, et al. CS1, a potential new therapeutic antibody target for the treatment of multiple myeloma. Clin Cancer Res. 2008;14(9):2775-2784. - PMC - PubMed
    1. Tai Y-T, Dillon M, Song W, et al. Anti-CS1 humanized monoclonal antibody HuLuc63 inhibits myeloma cell adhesion and induces antibody-dependent cellular cytotoxicity in the bone marrow milieu. Blood. 2008;112(4):1329-1337. - PMC - PubMed
    1. Perez-Quintero LA, Roncagalli R, Guo H, Latour S, Davidson D, Veillette A. EAT-2, a SAP-like adaptor, controls NK cell activation through phospholipase Cgamma, Ca++, and Erk, leading to granule polarization. J Exp Med. 2014;211(4):727-742. - PMC - PubMed

Publication types

MeSH terms