

Apolipoprotein B, Residual Cardiovascular Risk After Acute Coronary Syndrome, and Effects of Alirocumab
- PMID: 35770629
- PMCID: PMC9422774
- DOI: 10.1161/CIRCULATIONAHA.121.057807
Apolipoprotein B, Residual Cardiovascular Risk After Acute Coronary Syndrome, and Effects of Alirocumab
Abstract
Background: Apolipoprotein B (apoB) provides an integrated measure of atherogenic risk. Whether apoB levels and apoB lowering hold incremental predictive information on residual risk after acute coronary syndrome beyond that provided by low-density lipoprotein cholesterol is uncertain.
Methods: The ODYSSEY OUTCOMES trial (Evaluation of Cardiovascular Outcomes After an Acute Coronary Syndrome During Treatment With Alirocumab) compared the proprotein convertase subtilisin/kexin type 9 inhibitor alirocumab with placebo in 18 924 patients with recent acute coronary syndrome and elevated atherogenic lipoproteins despite optimized statin therapy. Primary outcome was major adverse cardiovascular events (MACE; coronary heart disease death, nonfatal myocardial infarction, fatal/nonfatal ischemic stroke, hospitalization for unstable angina). Associations between baseline apoB or apoB at 4 months and MACE were assessed in adjusted Cox proportional hazards and propensity score-matched models.
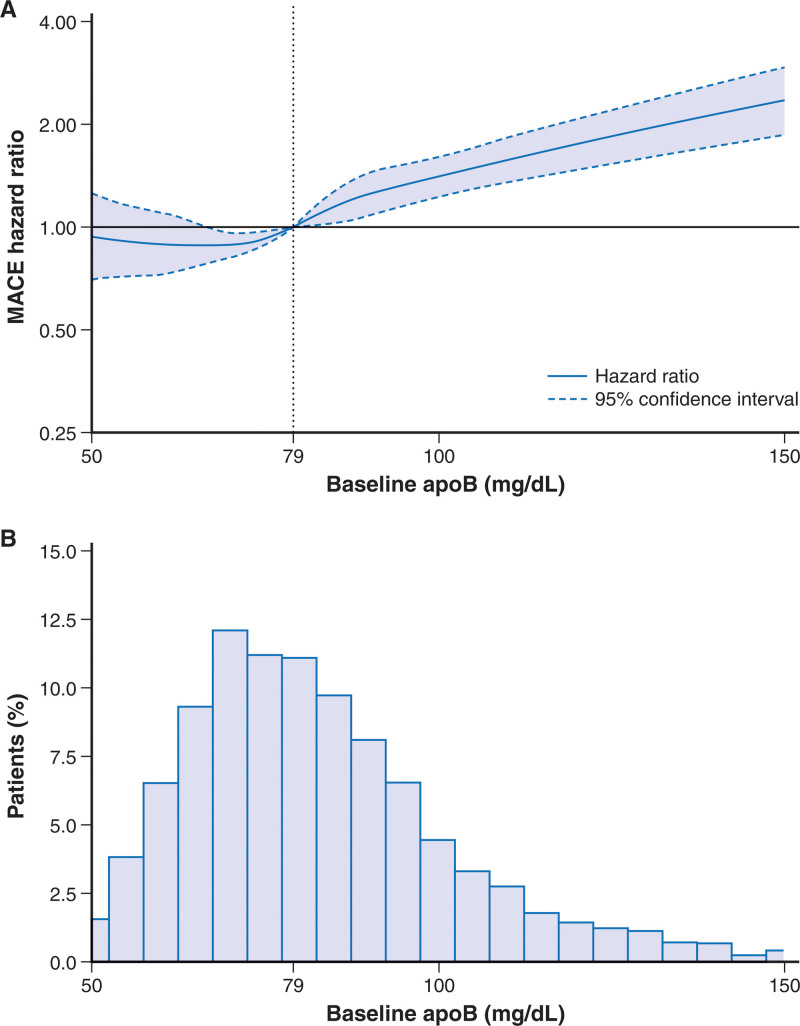
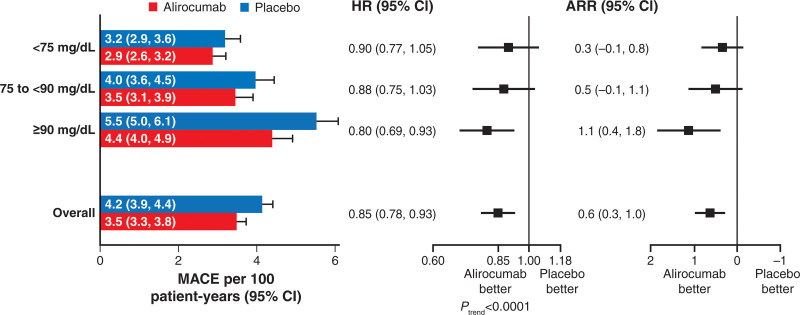
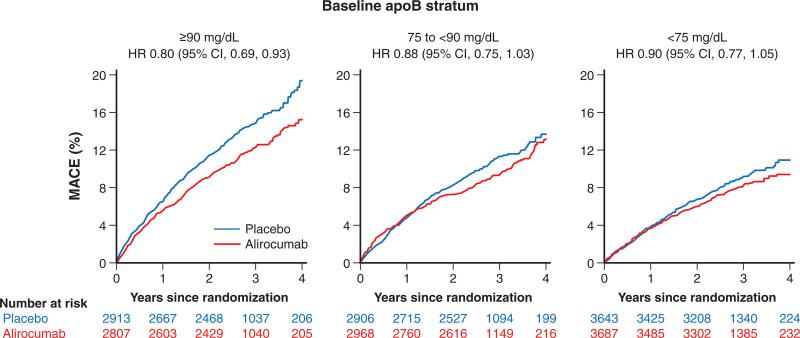
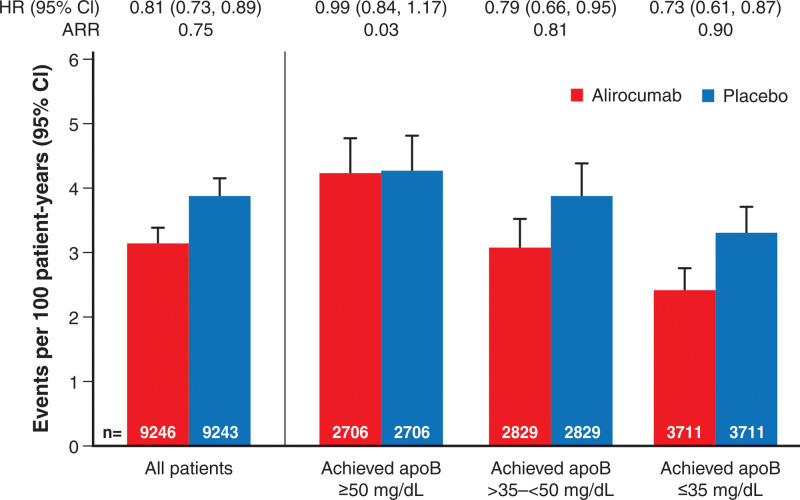
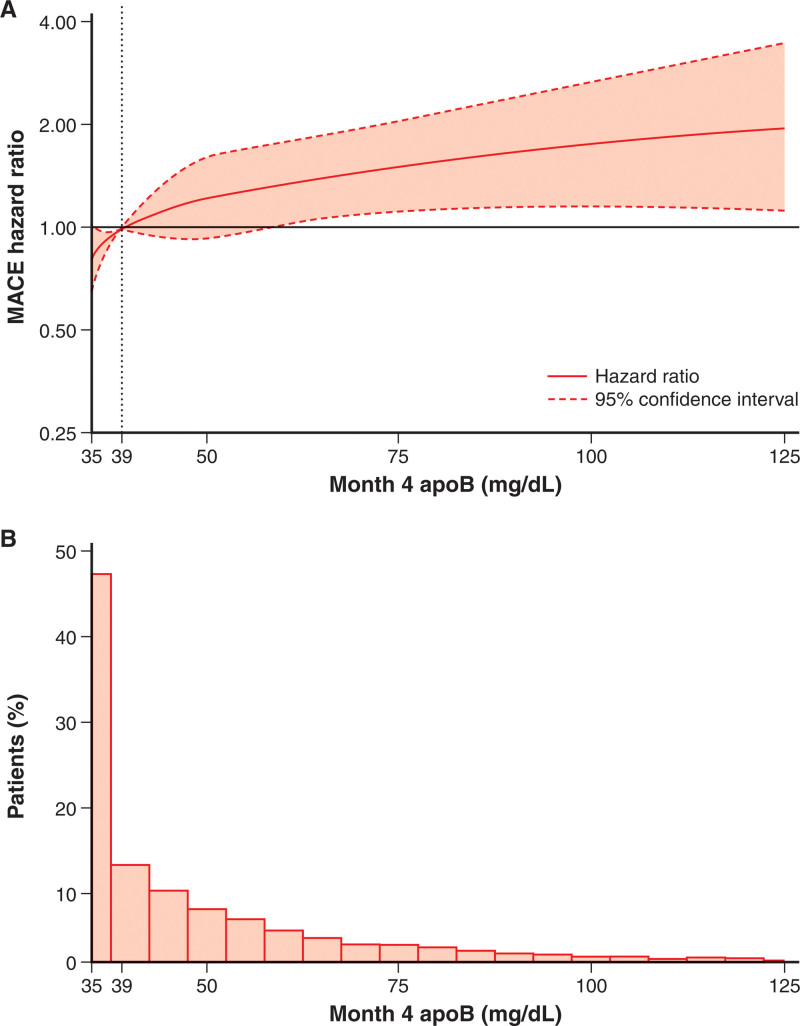
Results: Median follow-up was 2.8 years. In proportional hazards analysis in the placebo group, MACE incidence increased across increasing baseline apoB strata (3.2 [95% CI, 2.9-3.6], 4.0 [95% CI, 3.6-4.5], and 5.5 [95% CI, 5.0-6.1] events per 100 patient-years in strata <75, 75-<90, ≥90 mg/dL, respectively; Ptrend<0.0001) and after adjustment for low-density lipoprotein cholesterol (Ptrend=0.035). Higher baseline apoB stratum was associated with greater relative (Ptrend<0.0001) and absolute reduction in MACE with alirocumab versus placebo. In the alirocumab group, the incidence of MACE after month 4 decreased monotonically across decreasing achieved apoB strata (4.26 [95% CI, 3.78-4.79], 3.09 [95% CI, 2.69-3.54], and 2.41 [95% CI, 2.11-2.76] events per 100 patient-years in strata ≥50, >35-<50, and ≤35 mg/dL, respectively). Compared with propensity score-matched patients from the placebo group, treatment hazard ratios for alirocumab also decreased monotonically across achieved apoB strata. Achieved apoB was predictive of MACE after adjustment for achieved low-density lipoprotein cholesterol or non-high-density lipoprotein cholesterol but not vice versa.
Conclusions: In patients with recent acute coronary syndrome and elevated atherogenic lipoproteins, MACE increased across baseline apoB strata. Alirocumab reduced MACE across all strata of baseline apoB, with larger absolute reductions in patients with higher baseline levels. Lower achieved apoB was associated with lower risk of MACE, even after accounting for achieved low-density lipoprotein cholesterol or non-high-density lipoprotein cholesterol, indicating that apoB provides incremental information. Achievement of apoB levels as low as ≤35 mg/dL may reduce lipoprotein-attributable residual risk after acute coronary syndrome.
Registration: URL: https://www.
Clinicaltrials: gov; Unique identifier: NCT01663402.
Keywords: PCSK9 inhibitors; acute coronary syndrome; apolipoproteins B; cholesterol, LDL; heart disease risk factors.
Figures
Comment in
-
The Lower the ApoB, the Better: Now, How Does ApoB Fit in the Upcoming Era of Targeted Therapeutics?Circulation. 2022 Aug 30;146(9):673-675. doi: 10.1161/CIRCULATIONAHA.122.061188. Epub 2022 Aug 29. Circulation. 2022. PMID: 36037269 No abstract available.
References
-
- Borén J, Williams KJ. The central role of arterial retention of cholesterol-rich apolipoprotein-B-containing lipoproteins in the pathogenesis of atherosclerosis: a triumph of simplicity. Curr Opin Lipidol. 2016;27:473–483. doi: 10.1097/MOL.0000000000000330 - PubMed
-
- Sniderman AD, Williams K, Contois JH, Monroe HM, McQueen MJ, de Graaf J, Furberg CD. A meta-analysis of low-density lipoprotein cholesterol, non-high-density lipoprotein cholesterol, and apolipoprotein B as markers of cardiovascular risk. Circ Cardiovasc Qual Outcomes. 2011;4:337–345. doi: 10.1161/CIRCOUTCOMES.110.959247 - PubMed
-
- Johannesen CDL, Mortensen MB, Langsted A, Nordestgaard BG. Apolipoprotein B and non-HDL cholesterol better reflect residual risk than LDL cholesterol in statin-treated patients. J Am Coll Cardiol. 2021;77:1439–1450. doi: 10.1016/j.jacc.2021.01.027 - PubMed
