. 2022 Sep;18(36):e2202303.
doi: 10.1002/smll.202202303. Epub 2022 Jun 30.

Polysaccharide-Polyplex Nanofilm Coatings Enhance Nanoneedle-Based Gene Delivery and Transfection Efficiency

Affiliations

Polysaccharide-Polyplex Nanofilm Coatings Enhance Nanoneedle-Based Gene Delivery and Transfection Efficiency

Daniel Hachim et al. Small. 2022 Sep.

Abstract

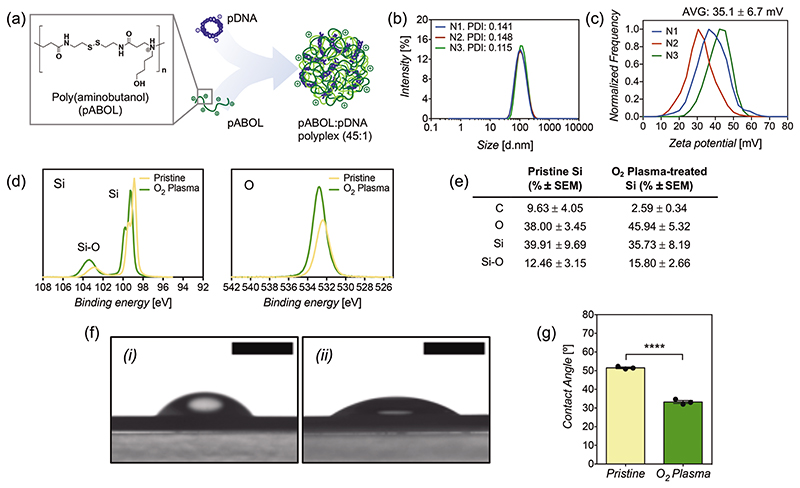
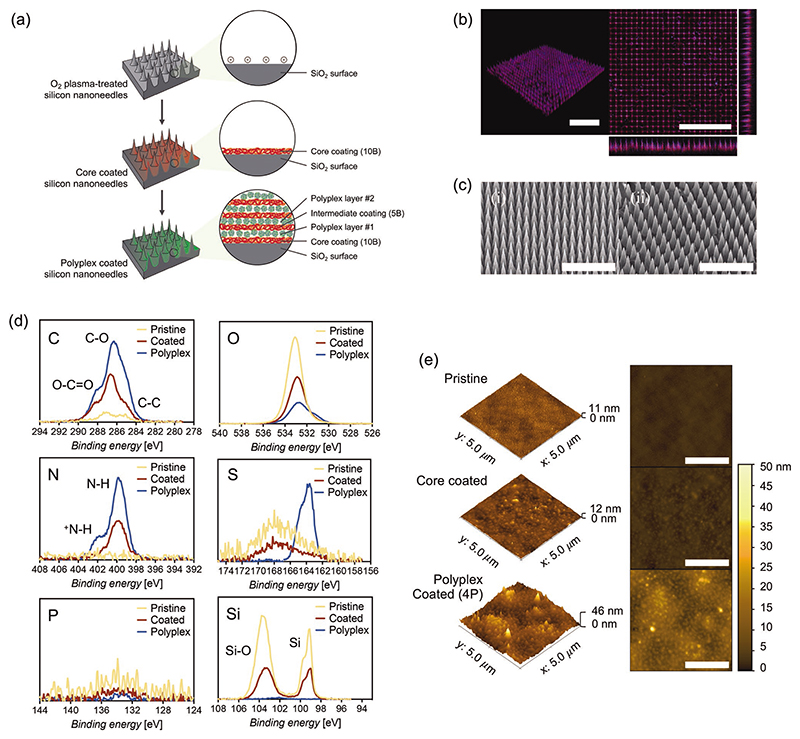
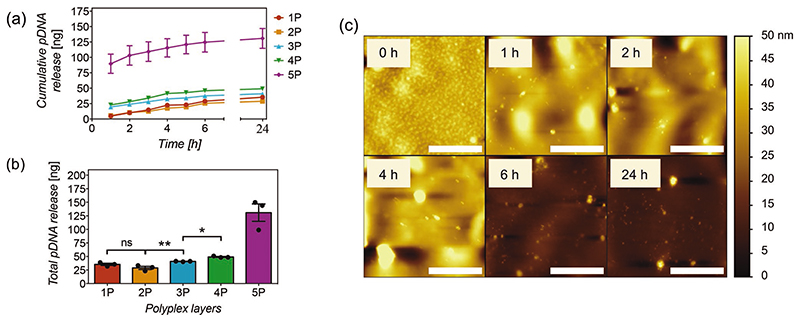
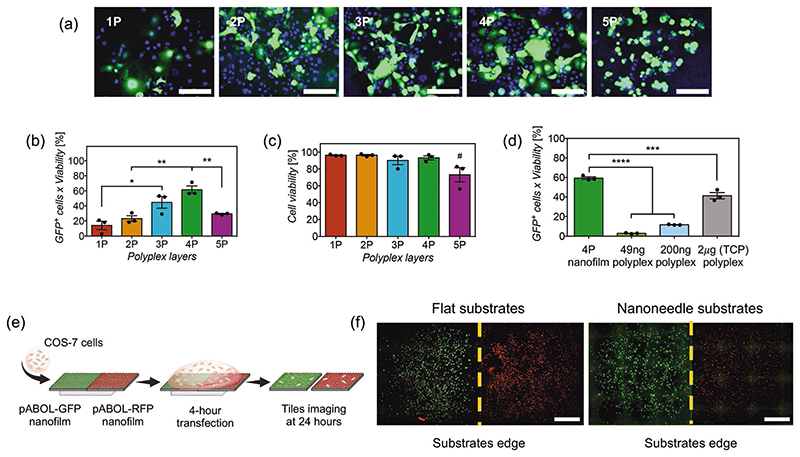
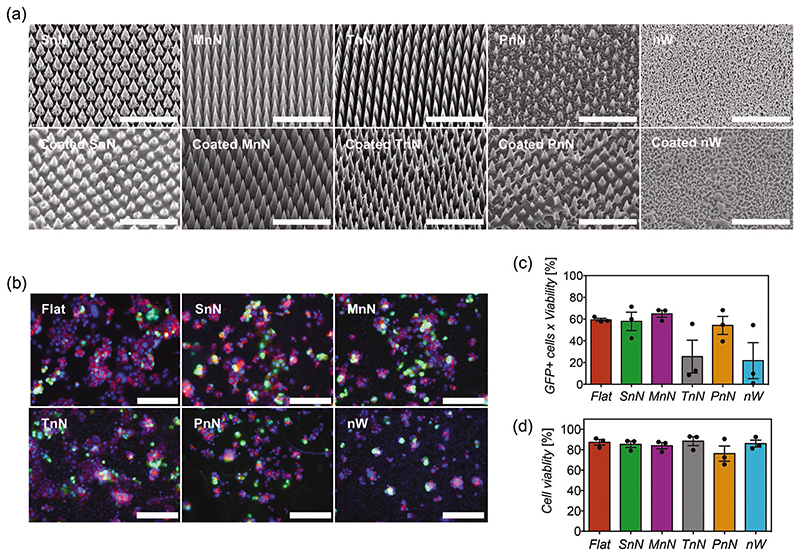
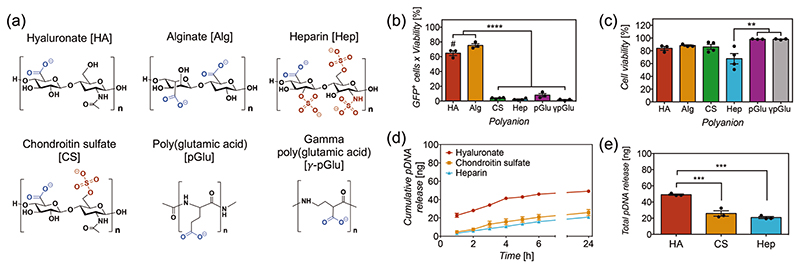
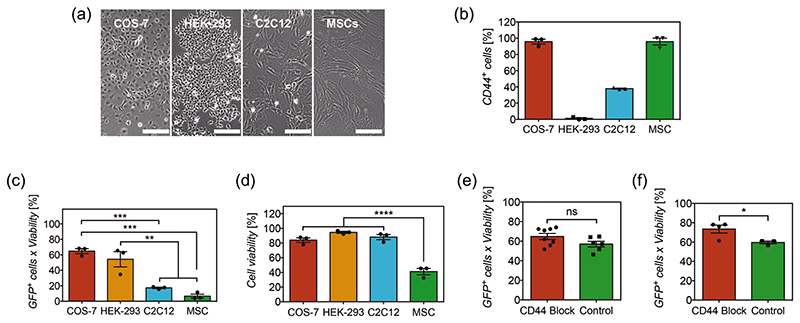
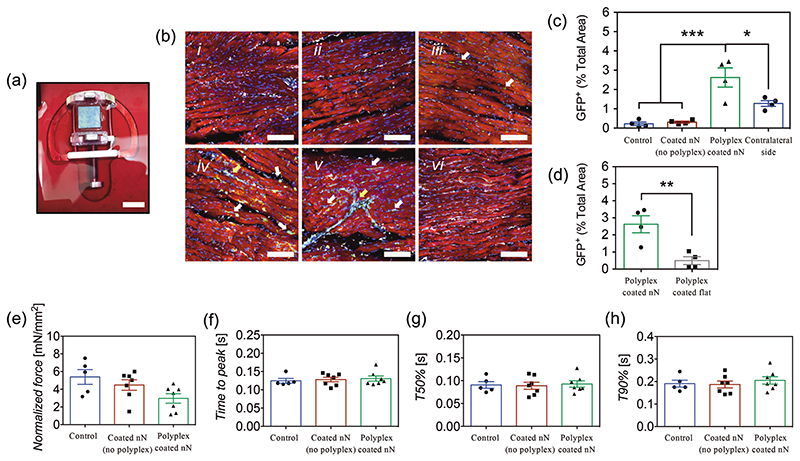
Non-viral vectors represent versatile and immunologically safer alternatives for nucleic acid delivery. Nanoneedles and high-aspect ratio nanostructures are unconventional but interesting delivery systems, in which delivery is mediated by surface interactions. Herein, nanoneedles are synergistically combined with polysaccharide-polyplex nanofilms and enhanced transfection efficiency is observed, compared to polyplexes in suspension. Different polyplex-polyelectrolyte nanofilm combinations are assessed and it is found that transfection efficiency is enhanced when using polysaccharide-based polyanions, rather than being only specific for hyaluronic acid, as suggested in earlier studies. Moreover, results show that enhanced transfection is not mediated by interactions with the CD44 receptor, previously hypothesized as a major mechanism mediating enhancement via hyaluronate. In cardiac tissue, nanoneedles are shown to increase the transfection efficiency of nanofilms compared to flat substrates; while in vitro, high transfection efficiencies are observed in nanostructures where cells present large interfacing areas with the substrate. The results of this study demonstrate that surface-mediated transfection using this system is efficient and safe, requiring amounts of nucleic acid with an order of magnitude lower than standard culture transfection. These findings expand the spectrum of possible polyelectrolyte combinations that can be used for the development of suitable non-viral vectors for exploration in further clinical trials.

Keywords: gene delivery; nanofilms; nanoneedles; polyplexes; transfection.


Conflict of interest statement

Conflict of Interest

The authors declare no conflict of interest.

Figures

Figure 1
Figure 1
a) Schematics of polyplex formation between pDNA and pABOL in a mass ratio of 1:45. b) Particle diameter of polyplexes via dynamic light scattering (DLS) and c) zeta potential of polyplexes. Three samples shown (N = 3) correspond to the mean of three measurements. d) Silicon and oxygen spectra using X-ray photoelectron spectroscopy (XPS) on the surface of pristine silicon nanoneedles and O2 plasma-treated silicon nanoneedles. e) XPS surface composition of pristine silicon and O2 plasma-treated silicon nanoneedles. Results are the mean of three samples (N = 3) ± SEM. f) Representative images of contact angle measurements on i) pristine silicon nanoneedles and ii) O2 plasma-treated silicon nanoneedles. Scale bars represent 2 mm. g) Contact angle values as the mean of three replicates (N = 3) ± SEM. Statistical significance difference as (****) p < 0.0001, using a two-tailed t-test.
Figure 2
Figure 2
a) Polysaccharide-polyplex nanofilm coating procedure of silicon nanoneedles and high-aspect ratio nanostructures. b) Confocal microscopy representative image of silicon nanoneedles coated with hyaluronate-chitosan-pDNA polyplex nanofilms. The nanofilm was stained with TAMRA (red) and pDNA-polyplexes were stained with DAPI (blue). Scale bars represent 20 μm. Separate images for each channel can be found in Figure S1, Supporting Information. c) Scanning electron microscopy (SEM) images of i) pristine nanoneedles and ii) polyplex-nanofilm coated nanoneedles. Scale bars represent 10 μm. d) Carbon, oxygen, nitrogen, sulfur, phosphorus, and silicon spectra obtained via XPS from pristine, coated (no polyplex) and polyplex-coated (4 layers) nanoneedles. e) Surface topography characterization via atomic force microscopy (AFM) for pristine, coated (no polyplex) and polyplex coated (4 layers) flat silicon substrates. Scale bars represent 2 μm.
Figure 3
Figure 3
a) Cumulative release of pCAG-GFP plasmid DNA (nanograms) versus time (hours) and b) total amount of pCAG-GFP released at 24 h from 8 × 8 mm silicon substrates coated with hyaluronate-chitosan nanofilms containing 1 to 5 layers of polyplexes (1P to 5P) in PBS buffer pH 7.4 containing 10 mM of reduced glutathione at 37 °C. Points and bars represent the mean of three replicates (N = 3) ± SEM. Statistical significance as (*) p < 0.05 and (**) p < 0.01, using one-way ANOVA with Sidak’s test to compare 1P to 4P. (ns) non-significant difference. 5P was not considered in the analysis. Linear trend post-test with p < 0.0001. c) Nanofilm degradation over time (hours) in function of surface topography via AFM assessments. Scale bars represent 2 μm.
Figure 4
Figure 4
a) Fluorescent microscopy images of COS-7 cells transfected and expressing pCAG-GFP plasmid (green) using silicon substrates coated with nanofilms containing 1 to 5 polyplex layers (1P to 5P). DAPI (blue) was used as a nuclear counterstain. Scale bars represent 100 μm. b) Quantification of transfection efficiency and c) viability via flow cytometry analyses of COS-7 cells transfected via silicon substrates coated with nanofilms containing 1 to 5 polyplex layers (1P to 5P) after 24 h incubation. Bars represent the mean ± SEM (N = 3). Statistical significance as (*) p < 0.05 and (**) p <0.01, using one-way ANOVA and Sidak’s test. (#) statistical significance with p < 0.05, using one-way ANOVA with Sidak’s test to compare 5P to all other groups. (ns) non-significant difference. d) Transfection efficiency of COS-7 cells seeded on silicon substrates coated with 4-polyplex layers versus polyplexes in suspension containing 49 and 200 ng of pDNA on top of silicon substrates; and a standard culture transfection of polyplexes using 2 μg of pCAG-GFP in TCP. Bars represent the mean ± SEM (N = 3). Statistical significance as (****) p < 0.0001, using one-way ANOVA and Sidak’s test. e) Schematics of the procedure to assess surface-mediated transfection using two contiguous silicon substrates on COS-7 cells, one containing pCAG-GFP (green, left) and the other pCAG-RFP (red, right). f) Tiled and stitched fluorescent microscopy images from the whole surface of two contiguous flat and nanoneedle substrates, expressing GFP (green) or RFP (red). Scale bars represent 2 mm.
Figure 5
Figure 5
a) SEM images of pristine high-aspect ratio nanostructures (top) and nanostructures coated with 4-polyplex nanofilms (bottom). SnN, MnN, TnN, and PnN correspond to small, medium, tall, and porous nanoneedles, respectively. nW corresponds to nanowires. Scale bars represent 10μm. b) Fluorescent microscopy images of COS-7 cells transfected on distinct high-aspect ratio nanostructures coated with 4-polyplex nanofilms. GFP+ cells are shown in green, while the cytoskeleton of cells has been stained with phalloidin (red) and cell nuclei counterstained with DAPI (blue). Scale bars represent 100 μm. c) Quantification of transfection efficiency and d) viability via flow cytometry analyses of COS-7 cells transfected with different coated high-aspect ratio nanostructures. Bars represent the mean ± SEM (N = 3). Statistical significance was found using one-way ANOVA (p < 0.05), but significances between specific means were not found with Sidak’s post-test.
Figure 6
Figure 6
a) Chemical structures of the polyanions assessed in the study, with their anionic groups highlighted in a different color. b) Transfection efficiency and c) viability of COS-7 cells transfected using nanoneedles with polyplex nanofilms containing distinct polyanions. Bars represent the mean ± SEM (N = 3–4). Statistical significance as (**) p < 0.01 and (****) p < 0.0001, using one-way ANOVA and Sidak’s test. (#) p < 0.05 compared to alginate. d) Cumulative release of pCAG-GFP plasmid DNA (nanograms) versus time (hours) and e) total amount of pCAG-GFP released at 24 h, from silicon substrates coated with 4-polyplex nanofilms containing hyaluronate (HA), chondroitin sulfate (CS) and heparin (Hep); in PBS buffer pH 7.4 containing 10 mM of reduced glutathione at 37 °C. Points and bars represent the mean of three replicates (N = 3) ± SEM. Statistical significance as (***) p < 0.001, using one-way ANOVA and Sidak’s test.
Figure 7
Figure 7
a) Images of cell types studied and b) their level of CD44 expression receptor. Scale bars represent 200 μm. Bars represent the mean ± SEM (N = 3). c) Transfection efficiency and d) viability of distinct cell types transfected with nanoneedles coated with 4-polyplex nanofilms. Bars represent the mean ± SEM (N = 3). Statistical significance as (**) p < 0.01, (***) p < 0.001 and (****) p < 0.0001, using one-way ANOVA and Sidak’s test. e) Transfection efficiency of COS-7 cells before and after blocking of receptor CD44, using hyaluronate-chitosan-polyplex coated nanoneedles and f) alginate-chitosan-polyplex coated nanoneedles. Bars represent the mean ± SEM (N = 3–8). Statistical significance as (*) p < 0.05, using a two-tailed t-test. (ns) non-statistical difference.
Figure 8
Figure 8
a) Polyplex-coated nanoneedle substrate interfacing cardiac slice on custom-made holders. Scale bar represents 8 mm. b) Confocal microscopy images of cardiac slices at 24 h of transfection and immunolabeled with anti-GFP (green), anti-cTNT (red), anti-vimentin (white), and DAPI (blue). Representative images correspond to i) control no chip, ii) coated (no polyplex) nanoneedles, iii) polyplex-coated flat substrates, iv,v) polyplex-coated nanoneedles, and vi) the non-interfacing side of a slice with polyplex-coated nanoneedles. Bars represent 100 μm. Separate images showing green and blue channels are shown in Figure S7, Supporting Information. The level of GFP expression in these groups was quantified via image analysis, c) as percentage of total area, d) while a comparison between GFP expression on nanoneedles and flat substrates coated with 4P-polyplex nanofilms was performed separately. Bars represent the mean ± SEM (N = 4). Statistical significance as (*) p < 0.05, (**) p < 0.01 and (***) p < 0.001, using two-tailed t-tests to compare two groups or one-way ANOVA with Sidak’s test for multiple groups. Traces from force transducer analyses showing e) contraction force in mN mm−2, f) time to peak, g) time to 50% decay, and h) time to 90% decay. Bars represent the mean ± SEM (N = 5–7). Differences were not statistically significant: e) p = 0.052, f) p = 0.837, g) p = 0.930, and h) p = 0.684, using one-way ANOVA (p < 0.05).

References

    1. Ma CC, Wang ZL, Xu T, He ZY, Wei YQ. Biotechnol Adv. 2020;40:107502. - PubMed
    1. Sung YK, Kim SW. Biomater Res. 2019;23:8. - PMC - PubMed
    1. Nayerossadat N, Maedeh T, Ali PA. Adv Biomed Res. 2012;1:27. - PMC - PubMed
    1. Neshat SY, Tzeng SY, Green JJ. Curr Opin Biotechnol. 2020;66:1. - PMC - PubMed
    1. Chen CK, Huang PK, Law WC, Chu CH, Chen NTL, Lo W. Int J Nanomed. 2020;15:2131. - PMC - PubMed

Publication types

LinkOut - more resources