

Mineral Crystal Thickness in Calcified Cartilage and Subchondral Bone in Healthy and Osteoarthritic Human Knees
- PMID: 35770824
- PMCID: PMC9540032
- DOI: 10.1002/jbmr.4642
Mineral Crystal Thickness in Calcified Cartilage and Subchondral Bone in Healthy and Osteoarthritic Human Knees
Abstract
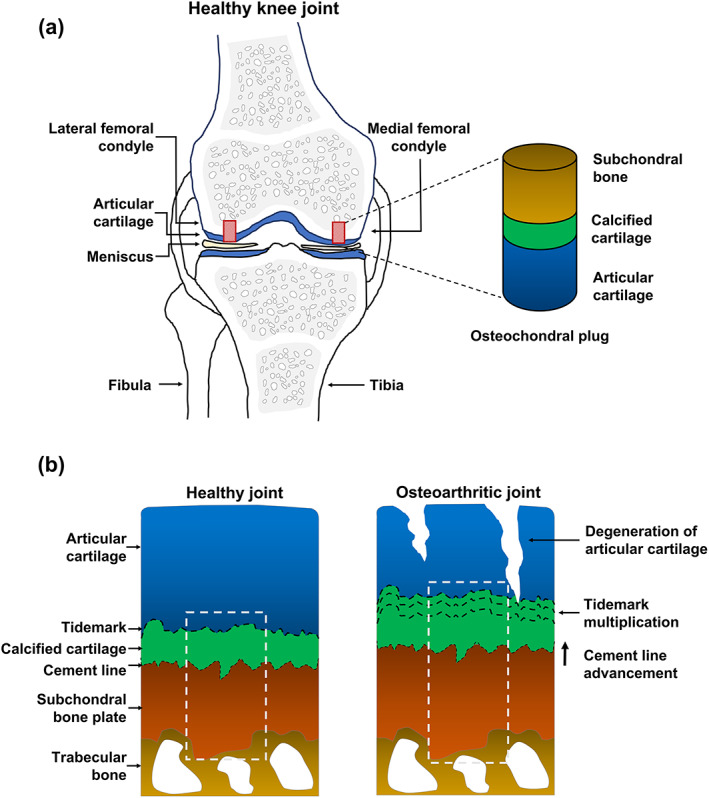
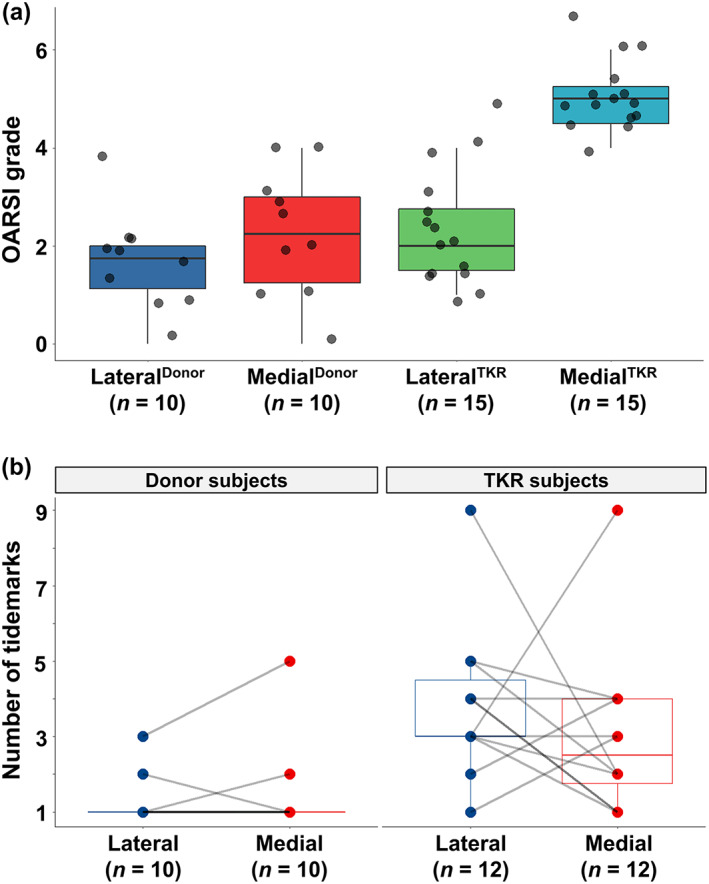
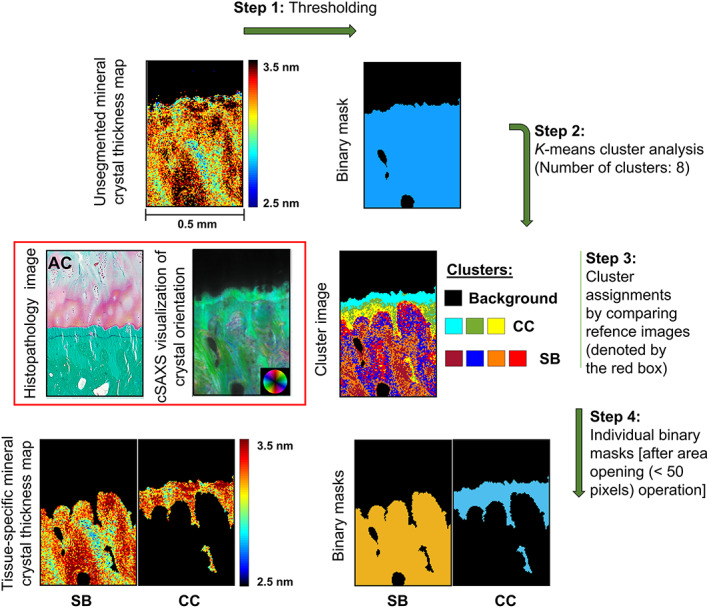
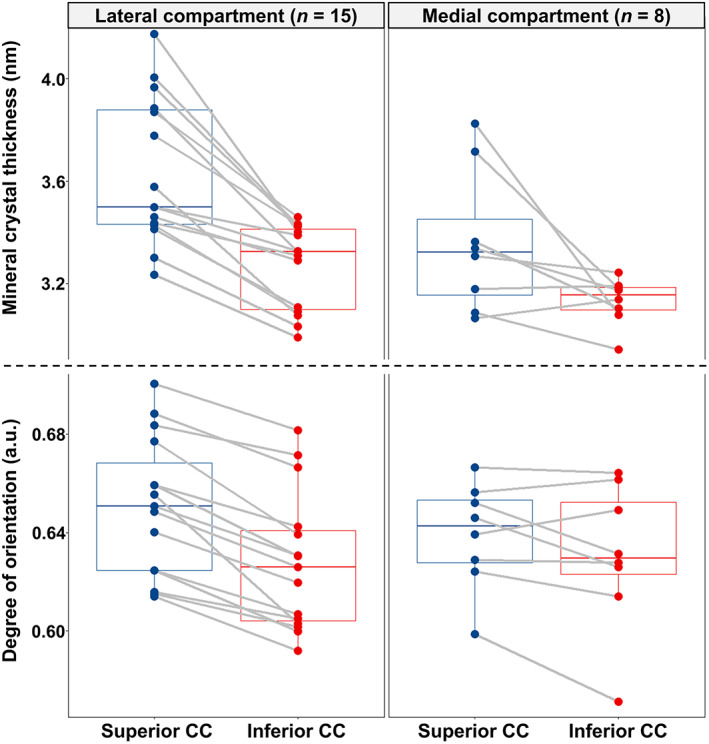
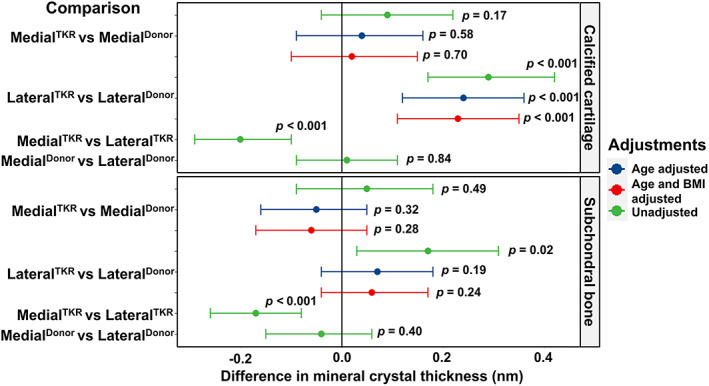
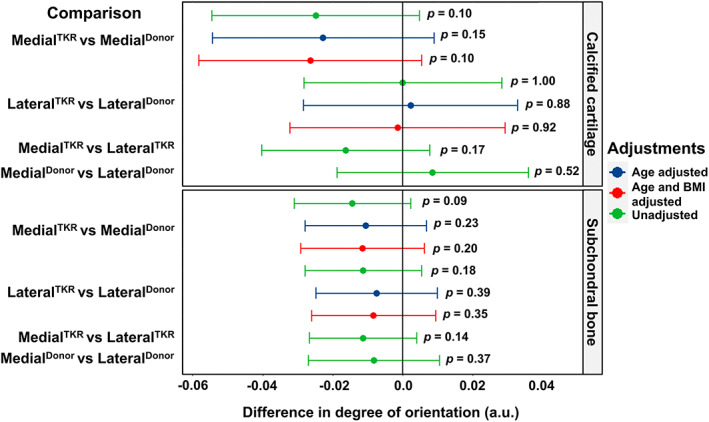
Osteoarthritis (OA) is the most common joint disease, where articular cartilage degradation is often accompanied with sclerosis of the subchondral bone. However, the association between OA and tissue mineralization at the nanostructural level is currently not understood. In particular, it is technically challenging to study calcified cartilage, where relevant but poorly understood pathological processes such as tidemark multiplication and advancement occur. Here, we used state-of-the-art microfocus small-angle X-ray scattering with a 5-μm spatial resolution to determine the size and organization of the mineral crystals at the nanostructural level in human subchondral bone and calcified cartilage. Specimens with a wide spectrum of OA severities were acquired from both medial and lateral compartments of medial compartment knee OA patients (n = 15) and cadaver knees (n = 10). Opposing the common notion, we found that calcified cartilage has thicker and more mutually aligned mineral crystals than adjoining bone. In addition, we, for the first time, identified a well-defined layer of calcified cartilage associated with pathological tidemark multiplication, containing 0.32 nm thicker crystals compared to the rest of calcified cartilage. Finally, we found 0.2 nm thicker mineral crystals in both tissues of the lateral compartment in OA compared with healthy knees, indicating a loading-related disease process because the lateral compartment is typically less loaded in medial compartment knee OA. In summary, we report novel changes in mineral crystal thickness during OA. Our data suggest that unloading in the knee might be involved with the growth of mineral crystals, which is especially evident in the calcified cartilage. © 2022 The Authors. Journal of Bone and Mineral Research published by Wiley Periodicals LLC on behalf of American Society for Bone and Mineral Research (ASBMR).
Keywords: ANALYSIS/QUANTITATION OF BONE; BONE MODELING AND REMODELING; COLLAGEN; MATRIX MINERALIZATION; OSTEOARTHRITIS.
© 2022 The Authors. Journal of Bone and Mineral Research published by Wiley Periodicals LLC on behalf of American Society for Bone and Mineral Research (ASBMR).
Figures
Similar articles
-
[Histomorphometric analysis of articular cartilage and subchondral bone from primary osteoarthritic knees].Zhongguo Xiu Fu Chong Jian Wai Ke Za Zhi. 2011 Dec;25(12):1434-9. Zhongguo Xiu Fu Chong Jian Wai Ke Za Zhi. 2011. PMID: 22242340 Chinese.
-
Mechanical and structural properties of articular cartilage and subchondral bone in human osteoarthritic knees.J Bone Miner Res. 2024 Aug 21;39(8):1120-1131. doi: 10.1093/jbmr/zjae094. J Bone Miner Res. 2024. PMID: 38887013 Free PMC article.
-
Modeling knee osteoarthritis pathophysiology using an integrated joint system (IJS): a systematic review of relationships among cartilage thickness, gait mechanics, and subchondral bone mineral density.Osteoarthritis Cartilage. 2018 Nov;26(11):1425-1437. doi: 10.1016/j.joca.2018.06.017. Epub 2018 Jul 26. Osteoarthritis Cartilage. 2018. PMID: 30056214
-
Increased hydraulic conductance of human articular cartilage and subchondral bone plate with progression of osteoarthritis.Arthritis Rheum. 2008 Dec;58(12):3831-42. doi: 10.1002/art.24069. Arthritis Rheum. 2008. PMID: 19035476 Free PMC article.
-
Bone density and local growth factors in generalized osteoarthritis.Microsc Res Tech. 1997 May 15;37(4):358-71. doi: 10.1002/(SICI)1097-0029(19970515)37:4<358::AID-JEMT10>3.0.CO;2-L. Microsc Res Tech. 1997. PMID: 9185157 Review.
Cited by
-
New role of calcium-binding fluorescent dye alizarin complexone in detecting permeability from articular cartilage to subchondral bone.FASEB Bioadv. 2024 Oct 7;6(11):539-554. doi: 10.1096/fba.2024-00103. eCollection 2024 Nov. FASEB Bioadv. 2024. PMID: 39512844 Free PMC article.
-
Roles of the calcified cartilage layer and its tissue engineering reconstruction in osteoarthritis treatment.Front Bioeng Biotechnol. 2022 Aug 31;10:911281. doi: 10.3389/fbioe.2022.911281. eCollection 2022. Front Bioeng Biotechnol. 2022. PMID: 36131726 Free PMC article. Review.
-
Early Degenerative Changes in a Spontaneous Osteoarthritis Model Assessed by Nanoindentation.Bioengineering (Basel). 2023 Aug 23;10(9):995. doi: 10.3390/bioengineering10090995. Bioengineering (Basel). 2023. PMID: 37760097 Free PMC article.
-
Recent Advances in Hydrogel Technology in Delivering Mesenchymal Stem Cell for Osteoarthritis Therapy.Biomolecules. 2024 Jul 17;14(7):858. doi: 10.3390/biom14070858. Biomolecules. 2024. PMID: 39062572 Free PMC article. Review.
-
Nonlinear Stress-Induced Transformations in Collagen Fibrillar Organization, Disorder and Strain Mechanisms in the Bone-Cartilage Unit.Adv Sci (Weinh). 2025 Jan;12(1):e2407649. doi: 10.1002/advs.202407649. Epub 2024 Nov 11. Adv Sci (Weinh). 2025. PMID: 39527673 Free PMC article.
References
-
- Lai WM, Hou JS, Mow VC. A triphasic theory for the swelling and deformation behaviors of articular cartilage. J Biomech Eng. 1991;113(3):245‐258. - PubMed
-
- Benninghoff A. Shape and composition of articular cartilage with regard to its function. II. Composition of articular cartilage with regard to its function [Form und Bau der Gelenkknorpel in ihren Beziehungen zur Funktion]. Zeitschrift fur Zellforschung und Mikroskopische Anatomie. 1925;2:783‐862.
Publication types
MeSH terms
Substances
Grants and funding
LinkOut - more resources
Full Text Sources
Medical
Research Materials
