

Genome-wide association and multi-omics studies identify MGMT as a novel risk gene for Alzheimer's disease among women
- PMID: 35770850
- PMCID: PMC9800643
- DOI: 10.1002/alz.12719
Genome-wide association and multi-omics studies identify MGMT as a novel risk gene for Alzheimer's disease among women
Abstract
Introduction: Variants in the tau gene (MAPT) region are associated with breast cancer in women and Alzheimer's disease (AD) among persons lacking apolipoprotein E ε4 (ε4-).
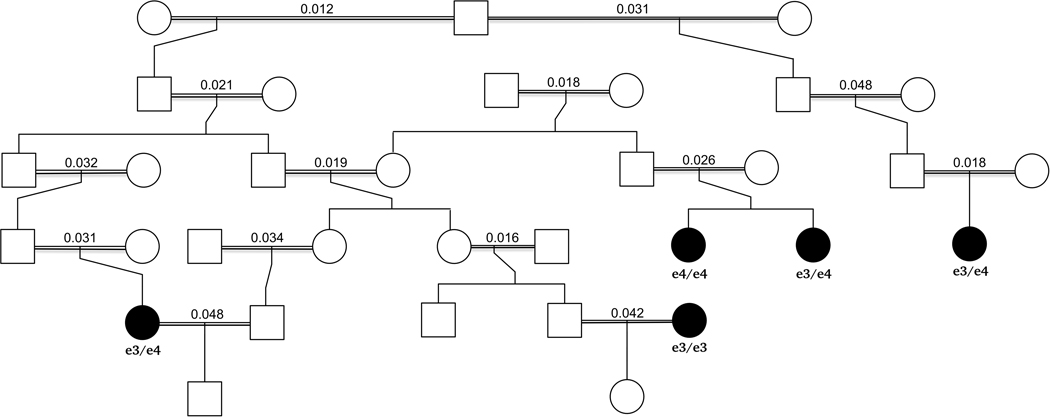
Methods: To identify novel genes associated with tau-related pathology, we conducted two genome-wide association studies (GWAS) for AD, one among 10,340 ε4- women in the Alzheimer's Disease Genetics Consortium (ADGC) and another in 31 members (22 women) of a consanguineous Hutterite kindred.
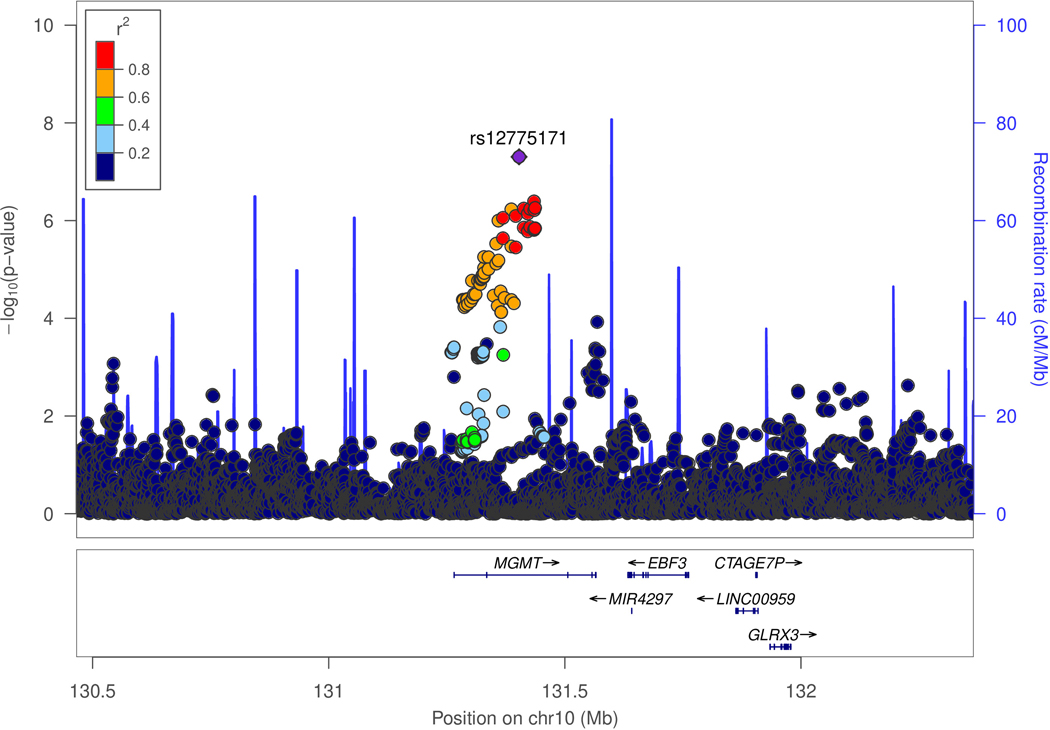
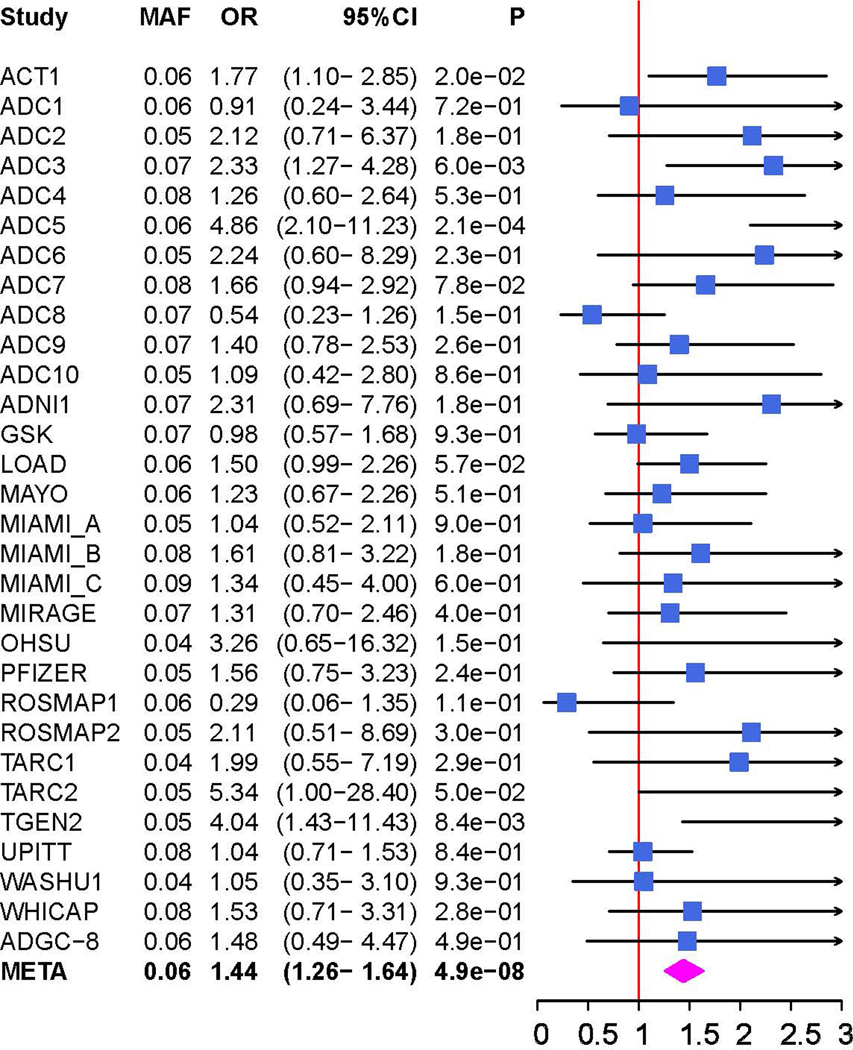
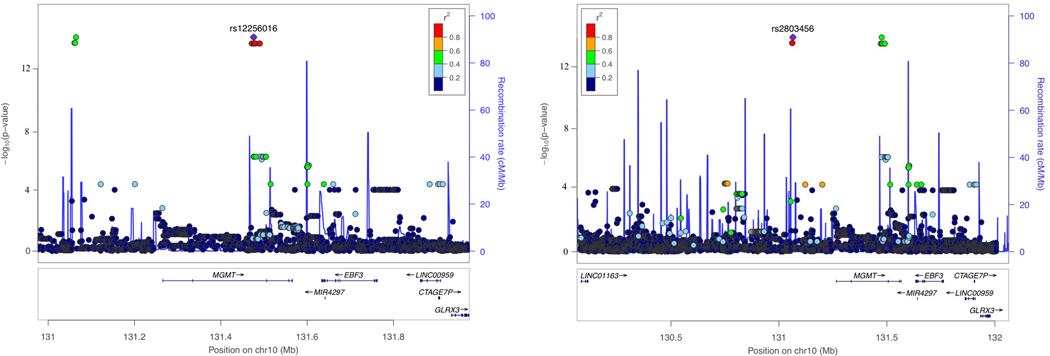
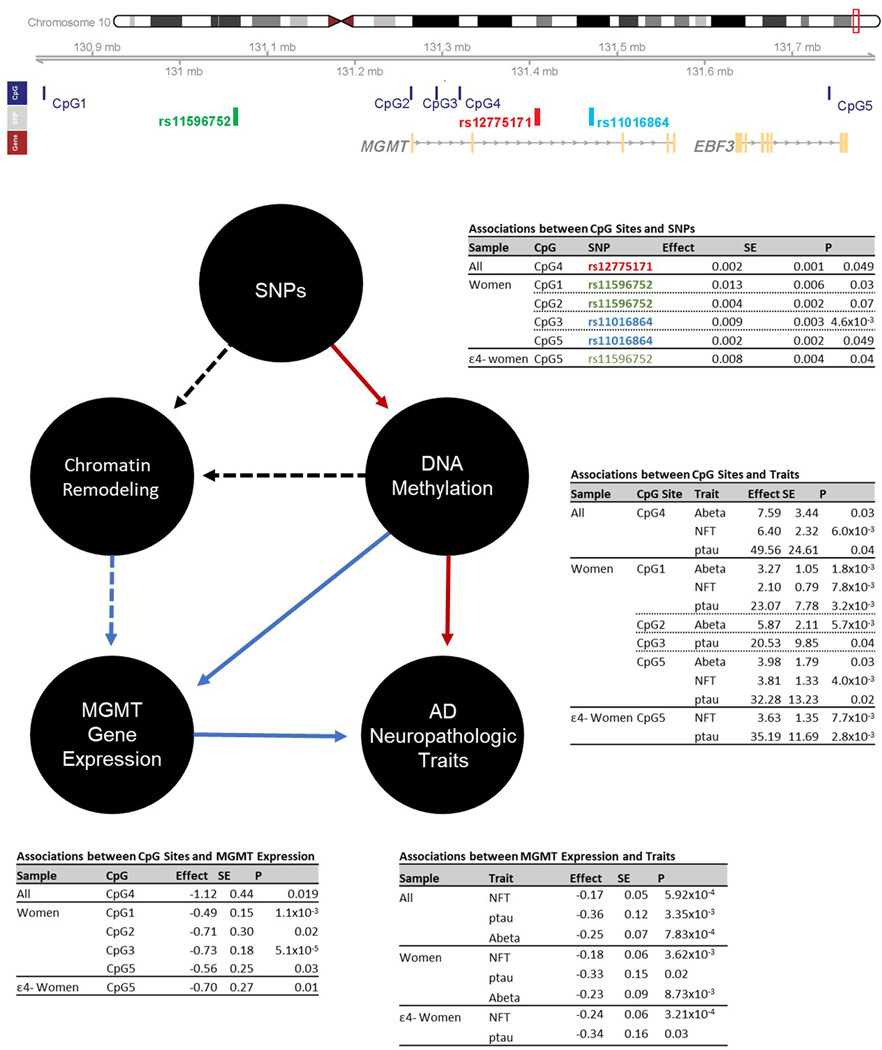
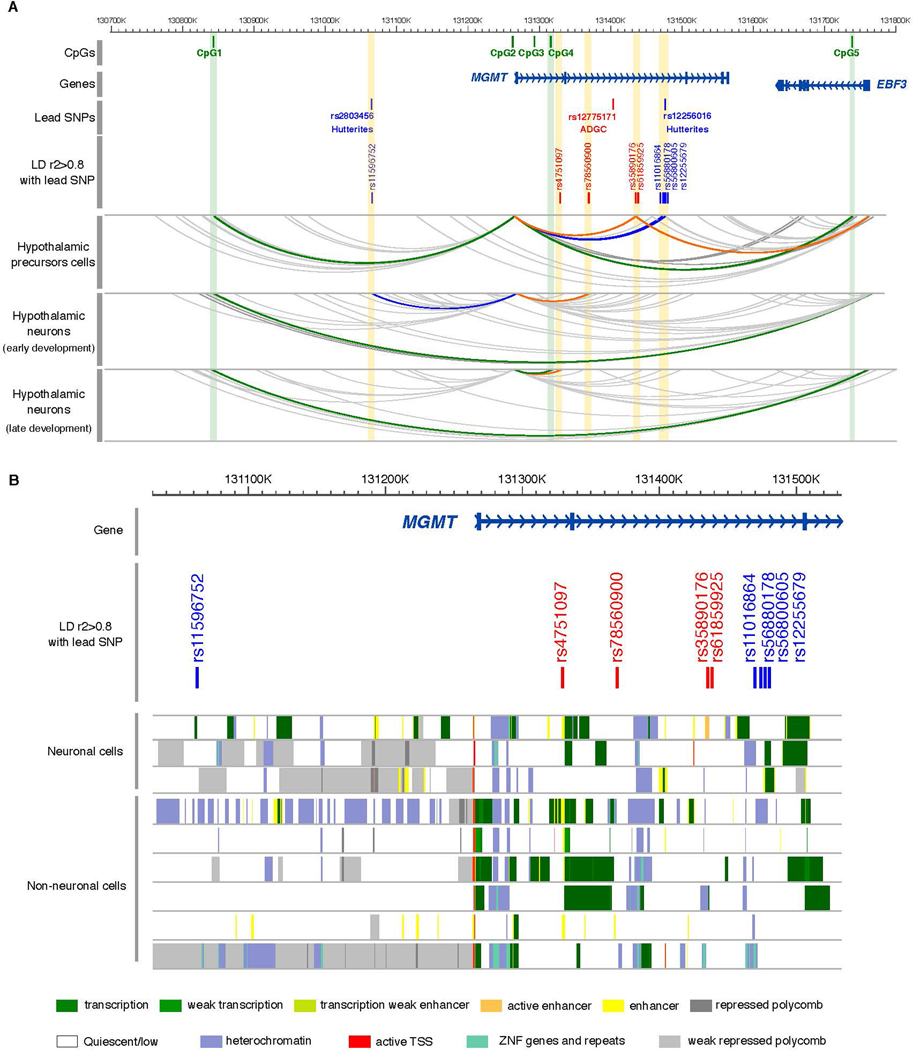
Results: We identified novel associations of AD with MGMT variants in the ADGC (rs12775171, odds ratio [OR] = 1.4, P = 4.9 × 10⁻⁸) and Hutterite (rs12256016 and rs2803456, OR = 2.0, P = 1.9 × 10⁻¹⁴) datasets. Multi-omics analyses showed that the most significant and largest number of associations among the single nucleotide polymorphisms (SNPs), DNA-methylated CpGs, MGMT expression, and AD-related neuropathological traits were observed among women. Furthermore, promoter capture Hi-C analyses revealed long-range interactions of the MGMT promoter with MGMT SNPs and CpG sites.
Discussion: These findings suggest that epigenetically regulated MGMT expression is involved in AD pathogenesis, especially in women.
Keywords: MGMT; gene expression; genome‐wide association study; methylation; tau.
© 2022 The Authors. Alzheimer's & Dementia published by Wiley Periodicals LLC on behalf of Alzheimer's Association.
Conflict of interest statement
Figures
Comment in
-
Association of MGMT and BIN1 genes with Alzheimer's disease risk across sex and APOE ε4 status.Alzheimers Dement. 2024 Mar;20(3):2282-2284. doi: 10.1002/alz.13550. Epub 2023 Dec 2. Alzheimers Dement. 2024. PMID: 38041824 Free PMC article. No abstract available.
References
Publication types
MeSH terms
Substances
Grants and funding
- P50 AG008671/AG/NIA NIH HHS/United States
- UL1 RR029893/RR/NCRR NIH HHS/United States
- P30 AG028383/AG/NIA NIH HHS/United States
- P30 AG013854/AG/NIA NIH HHS/United States
- P30 AG066444/AG/NIA NIH HHS/United States
- RF1 AG036042/AG/NIA NIH HHS/United States
- R01 AG022374/AG/NIA NIH HHS/United States
- P50 AG023501/AG/NIA NIH HHS/United States
- U01 AG046152/AG/NIA NIH HHS/United States
- P30 AG010124/AG/NIA NIH HHS/United States
- U01 HG006375/HG/NHGRI NIH HHS/United States
- U01 AG058654/AG/NIA NIH HHS/United States
- R01 AG062634/AG/NIA NIH HHS/United States
- RC2 AG036528/AG/NIA NIH HHS/United States
- P30 AG028377/AG/NIA NIH HHS/United States
- R01 AG069453/AG/NIA NIH HHS/United States
- P50 AG005142/AG/NIA NIH HHS/United States
- R01 AG035137/AG/NIA NIH HHS/United States
- R01 AG009029/AG/NIA NIH HHS/United States
- P50 AG005131/AG/NIA NIH HHS/United States
- P50 AG005128/AG/NIA NIH HHS/United States
- P30 AG010133/AG/NIA NIH HHS/United States
- U24 AG021886/AG/NIA NIH HHS/United States
- R01 AG031581/AG/NIA NIH HHS/United States
- R01 AG009956/AG/NIA NIH HHS/United States
- P50 AG016574/AG/NIA NIH HHS/United States
- P50 AG005146/AG/NIA NIH HHS/United States
- RC2 AG036650/AG/NIA NIH HHS/United States
- R01 AG019085/AG/NIA NIH HHS/United States
- U01 AG032984/AG/NIA NIH HHS/United States
- U01 HG008657/HG/NHGRI NIH HHS/United States
- R01 AG013616/AG/NIA NIH HHS/United States
- R01 AG030146/AG/NIA NIH HHS/United States
- P50 AG008702/AG/NIA NIH HHS/United States
- U01 AG016976/AG/NIA NIH HHS/United States
- P01 AG003991/AG/NIA NIH HHS/United States
- P30 AG008051/AG/NIA NIH HHS/United States
- P50 AG005681/AG/NIA NIH HHS/United States
- P30 AG013846/AG/NIA NIH HHS/United States
- RC2 AG036502/AG/NIA NIH HHS/United States
- P01 AG026276/AG/NIA NIH HHS/United States
- R01 AG017917/AG/NIA NIH HHS/United States
- R01 HL085197/HL/NHLBI NIH HHS/United States
- R01 MH080295/MH/NIMH NIH HHS/United States
- R01 AG026390/AG/NIA NIH HHS/United States
- R01 AG028786/AG/NIA NIH HHS/United States
- KL2 RR024151/RR/NCRR NIH HHS/United States
- P50 AG005136/AG/NIA NIH HHS/United States
- P30 AG012300/AG/NIA NIH HHS/United States
- R01 AG012101/AG/NIA NIH HHS/United States
- P50 AG016573/AG/NIA NIH HHS/United States
- P50 AG016570/AG/NIA NIH HHS/United States
- P50 AG005134/AG/NIA NIH HHS/United States
- R01 HD021244/HD/NICHD NIH HHS/United States
- P30 AG008017/AG/NIA NIH HHS/United States
- R01 AG042437/AG/NIA NIH HHS/United States
- U24 AG041689/AG/NIA NIH HHS/United States
- P01 AG019724/AG/NIA NIH HHS/United States
- R01 AG036042/AG/NIA NIH HHS/United States
- P30 AG010161/AG/NIA NIH HHS/United States
- R01 AG033193/AG/NIA NIH HHS/United States
- P50 AG025688/AG/NIA NIH HHS/United States
- R01 AG032990/AG/NIA NIH HHS/United States
- R37 AG015473/AG/NIA NIH HHS/United States
- U24 AG026395/AG/NIA NIH HHS/United States
- R01 CA129769/CA/NCI NIH HHS/United States
- P50 AG005133/AG/NIA NIH HHS/United States
- U01 AG010483/AG/NIA NIH HHS/United States
- P01 AG002219/AG/NIA NIH HHS/United States
- U01 AG006781/AG/NIA NIH HHS/United States
- R01 AG041797/AG/NIA NIH HHS/United States
- P50 AG005144/AG/NIA NIH HHS/United States
- U01 AG062602/AG/NIA NIH HHS/United States
- P01 AG010491/AG/NIA NIH HHS/United States
- R01 AG021547/AG/NIA NIH HHS/United States
- P50 AG005138/AG/NIA NIH HHS/United States
- R01 AG048927/AG/NIA NIH HHS/United States
- R01 AG037212/AG/NIA NIH HHS/United States
- R01 AG022018/AG/NIA NIH HHS/United States
- R01 AG019757/AG/NIA NIH HHS/United States
- R01 AG020688/AG/NIA NIH HHS/United States
- R01 AG030653/AG/NIA NIH HHS/United States
- P20 MD000546/MD/NIMHD NIH HHS/United States
- R01 AG027944/AG/NIA NIH HHS/United States
- R01 AG017173/AG/NIA NIH HHS/United States
- R01 AG025259/AG/NIA NIH HHS/United States
- RF1 AG057519/AG/NIA NIH HHS/United States
- U01 HG004610/HG/NHGRI NIH HHS/United States
- P30 AG010129/AG/NIA NIH HHS/United States
- P30 AG019610/AG/NIA NIH HHS/United States
- P50 AG016582/AG/NIA NIH HHS/United States
- R01 AG041718/AG/NIA NIH HHS/United States
- R01 AG026916/AG/NIA NIH HHS/United States
- P50 AG033514/AG/NIA NIH HHS/United States
- R01 NS059873/NS/NINDS NIH HHS/United States
- U19 AG068753/AG/NIA NIH HHS/United States
- R01 AG015819/AG/NIA NIH HHS/United States
LinkOut - more resources
Full Text Sources
Medical
Molecular Biology Databases
Research Materials
