

Variation within the visually evoked neurovascular coupling response of the posterior cerebral artery is not influenced by age or sex
- PMID: 35771218
- PMCID: PMC9359642
- DOI: 10.1152/japplphysiol.00292.2021
Variation within the visually evoked neurovascular coupling response of the posterior cerebral artery is not influenced by age or sex
Abstract
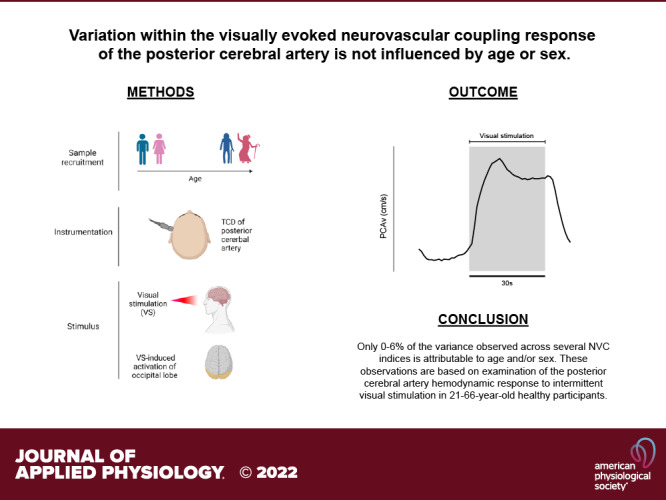
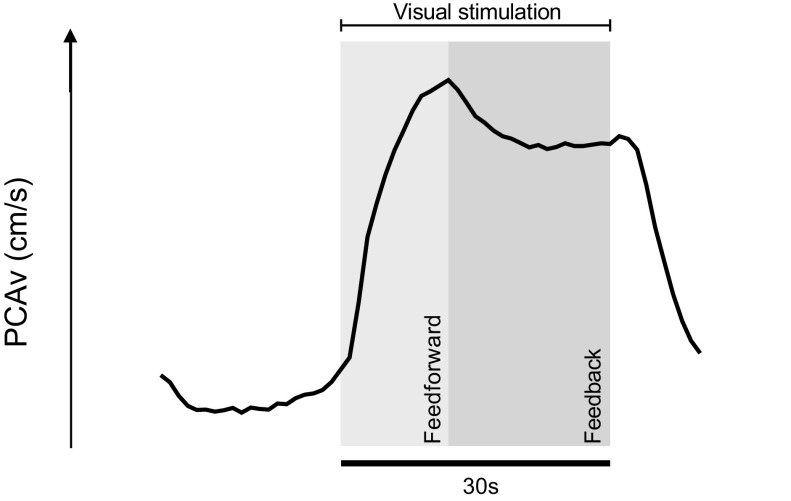
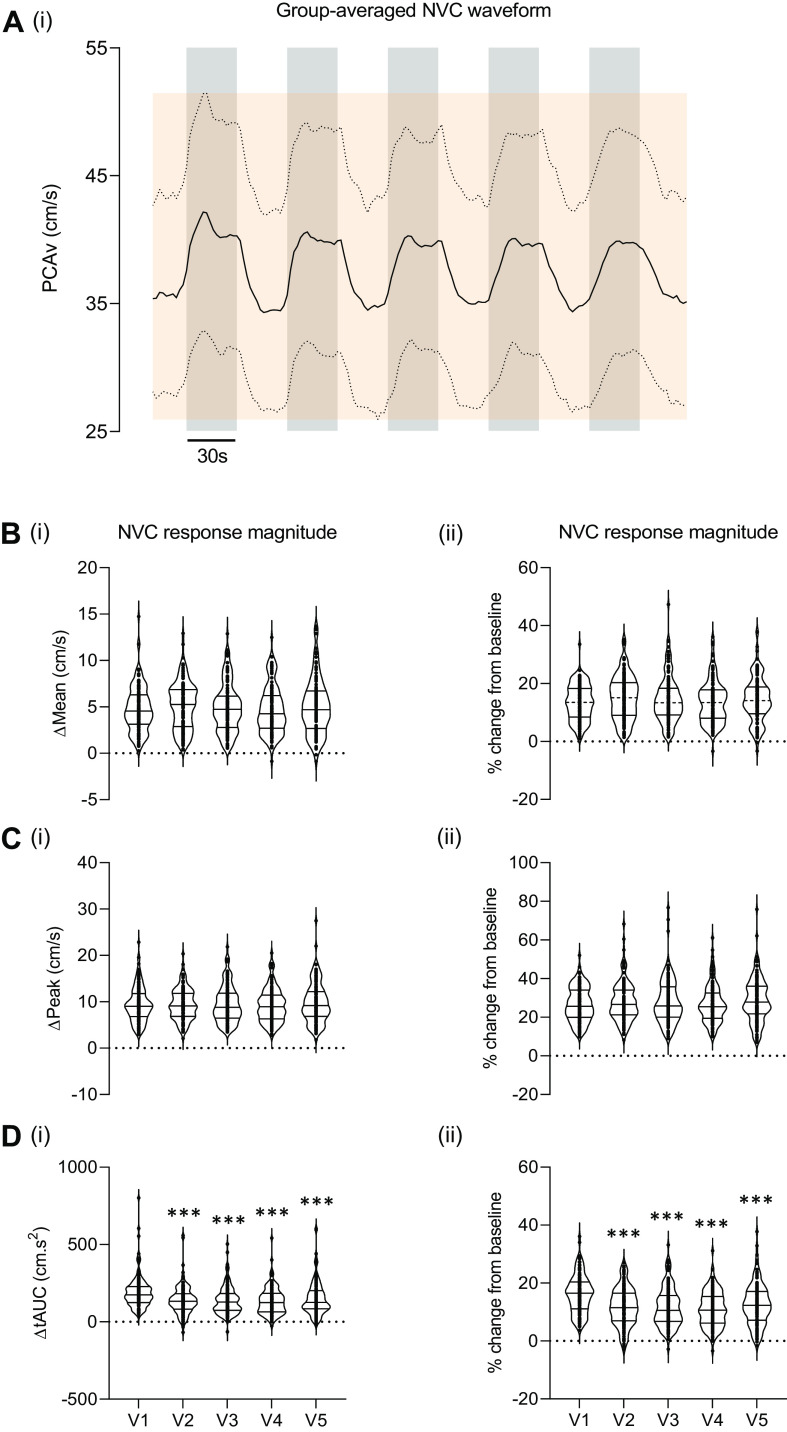
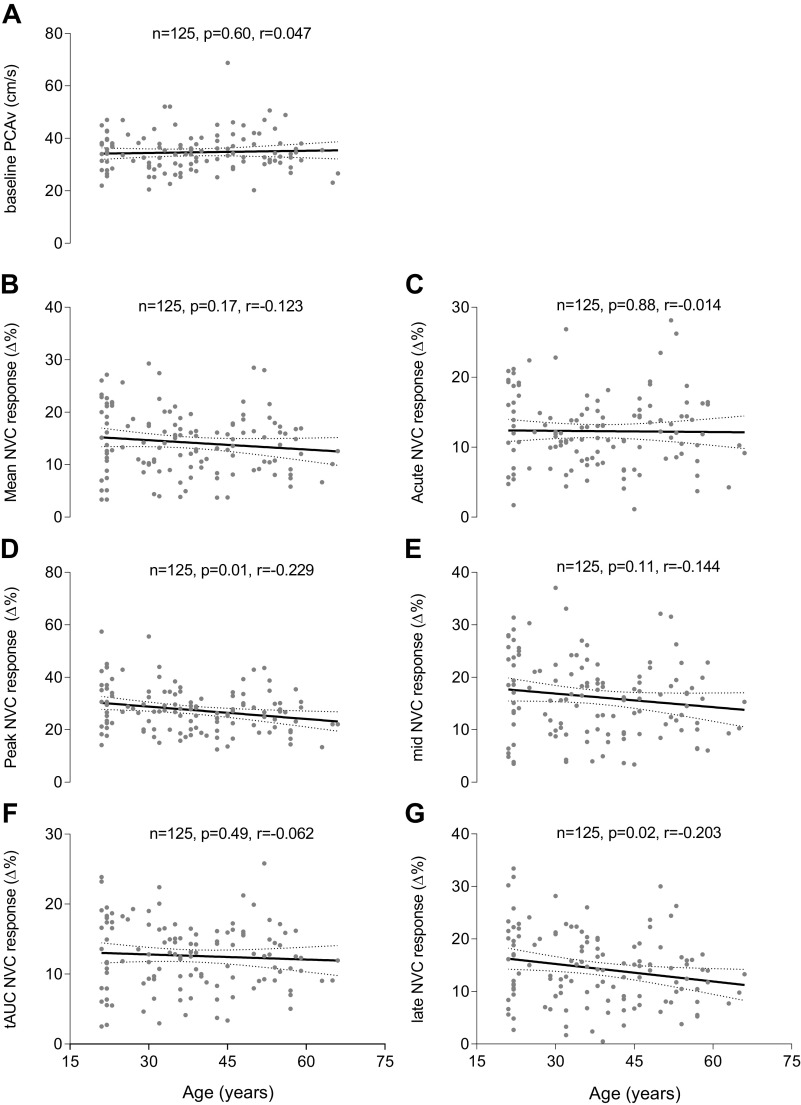
Neurovascular coupling (NVC) is the temporal and spatial coordination between local neuronal activity and regional cerebral blood flow. The literature is unsettled on whether age and/or sex affect NVC, which may relate to differences in methodology and the quantification of NVC in small sample-sized studies. The aim of this study was to 1) determine the relative and combined contribution of age and sex to the variation observed across several distinct NVC metrics (n = 125, 21-66 yr; 41 males) and 2) present an approach for the comprehensive systematic assessment of the NVC response using transcranial Doppler ultrasound. NVC was measured as the relative change from baseline (absolute and percent change) assessing peak, mean, and total area under the curve (tAUC) of cerebral blood velocity through the posterior cerebral artery (PCAv) during intermittent photic stimulation. In addition, the NVC waveform was compartmentalized into distinct regions, acute (0-9 s), mid (10-19 s), and late (20-30 s), following the onset of photic stimulation. Hierarchical multiple regression modeling was used to determine the extent of variation within each NVC metric attributable to demographic differences in age and sex. After controlling for differences in baseline PCAv, the R2 data suggest that 1.6%, 6.1%, 1.1%, 3.4%, 2.5%, and 4.2% of the variance observed within mean, peak, tAUC, acute, mid, and late response magnitude is attributable to the combination of age and sex. Our study reveals that variability in NVC response magnitude is independent of age and sex in healthy human participants, aged 21-66 yr.NEW & NOTEWORTHY We assessed the variability within the neurovascular coupling response attributable to age and sex (n = 125, 21-66 yr; 41 male). Based on the assessment of posterior cerebral artery responses to visual stimulation, 0%-6% of the variance observed within several metrics of NVC response magnitude are attributable to the combination of age and sex. Therefore, observed differences between age groups and/or sexes are likely a result of other physiological factors.
Keywords: aging; cerebral blood flow; neurovascular coupling; sex.
Conflict of interest statement
No conflicts of interest, financial or otherwise, are declared by the authors.
Figures
Similar articles
-
Sex modifies the relationship between age and neurovascular coupling in healthy adults.J Cereb Blood Flow Metab. 2023 Aug;43(8):1254-1266. doi: 10.1177/0271678X231167753. Epub 2023 Apr 5. J Cereb Blood Flow Metab. 2023. PMID: 37017422 Free PMC article.
-
Do mean values tell the full story? Cardiac cycle and biological sex comparisons in temporally derived neurovascular coupling metrics.J Appl Physiol (1985). 2023 Feb 1;134(2):426-443. doi: 10.1152/japplphysiol.00170.2022. Epub 2023 Jan 5. J Appl Physiol (1985). 2023. PMID: 36603050
-
Acute intermittent hypercapnic hypoxia and cerebral neurovascular coupling in males and females.Exp Neurol. 2020 Dec;334:113441. doi: 10.1016/j.expneurol.2020.113441. Epub 2020 Sep 3. Exp Neurol. 2020. PMID: 32890469
-
[Neurovascular coupling responses and cognitive function: The impact of aging and the interventional effect of exercise].Sheng Li Xue Bao. 2023 Dec 25;75(6):903-917. Sheng Li Xue Bao. 2023. PMID: 38151352 Review. Chinese.
-
Assessment of age-related decline of neurovascular coupling responses by functional near-infrared spectroscopy (fNIRS) in humans.Geroscience. 2019 Oct;41(5):495-509. doi: 10.1007/s11357-019-00122-x. Epub 2019 Nov 2. Geroscience. 2019. PMID: 31676966 Free PMC article. Review.
Cited by
-
Cerebral blood flow regulation is not acutely altered after a typical number of headers in women footballers.Front Neurol. 2022 Nov 21;13:1021536. doi: 10.3389/fneur.2022.1021536. eCollection 2022. Front Neurol. 2022. PMID: 36479047 Free PMC article.
-
Generation of a whole-brain hemodynamic response function and sex-specific differences in cerebral processing of mechano-sensation in mice detected by BOLD fMRI.Front Neurosci. 2023 Aug 28;17:1187328. doi: 10.3389/fnins.2023.1187328. eCollection 2023. Front Neurosci. 2023. PMID: 37700753 Free PMC article.
-
Characterizing the protective vasodilatory effects of hypobaric hypoxia on the neurovascular coupling response.J Cereb Blood Flow Metab. 2025 Jul;45(7):1293-1309. doi: 10.1177/0271678X251322348. Epub 2025 Mar 13. J Cereb Blood Flow Metab. 2025. PMID: 40079563 Free PMC article.
-
Cognitive brain lateralization through neurovascular coupling in healthy subjects: A statistical complexity analysis.Physiol Rep. 2025 Aug;13(15):e70492. doi: 10.14814/phy2.70492. Physiol Rep. 2025. PMID: 40771095 Free PMC article.
-
Hypocapnia, eucapnia and hypercapnia during "Where's Waldo" search paradigms: Neurovascular coupling across the cardiac cycle and biological sexes.J Cereb Blood Flow Metab. 2025 Jul;45(7):1310-1325. doi: 10.1177/0271678X251318922. Epub 2025 Feb 4. J Cereb Blood Flow Metab. 2025. PMID: 39904597 Free PMC article.
References
Publication types
MeSH terms
Grants and funding
LinkOut - more resources
Full Text Sources