Comment
. 2022 Sep 2;12(9):2180-2197.
doi: 10.1158/2159-8290.CD-22-0043.

NCOA4-Mediated Ferritinophagy Is a Pancreatic Cancer Dependency via Maintenance of Iron Bioavailability for Iron-Sulfur Cluster Proteins

Affiliations
Comment

NCOA4-Mediated Ferritinophagy Is a Pancreatic Cancer Dependency via Maintenance of Iron Bioavailability for Iron-Sulfur Cluster Proteins

Naiara Santana-Codina et al. Cancer Discov. .

Abstract

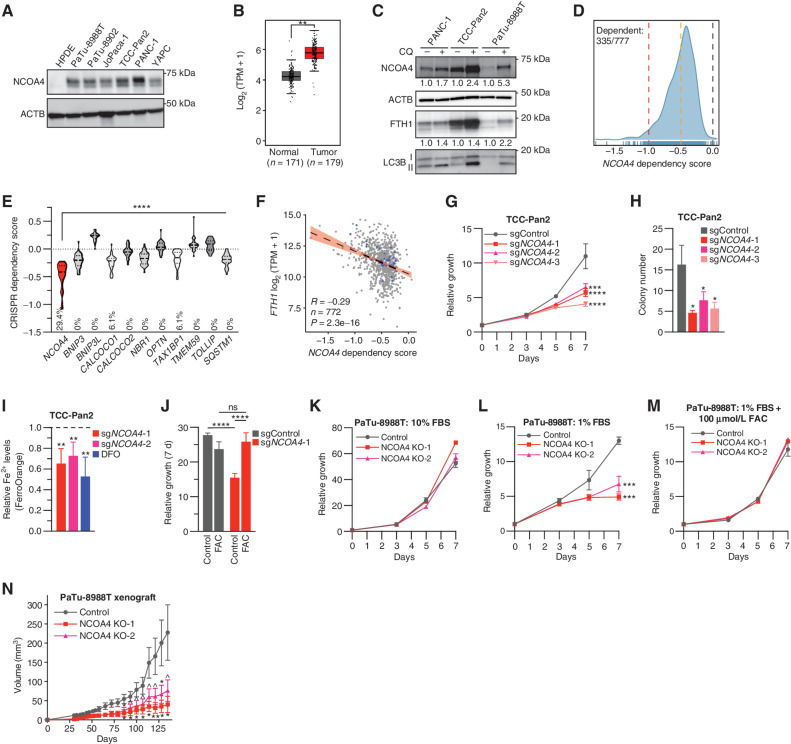
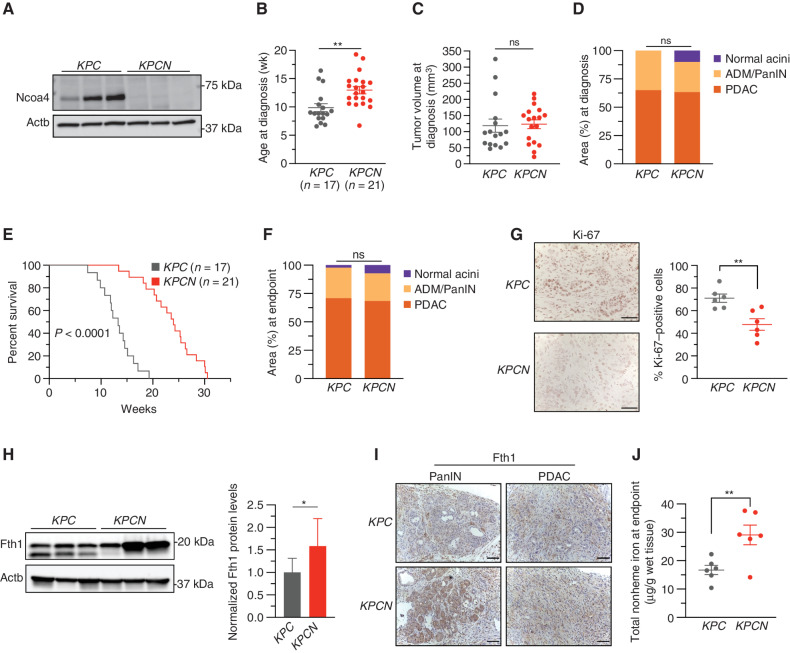
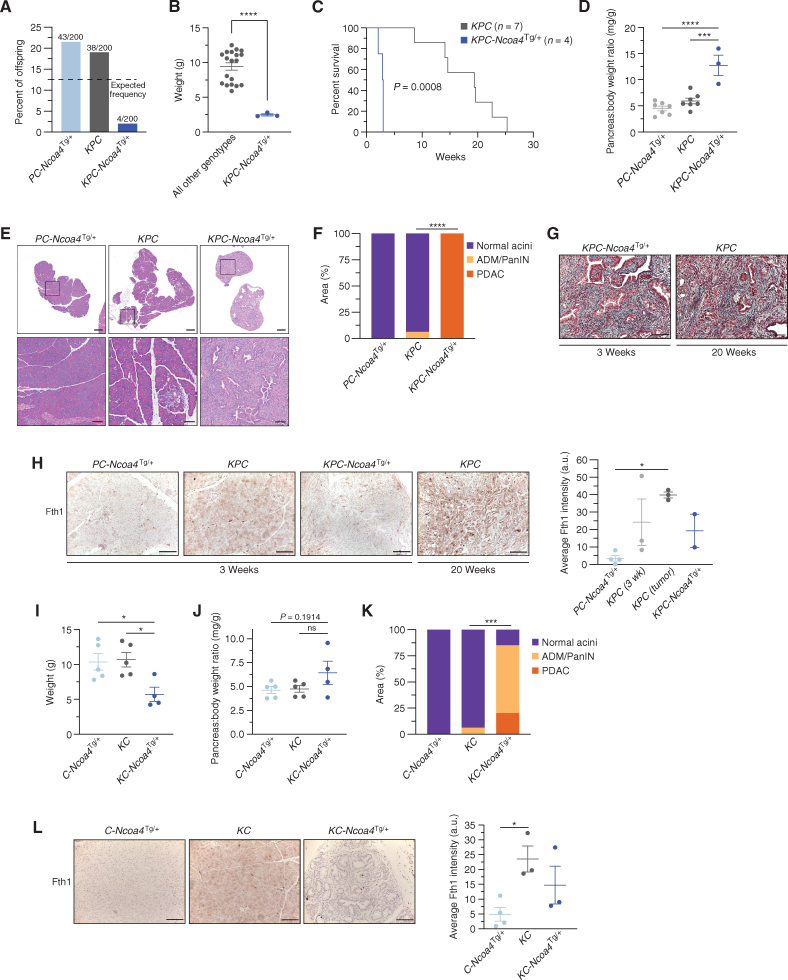
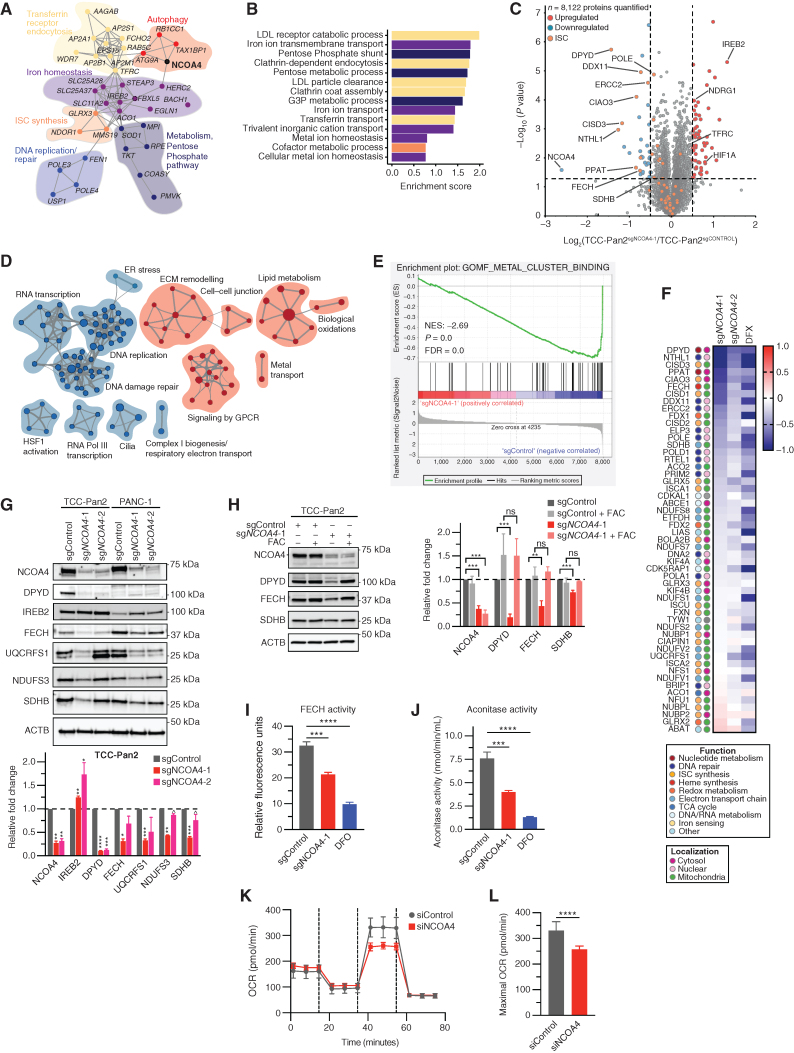
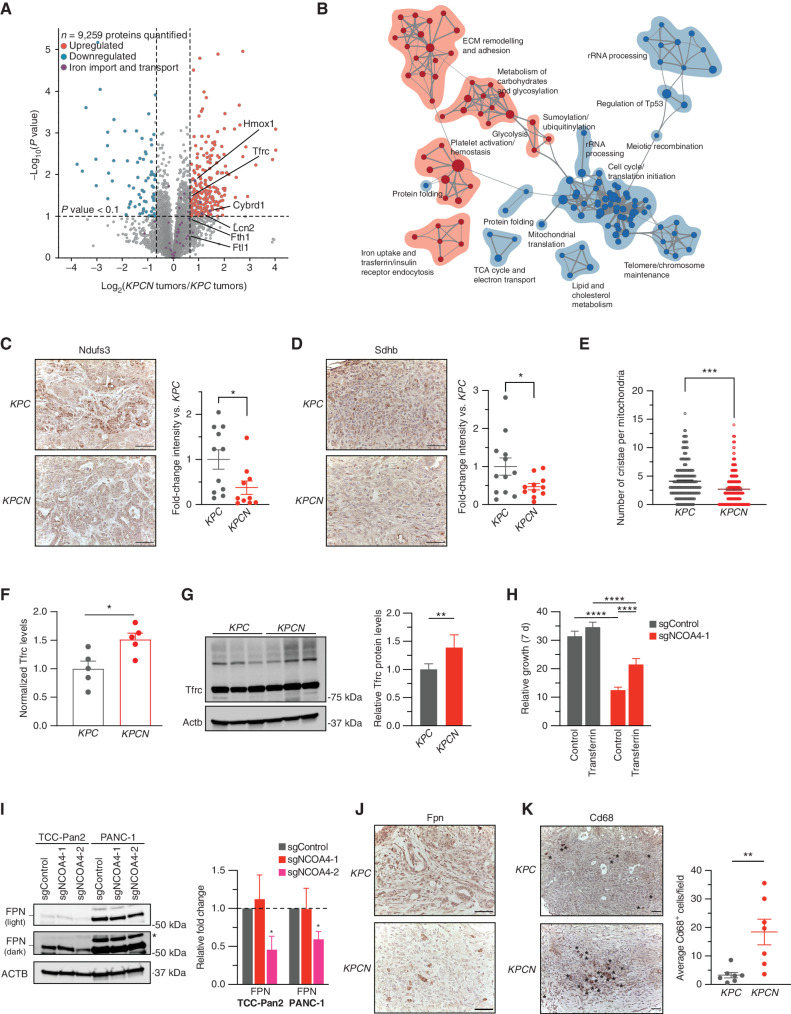
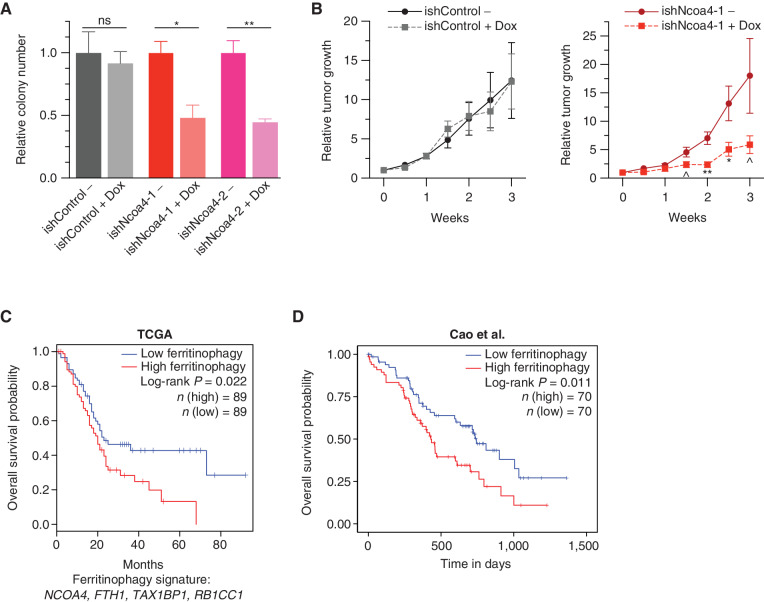
Pancreatic ductal adenocarcinomas (PDAC) depend on autophagy for survival; however, the metabolic substrates that autophagy provides to drive PDAC progression are unclear. Ferritin, the cellular iron storage complex, is targeted for lysosomal degradation (ferritinophagy) by the selective autophagy adaptor NCOA4, resulting in release of iron for cellular utilization. Using patient-derived and murine models of PDAC, we demonstrate that ferritinophagy is upregulated in PDAC to sustain iron availability, thereby promoting tumor progression. Quantitative proteomics reveals that ferritinophagy fuels iron-sulfur cluster protein synthesis to support mitochondrial homeostasis. Targeting NCOA4 leads to tumor growth delay and prolonged survival but with the development of compensatory iron acquisition pathways. Finally, enhanced ferritinophagy accelerates PDAC tumorigenesis, and an elevated ferritinophagy expression signature predicts for poor prognosis in patients with PDAC. Together, our data reveal that the maintenance of iron homeostasis is a critical function of PDAC autophagy, and we define NCOA4-mediated ferritinophagy as a therapeutic target in PDAC.

Significance: Autophagy and iron metabolism are metabolic dependencies in PDAC. However, targeted therapies for these pathways are lacking. We identify NCOA4-mediated selective autophagy of ferritin ("ferritinophagy") as upregulated in PDAC. Ferritinophagy supports PDAC iron metabolism and thereby tumor progression and represents a new therapeutic target in PDAC. See related commentary by Jain and Amaravadi, p. 2023. See related article by Ravichandran et al., p. 2198. This article is highlighted in the In This Issue feature, p. 2007.


Figures

Figure 1.
Figure 1.
NCOA4 is a dependency in PDAC. A, Immunoblot showing NCOA4 protein levels in lysates from HPDE (human pancreatic ductal epithelial) and PDAC cell lines, as indicated. B,NCOA4 mRNA expression levels in human normal pancreas tissue [Genotype-Tissue Expression (GTEx) and The Cancer Genome Atlas (TCGA) normal, n = 171 patients] versus human PDAC tumor (TCGA, n = 179 patients). The data are presented as box-and-whisker plots, and boxes represent the median and the 25th and 75th percentiles (**, P < 0.01, t test, as calculated in the GEPIA2 database). TPM, transcripts per million. C, Immunoblot showing NCOA4, FTH1, and MAP1LC3B (LC3B) protein levels in lysates from PDAC cell lines treated with or without CQ (10 μmol/L for 16 hours). NCOA4 and FTH1 relative quantification (normalized within each cell line) is denoted below each lane. D, Smoothed histogram showing the distribution of NCOA4 dependency scores from the CRISPR–spCas9 DepMap data set (21Q1) across cancer cell lines. The number of dependent cell lines (CRISPR score less than −0.5, orange line) over the total number of probed cell lines is shown in the top left corner. Red line at −1: CRISPR score for a set of control highly essential genes. Black line at 0: CRISPR score of negative control single-guide RNAs (sgRNA). E, Violin plot of CRISPR dependency scores of selective autophagy receptor genes in PDAC cell lines represented in the DepMap (n = 34); dashed line: median value; dotted line: quartile values. Percentage of cell lines scored as a dependent (CRISPR score less than −0.5) indicated at bottom of graph (P < 0.0001 for all comparisons to NCOA4 using ANOVA with Dunnett multiple comparisons test). F, Scatter plot showing linear regression with 95% confidence interval (black line) and Pearson correlation coefficient between FTH1 mRNA expression (y-axis) and NCOA4 CRISPR dependency scores (x-axis) across 772 cancer cell lines; blue dots represent data for PDAC cell lines. G, Relative proliferation of pools of TCC-Pan2 cells lentivirally transduced with control Cas9–sgRNA targeting the nonessential Rosa26 locus (sgControl) or three independent Cas9–sgRNAs targeting NCOA4 (sgNCOA4). Data are plotted as relative cell proliferation in arbitrary units. Values normalized to day 0. Error bars, SD of 6 technical replicates (representative of 3 independent experiments). NCOA4 depletion/KD level (>90%) is displayed in Supplementary Fig. S1E. H, Clonogenic growth of TCC-Pan2 NCOA4 KD cells expressing lentiviral sgRNAs as in G. Error bars  ±  SD triplicate wells of a representative experiment of 3 independent experiments. I, Quantification of intracellular Fe2+ by FerroOrange staining and flow cytometry in TCC-Pan2 NCOA4 KD cells. Mean fluorescence intensity was normalized to cells transduced with sgControl. DFO (100 μmol/L) was used as a positive control. Dotted line indicates sgControl normalized intensity level. Error bars  ±  SD of 4 independent experiments. J, Relative proliferation measured at 7 day of TCC-Pan2 cells expressing sgControl or sgNCOA4-1 treated with or without FAC (50 μmol/L) and ferrostatin-1 (500 nmol/L; see Methods). Values normalized to day 0. Error bars  ±  SD, triplicate wells of a representative experiment of 3 independent experiments. K, Relative proliferation of control versus NCOA4 clonal KO PaTu-8988T cells grown in media containing 10% FBS. Values normalized to day 0. Error bars, SD of 3 technical replicates (representative of 3 independent experiments). L, Relative proliferation of control versus NCOA4 KO PaTu-8988T cells grown in media containing 1% FBS as in K. M, Relative proliferation of control versus NCOA4 KO PaTu-8988T cells grown in media containing 1% FBS with FAC (100 μmol/L) and ferrostatin-1 (1 μmol/L). N,In vivo subcutaneous tumor growth in immunocompromised NCr-Foxn1nu mice of PaTu-8988T control versus NCOA4 KO cells as in K. Error bars ± SEM; n = 14–15 mice. For GN, significance was determined with the t test. ns = not significant: P > 0.1; ^, P < 0.1; *, P < 0.05; **, P < 0.01; ***, P < 0.001; ****, P < 0.0001.
Figure 2.
Figure 2.
Loss of Ncoa4 extends murine PDAC survival. A, Immunoblot showing Ncoa4 protein levels in lysates from tumor-derived cell lines from KPC and KPCN mice (n = 3 independent tumor-derived cell lines per genotype). B, Age at pancreatic tumor diagnosis as determined by high-resolution ultrasound. C, Tumor volume at time of diagnosis as measured by ultrasound; KPC, n = 16, KPCN, n = 18. D, Quantification of normal acinar, acinar-to-ductal metaplasia (ADM)/PanIN, and PDAC area in KPC (n = 4) versus KPCN (n = 3) pancreata at time of diagnosis as measured on hematoxylin and eosin (H&E) staining. E, Kaplan–Meier analysis comparing overall survival of KPC (n = 17) versus KPCN (n = 21) mice. Log-rank test, P < 0.0001. F, Quantification of normal acinar, ADM/PanIN, and PDAC area in KPC (n = 16) versus KPCN (n = 16) pancreata at endpoint as measured on H&E staining. G, Pancreatic tumors from KPC and KPCN tumors at endpoint stained with Ki-67 antibody; representative field displayed. The percentage of Ki-67–positive cells was counted in 5 fields from each tumor; n = 6 tumors per genotype; scale bars = 50 μm. H, Immunoblot showing Fth1 protein levels in lysates from tumor-derived cell lines from KPC and KPCN mice (n = 3 independent tumor-derived cell lines per genotype; quantification is of 3 KPC and 3 KPCN cell lines with 3 replicates). Lower band in the Fth1 blot is indicative of a lysosomal processed form of Fth1. Error bars  ±  SD. I, Fth1 immunostaining from PanIN and PDAC areas from representative KPC and KPCN pancreata; scale bars = 50 μm. J, Tumor nonheme iron levels in KPC versus KPCN tumors at endpoint; n = 6 tumors per genotype. For BD and FJ, significance was determined with the t test. ns = not significant: P > 0.05; *, P < 0.05; **, P < 0.01. Error bars  ±  SEM.
Figure 3.
Figure 3.
Enhanced NCOA4-mediated ferritinophagy accelerates PDAC initiation and worsens murine survival. A, Genotype frequency of Trp53fl/+; Pft1a-Cre; Ncoa4Tg/+ (PC-Ncoa4Tg/+), KrasLSL-G12D/+; Trp53fl/+; Pft1a-Cre (KPC), and KrasLSL-G12D/+; Trp53fl/+; Pft1a-Cre; Ncoa4Tg/+ (KPC-Ncoa4Tg/+) among 200 genotyped offspring mice; dotted line represents expected frequency of genotypes (12.5%). B, Body weight of KPC-Ncoa4Tg/+ mice versus mice of all other genotypes measured at 3 weeks of age. C, Kaplan–Meier analysis comparing overall survival of KPC-Ncoa4Tg/+ (n = 4) versus KPC (n = 7) mice. Log-rank test, P = 0.0008. D, Pancreas–to–body weight ratio of PC-Ncoa4Tg/+, KPC, and KPC-Ncoa4Tg/+ mice. E, Hematoxylin and eosin staining of representative pancreata from PC-Ncoa4Tg/+, KPC, and KPC-Ncoa4Tg/+ mice harvested at 3 weeks of age. Bottom row panels are magnifications of top row images. Top row scale bars = 500 μm. Bottom row scale bars = 100 μm. F, Quantification of normal acinar, acinar-to-ductal metaplasia (ADM)/PanIN, and PDAC area in PC-Ncoa4Tg/+ (n = 2), KPC (n = 4), and KPC-Ncoa4Tg/+ (n = 2) mice harvested at 3 to 4 weeks of age. G, Trichrome staining of representative PDAC tumors from a 3-week-old KPC-Ncoa4Tg/+ mouse and a 20-week-old tumor-bearing KPC mouse. H, Fth1 immunostaining of pancreata from PC-Ncoa4Tg/+, KPC, and KPC-Ncoa4Tg/+ mice at 3 to 4 weeks of age and tumor-bearing KPC mice. Scale bars, 50 μm. Quantification of average intensity in arbitrary units (a.u.; 5 random fields per sample; n = 2–4 mice/group; error bars, SEM). I, Body weight of C-Ncoa4Tg/+ (n = 5), KC (n = 5), and KC-Ncoa4Tg/+ (n = 4) mice measured at 3 weeks of age. J, Pancreas–to–body weight ratio of C-Ncoa4Tg/+ (n = 5), KC (n = 5), and KC-Ncoa4Tg/+ (n = 4) mice measured at 3 weeks of age. K, Quantification of normal acinar, ADM/PanIN, and PDAC area in C-Ncoa4Tg/+ (n = 5), KC (n = 6), and KC-Ncoa4Tg/+ (n = 3) mice harvested at 3 to 4 weeks of age. L, Fth1 immunostaining of pancreata from C-Ncoa4Tg/+, KC, and KC-Ncoa4Tg/+ mice at 3 to 4 weeks of age. Scale bars = 50 μm. Quantification of average intensity in arbitrary units (5 random fields per sample; n = 3–4 mice/group; error bars, SEM). For B, F, and K, significance was determined with the t test. ***, P < 0.001; ****, P < 0.0001. Error bars ± SEM. For D, HJ, and L, significance was determined using ANOVA. ns = not significant: P > 0.05; *, P < 0.05; ***, P < 0.001; ****, P < 0.0001. Error bars ± SEM.
Figure 4.
Figure 4.
NCOA4-mediated ferritinophagy supports ISC protein levels and activity in PDAC cells. A, Network map showing gene dependencies most highly correlated with NCOA4 dependency in the DepMap (21Q1). Gray connections indicate the interaction between genes as predicted by STRING. Functional clusters manually annotated based on Gene Ontology (GO) biological process analysis as in B. FBXL5 is anticorrelated to NCOA4 dependency. B, GO biological process enrichment analysis of gene dependencies most highly correlated with NCOA4 dependency in the DepMap (21Q1). LDL, low-density lipoprotein. C, Volcano plot illustrates statistically significant protein abundance differences in TCC-Pan2 cells lentivirally transduced with sgNCOA4-1–Cas9 versus sgControl–Cas9. Volcano plots display the −log10 (P) versus the log2 of the relative protein abundance of mean sgNCOA4-1 to mean sgControl samples. Orange circles represent ISC proteins identified in the data set (n = 53). Red circles represent significantly upregulated proteins (log2 fold change >0.5), whereas blue circles represent significantly downregulated proteins (log2 fold change <−0.5; data from 4 sgControl or 3 sgNCOA4-1 independent plates). D, Enrichment map of GSEA-Reactome of sgNCOA4-1 compared with sgControl TCC-Pan2 proteome (P < 0.01; FDR q value <0.1; Jaccard coefficient >0.5). Node size is related to the number of components identified within a gene set, and the width of the line is proportional to the overlap between related gene sets. GSEA terms associated with upregulated (red) and downregulated (blue) proteins are colored accordingly and grouped into nodes with associated terms. ECM, extracellular matrix; ER, endoplasmic reticulum. E, Enrichment plot for GO (molecular function) Metal Cluster Binding gene set of sgNCOA4-1 compared with the sgControl TCC-Pan2 proteome. F, Log2 (fold change) heat map for ISC-containing proteins and ISC synthesis proteins as measured from TCC-Pan2 cells [comparisons are sgNCOA4-1/sgControl, sgNCOA4–2/sgControl, sgControl + deferasirox (DFX)/sgControl]. Values presented are the mean of 3 independent plates. Color legends: color scheme for functional and localization categories of ISCs. TCA, tricarboxylic acid. G, Immunoblot showing ISC protein levels in lysates from TCC-Pan2 and PANC-1 cell lines lentivirally transduced with sgControl, sgNCOA4-1, or sgNCOA4-2 (NCOA4 KD). Relative fold-change quantification is of 2 to 3 replicates. Increased IREB2 levels serve as a positive control indicative of decreased free iron. H, Immunoblot showing ISC protein levels in lysates from TCC-Pan2 cell lines lentivirally transduced with sgControl or sgNCOA4-1 with or without FAC (100 μmol/L). Relative fold-change quantification is of 4 replicates. I, FECH activity from TCC-Pan2 cells lentivirally transduced with sgControl, sgNCOA4-1, or sgControl cells treated with DFO (12 hours, 1 mmol/L) as measured by the formation of zinc–mesoporphyrin (monitored at 400 nm). J, Cytosolic aconitase activity from TCC-Pan2 cells lentivirally transduced with sgControl, sgNCOA4-1, or sgControl cells treated with DFO (12 hours, 1 mmol/L). K, OCR of mitochondrial respiratory complex using Seahorse in TCC-Pan2 cells transduced with siControl or siNCOA4. L, Maximal OCR in TCC-Pan2 cells transduced with siControl or siNCOA4. For GJ and L, significance was determined with the t test. ns = not significant: P > 0.1; ^, P < 0.1; *, P < 0.05; **, P < 0.01; ***, P < 0.001; ****, P < 0.0001. Error bars, ± SD.
Figure 5.
Figure 5.
NCOA4-mediated ferritinophagy supports mitochondrial ISC protein levels and mitochondria structure in murine PDAC tumors. A, Volcano plot illustrates statistically significant protein abundance differences in KPCN versus KPC tumors. Volcano plots display the −log10 (P) versus the log2 of the relative protein abundance of mean KPCN to KPC tumors (n = 5 tumors per genotype; proteins with log2 fold change between −4 and 4 are graphed). Purple circles represent iron transport proteins identified in the data set. Red circles represent significantly upregulated proteins (log2 fold change >0.7), whereas blue circles represent significantly downregulated proteins (log2 fold change <−0.7). B, Enrichment map of GSEA-Reactome of KPCN compared with KPC tumor proteomes (P < 0.005; FDR q value <0.05; Jaccard coefficient >0.5). Node size is related to the number of components identified within a gene set, and the width of the line is proportional to the overlap between related gene sets. GSEA terms associated with upregulated (red) and downregulated (blue) proteins are colored accordingly and grouped into nodes with associated terms. ECM, extracellular matrix; TCA, tricarboxylic acid. C, Ndufs3 immunostaining of tumors from KPC and KPCN tumors at endpoint; representative image is displayed. Scale bars, 50 μm. Quantification of average intensity presented in relative fold change (5 random fields per sample, n = 10–11 mice/group; error bars, SEM). D, Sdhb immunostaining of tumors from KPC and KPCN tumors at endpoint, representative image displayed. Scale bars, 50 μm. Quantification of average intensity presented in relative fold change (5 random fields per sample; n = 11–12 mice/group; error bars, SEM). E, Quantification of mitochondrial cristae number from electron microscopy images of pancreata from KPC and KPCN mice (n = 3 mice/group; 40–100 mitochondria quantified for each mouse). F, Relative protein levels of Tfrc as measured in global KPC and KPCN proteome as in A, normalized to KPC Tfrc protein levels. G, Immunoblot showing Tfrc protein levels in lysates from tumor-derived cell lines from KPC and KPCN mice (n = 3 independent tumor-derived cell lines per genotype; quantification is of 3 KPC and 3 KPCN cell lines with 2 replicates). H, Relative proliferation measured at 7 days of TCC-Pan2 cells expressing sgControl versus sgNCOA4-1 treated with or without holo-transferrin (10 μmol/L). Values normalized to day 0. Error bars ± SD; n = 6 wells of a representative experiment of 3 independent experiments. I, Immunoblot showing ferroportin (SLC40A1/FPN) protein levels in lysates from TCC-Pan2 and PANC-1 cell lines lentivirally transduced with sgControl, sgNCOA4-1, or sgNCOA4-2 (* = nonspecific band). Relative fold-change quantification is of 3 replicates. J, Fpn immunostaining of tumors from KPC and KPCN tumors at endpoint; representative image is displayed; scale bars, 50 μm. K, Cd68 immunostaining of tumors from KPC and KPCN mice at endpoint. Representative field; scale bars, 50 μm; Cd68-positive cells indicated by asterisks. Quantification (at least 5 fields per sample) of average Cd68+ cells per field (n = 7 mice/group, error bars, SEM). For CI and K, significance was determined with the t test. *, P < 0.05; **, P < 0.01; ***, P < 0.001; ****, P < 0.0001. Error bars for CF and K ±  SEM and for GI ±  SD.
Figure 6.
Figure 6.
NCOA4-mediated ferritinophagy expression signature is a prognostic marker in human PDAC. A, Relative clonogenic growth of KPCY (KrasLSL-G12D/+; Trp53LSL-R172H/+; Pdx1-Cre; Rosa26YFP/YFP) murine PDAC cells expressing doxycycline (Dox)-inducible lentiviral short hairpin RNAs (shRNA): ishControl, ishNcoa4-1, and ishNcoa4-2 treated with or without doxycycline (100 ng/mL). Error bars ± SD; triplicate wells of a representative experiment of 3 independent experiments; significance determined by a two-sided t test. ns = not significant: P > 0.1; *, P < 0.05; **, P < 0.01. B,In vivo subcutaneous tumor growth in C57BL/6 mice of KPCY ishControl versus ishNcoa4-1 cells with and without doxycycline-containing food. Doxycycline was initiated after tumors reached an average of 75 mm3 (day 0 on graph). Error bars ± SEM; n = 6 mice per group. Significance was determined by a one-sided t test. ^, P < 0.1; *, P < 0.05; **, P < 0.01. C, Survival analysis with the log-rank test of a ferritinophagy gene expression signature (NCOA4, FTH1, TAX1BP1, and RB1CC1) in PDAC using the TCGA data set. D, Survival analysis with the log-rank test of a ferritinophagy gene expression signature (NCOA4, FTH1, TAX1BP1, and RB1CC1) in PDAC using the Cao et al. 2021 data set (37).

Comment in

Comment on

Similar articles

Cited by

References

    1. Siegel RL, Miller KD, Jemal A. Cancer statistics, 2019 (US statistics). CA Cancer J Clin 2019;69:7–34. - PubMed
    1. Jiang H, Muir RK, Gonciarz RL, Olshen AB, Yeh I, Hann BC, et al. . Ferrous iron-activatable drug conjugate achieves potent MAPK blockade in KRAS-driven tumors. J Exp Med 2022;219:e20210739. - PMC - PubMed
    1. Yang S, Wang X, Contino G, Liesa M, Sahin E, Ying H, et al. . Pancreatic cancers require autophagy for tumor growth. Gene Dev 2011;25:717–29. - PMC - PubMed
    1. Santana-Codina N, Mancias JD, Kimmelman AC. The role of auto­phagy in cancer. Annu Rev Cancer Biol 2017;1:19–39. - PMC - PubMed
    1. Yang A, Rajeshkumar NV, Wang X, Yabuuchi S, Alexander BM, Chu GC, et al. . Autophagy is critical for pancreatic tumor growth and progression in tumors with p53 alterations. Cancer Discov 2014;4:905–13. - PMC - PubMed

Publication types