Comment
. 2022 Sep 2;12(9):2198-2219.
doi: 10.1158/2159-8290.CD-22-0044.

Coordinated Transcriptional and Catabolic Programs Support Iron-Dependent Adaptation to RAS-MAPK Pathway Inhibition in Pancreatic Cancer

Affiliations
Comment

Coordinated Transcriptional and Catabolic Programs Support Iron-Dependent Adaptation to RAS-MAPK Pathway Inhibition in Pancreatic Cancer

Mirunalini Ravichandran et al. Cancer Discov. .

Abstract

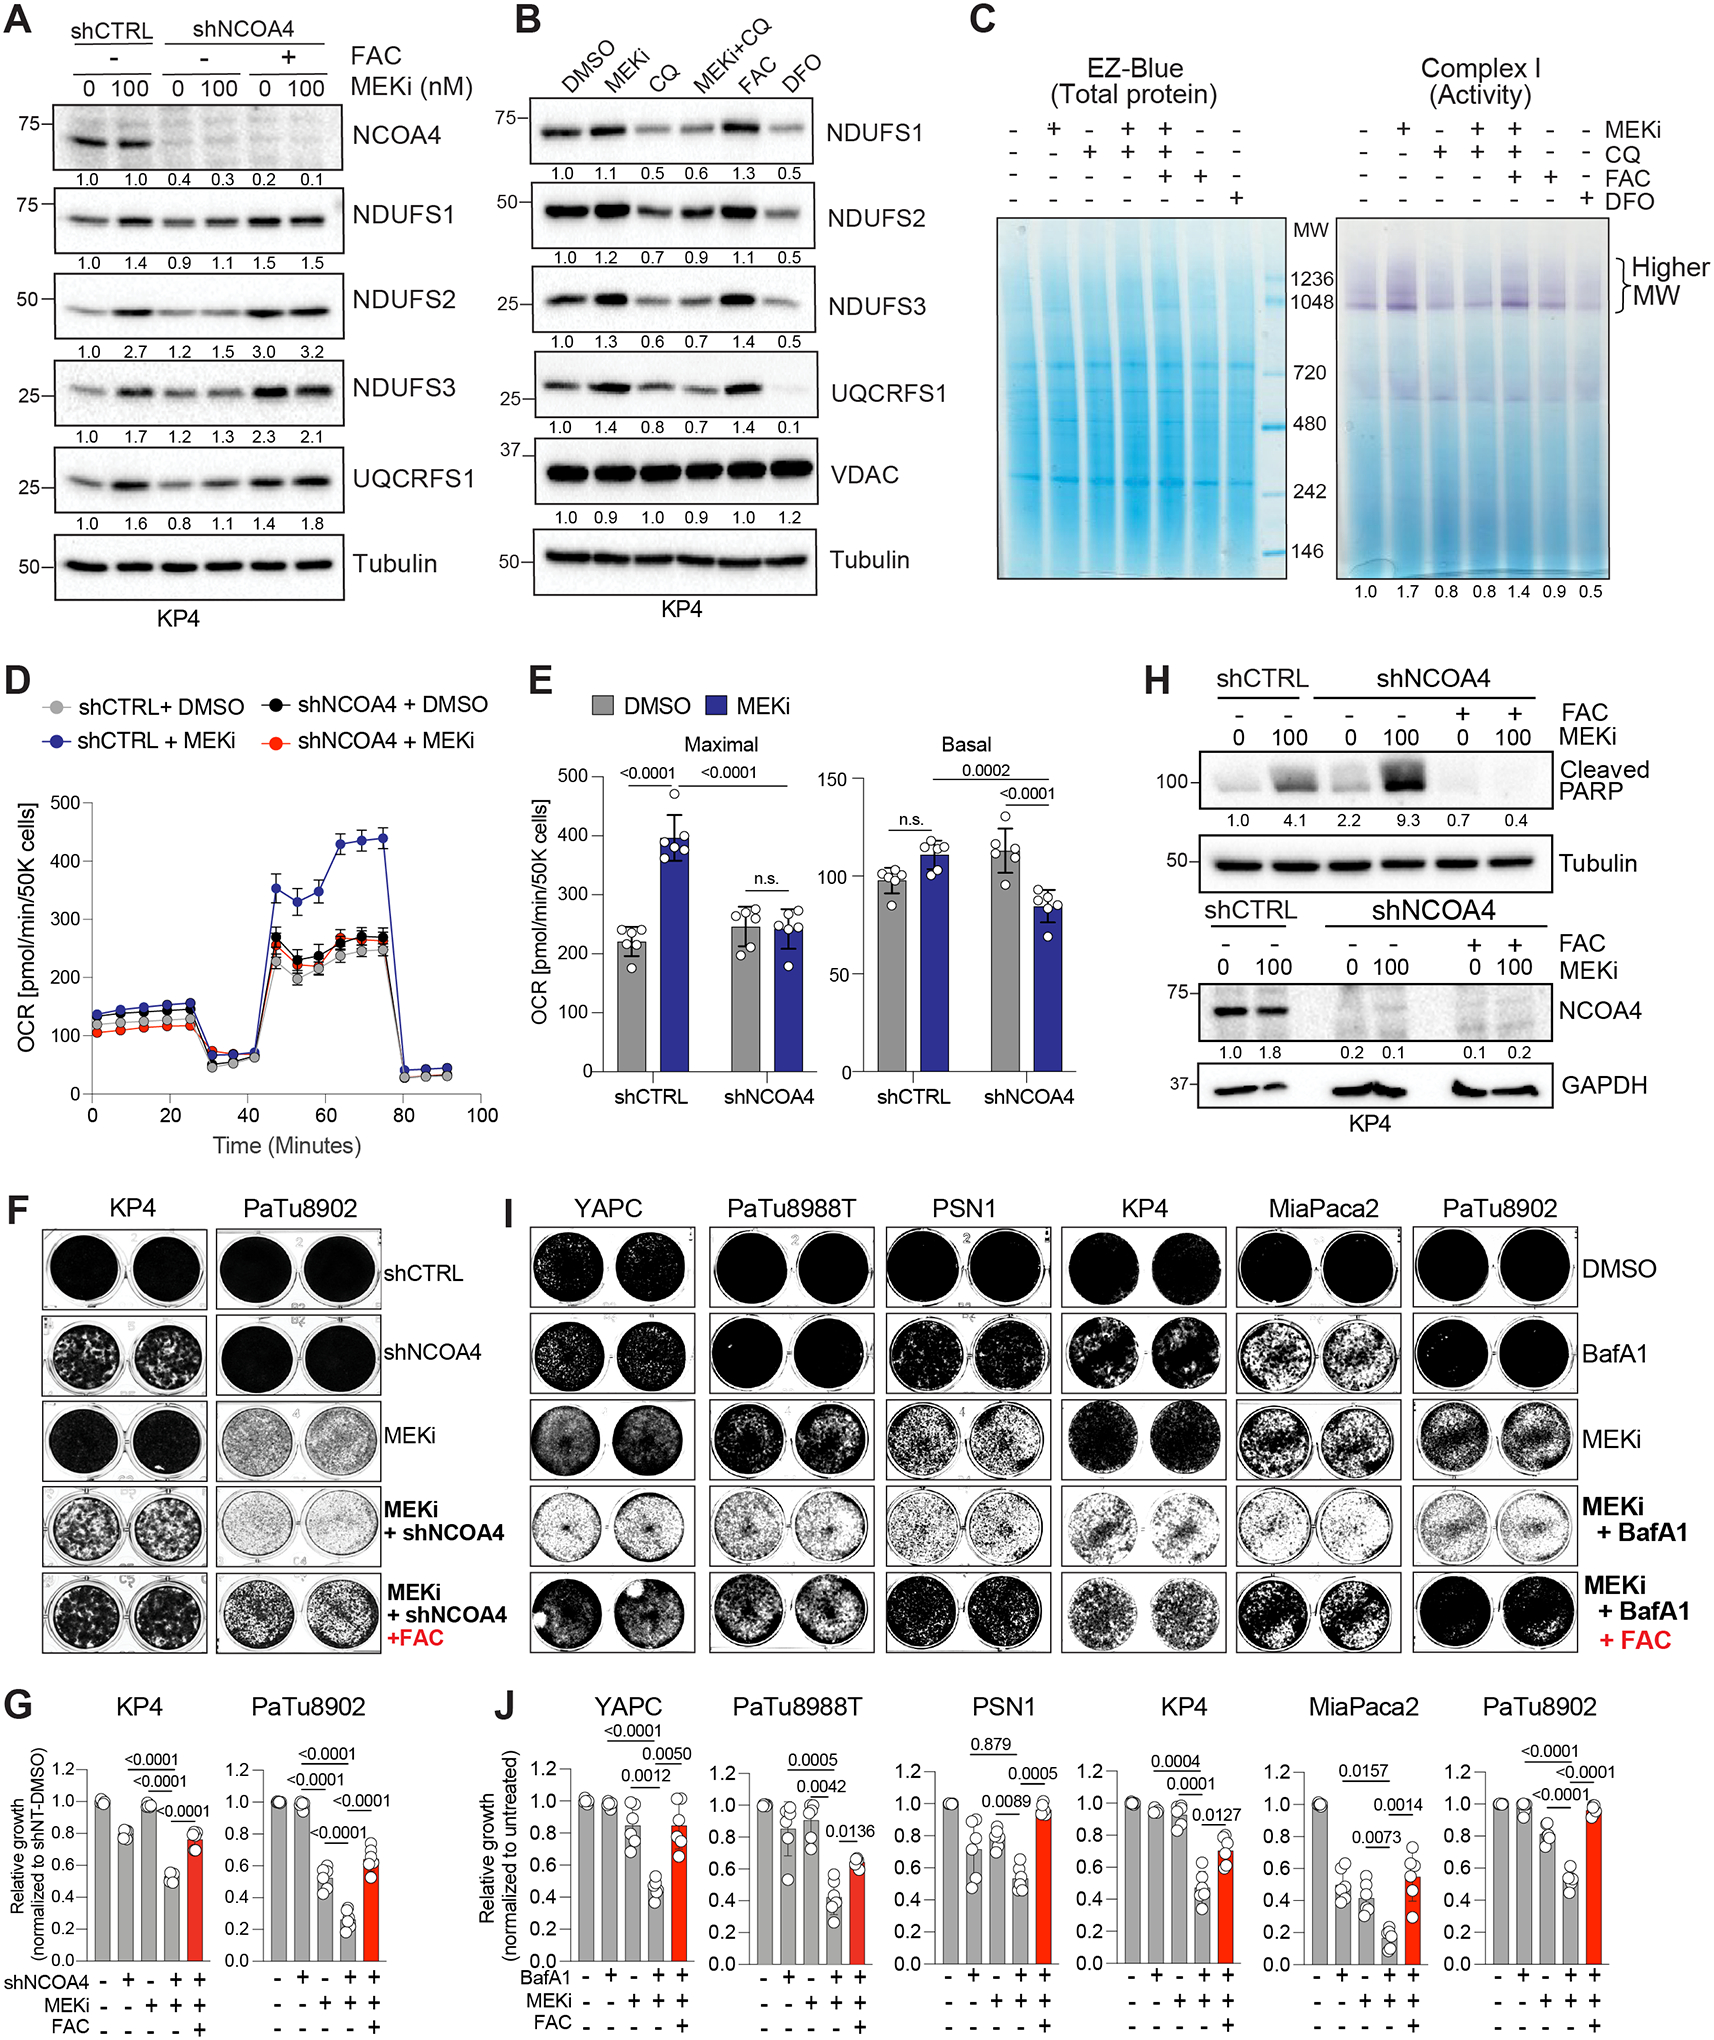
The mechanisms underlying metabolic adaptation of pancreatic ductal adenocarcinoma (PDA) cells to pharmacologic inhibition of RAS-MAPK signaling are largely unknown. Using transcriptome and chromatin immunoprecipitation profiling of PDA cells treated with the MEK inhibitor (MEKi) trametinib, we identify transcriptional antagonism between c-MYC and the master transcription factors for lysosome gene expression, the MiT/TFE proteins. Under baseline conditions, c-MYC and MiT/TFE factors compete for binding to lysosome gene promoters to fine-tune gene expression. Treatment of PDA cells or patient organoids with MEKi leads to c-MYC downregulation and increased MiT/TFE-dependent lysosome biogenesis. Quantitative proteomics of immunopurified lysosomes uncovered reliance on ferritinophagy, the selective degradation of the iron storage complex ferritin, in MEKi-treated cells. Ferritinophagy promotes mitochondrial iron-sulfur cluster protein synthesis and enhanced mitochondrial respiration. Accordingly, suppressing iron utilization sensitizes PDA cells to MEKi, highlighting a critical and targetable reliance on lysosome-dependent iron supply during adaptation to KRAS-MAPK inhibition.

Significance: Reduced c-MYC levels following MAPK pathway suppression facilitate the upregulation of autophagy and lysosome biogenesis. Increased autophagy-lysosome activity is required for increased ferritinophagy-mediated iron supply, which supports mitochondrial respiration under therapy stress. Disruption of ferritinophagy synergizes with KRAS-MAPK inhibition and blocks PDA growth, thus highlighting a key targetable metabolic dependency. See related commentary by Jain and Amaravadi, p. 2023. See related article by Santana-Codina et al., p. 2180. This article is highlighted in the In This Issue feature, p. 2007.


Figures

Figure 1:
Figure 1:. TFEB dependent transcriptional upregulation of autophagy and lysosome genes following RAS pathway inhibition.
A. Immunofluorescence staining of LC3B in human PDA cell lines following DMSO (left) or MEKi treatment for 48h (right). Scale, 20μm. B. Normalized log2 fold change in LC3B fluorescence intensity in the indicated cell lines treated in A measured from n = 10–14 fields per condition. C. Measurement of autophagy flux via flow cytometry using GFP-LC3-RFP-LC3ΔG reporter in the indicated cell lines following 48h treatment with DMSO or MEKi. D. Heatmap showing increased expression of lysosome genes in MEKi treated KP4 cells. Scale bar represents row z score calculated from log10 (FPKM). E. Top upregulated pathways identified (Hallmark and KEGG) using gene set enrichment analysis in KP4 cells treated with MEKi. Normalized enrichment score (NES). F. Gene set enrichment analysis of the autophagy-lysosome gene signature in MEKi treated KP4 cells G. Immunofluorescence staining of LAMP2 in human PDA cell lines following DMSO (left) or MEKi treatment (right). Scale, 20μm. H. Normalized log2 fold change of LAMP2 fluorescence intensity in the indicated cell lines treated in G measured from n = 10–14 fields per condition. I. RT-qPCR showing increased expression of TFEB mRNA in KP4 cells treated with MEKi relative to DMSO. J. Immunoblot for TFEB in the cytoplasmic and nuclear fractions of KP4 cells treated with DMSO or MEKi. Lamin A/C and GAPDH serve as loading controls for nuclear and cytoplasmic fractions respectively. K. RT-qPCR showing the effect of siRNA mediated TFEB knockdown on the expression of lysosome genes in DMSO or MEKi treated KP4 cells, displayed as fold change normalized to cells transfected with control siRNA treated with DMSO. L. RT-qPCR showing increased expression of TFEB and lysosomal genes following MEKi treatment (normalized to DMSO) from two independent patient PDA ex vivo organoid cultures. Data are the mean ± s.d. and P values were determined using an unpaired two-tailed Student’s t-test (B, C, H, I, L) and two-way ANOVA (K). MEKi treatment was 100nM for 48h.
Figure 2:
Figure 2:. Downregulation of MYC facilitates enhanced lysosome gene expression.
A. Heatmap showing decreased expression of MYC target genes in MEKi treated KP4 cells. Scale bar represents row z score calculated from log10 (FPKM). B. Top downregulated pathways (Hallmark and KEGG) identified using gene set enrichment analysis in KP4 cells treated with MEKi. C. Gene set enrichment analysis showing negative enrichment of MYC target genes in MEKi treated KP4 cells. Normalized enrichment score (NES). D. RT-qPCR showing decreased expression of MYC mRNA in KP4 (left) and MiaPaca2 (right) cells treated with MEKi relative to DMSO. E. Western blot analysis of MYC protein levels following MEKi treatment in the indicated cell lines. F. Immunofluorescence staining (left) and quantification (right) of MYC in KP4 cells following DMSO (top) or MEKi treatment (bottom). Arrowheads indicate examples of nuclear localization. Fluorescence intensity was quantified from 10–14 fields/condition. Scale, 20μm. G. Immunoblot for MYC in the cytoplasmic and nuclear fractions of KP4 cells treated with DMSO or MEKi. Lamin A/C and GAPDH serve as loading controls for nuclear and cytoplasmic fractions respectively. H. RT-qPCR analysis showing decreased expression of MYC and its target genes following MEKi treatment (normalized to DMSO) from two independent patient PDA ex-vivo organoid cultures. I. RT-qPCR showing the effect of siRNA mediated MYC knockdown on the expression of lysosome genes in DMSO or MEKi treated KP4 cells, displayed as fold change normalized to cells transfected with control siRNA treated with DMSO. Data are the mean ± s.d. and P values were determined using an unpaired two-tailed Student’s t-test (D, F, H) and two-way ANOVA (I). MEKi treatment was 100nM for 48h.
Figure 3:
Figure 3:. MEKi treatment induces changes in transcription factor occupancy at lysosome gene promoters.
A. Venn diagram showing unique and overlapping genes bound by TFE3 and MYC under baseline conditions in KP4 cells. B. KEGG pathway analysis of genes bound by TFE3 and MYC at baseline in KP4 cells. Note that ‘Regulation of autophagy’ and ‘Lysosome’ are two of the significantly enriched terms. C. Venn diagram (top) and list of lysosome genes (bottom) bound by TFE3 and MYC under baseline conditions. D. ChIP-seq tracks of MYC occupancy (top row: DMSO treated, bottom row: MEKi treated) at representative lysosome gene promoters. E. Profile plot showing ChIP-Seq read densities of MYC peaks in control and MEKi conditions on lysosomal gene promoters. F. ChIP-seq tracks of TFE3 occupancy (top row: DMSO treated, bottom row: MEKi treated) at representative lysosome gene promoters. G. Profile plot showing ChIP-Seq read densities of TFE3 peaks in control and MEKi conditions on lysosomal gene promoters. H. ChIP-qPCR showing increased TFE3 occupancy at the indicated lysosomal CLEAR promoters following MEKi treatment relative to DMSO treatment in KP4 cells. IgG serves as negative control for ChIP and Gene desert serves as negative control for TFE3 occupancy. I. KEGG pathway analysis of genes that are TFE3 direct targets (as determined by ChIP-seq) and upregulated in RNA-Seq analysis. Note that ‘Regulation of autophagy’ and ‘Lysosome’ are significantly enriched terms. J. Volcano plot showing the differential mRNA expression levels following MEKi treatment, of genes that are also direct targets of TFE3 (as determined by ChIP-seq). Data are plotted as log2 fold change (MEKi/DMSO) of gene expression in KP4 cells quantified using RNA-Seq versus −log10 of the P-value. Representative genes associated with the autophagy-lysosome pathway are indicated in red (see Table S3). K. Volcano plot of whole cell proteomics data from DMSO and MEKi treated KP4 cells. Data are plotted as log2 fold change (MEKi/DMSO) versus −log10 of the P-value. Proteins considered to be “MYC targets” and “MiT/TFE targets” are indicated in blue and red respectively (see Table S4). TSS; transcription start site. Data (H) are the mean ± s.d. and P values were determined using two-way ANOVA. MEKi treatment was 100nM for 48h.
Figure 4:
Figure 4:. Ferritinophagy is induced in response to MEKi treatment.
A. Schematic showing lysosome purification using affinity-based capture from KP4 cells stably expressing T192-mRFP-3xHA and treated with DMSO or MEKi. B. Volcano plot of lysosome proteomics data from KP4 cells expressing T192-mRFP-3xHA treated with DMSO or MEKi. Data are plotted as log2 fold change (MEKi/DMSO) versus −log10 of the p-value (see Table S5). Ferritin light chain (FTL) and Ferritin heavy chain (FTH1) are indicated in red. C. Average peptide counts for the indicated proteins from n=3 biological replicates per condition. D. Immunoblot for the indicated proteins in input and lysosomal fractions isolated from KP4 cells expressing T192-mRFP-3xHA and treated with DMSO or MEKi. Note the enrichment of FTH, FTL, NCOA4, and LC3B in the MEKi lysosome fraction. NPC1 and LAMP1 serve as loading controls while the absence of AIF, RCAS1 and PDI confirms organelle purity. FTH, FTL, NCOA4, and LC3B are also increased in the input indicating increased overall expression in MEKi-treated cells. E. Immuno-fluorescence staining of LAMP2 (red) and FTL (green) in KP4 cells following DMSO or MEKi treatment in the presence or absence of acute BafA1 treatment (500nM for 4h) to suppress lysosome degradation. Arrowheads in insets show increased colocalization of FTL and LAMP2 in cells co-treated with MEKi+BafA1. Scale, 20μm. F. Quantification of percentage colocalization between FTL and LAMP2 in cells in E. n=10–15 fields per condition. G. Live cell imaging of KP4 cells incubated with FerroOrange iron dye and treated with the indicated agents. H. Quantification of fluorescence intensity of images in G from n = 7–10 fields per condition. I. Immunoblot for total FTH1, FTL and NCOA4 in KP4 cells treated with the indicated concentrations of MEKi for 48h. J. Immunoblot for total FTH1 and FTL in KP4 cells treated with 1μM ERKi for 48h. K. Schematic (left) and immunoblot for the indicated proteins (right) of KP4 xenografts isolated from nude mice treated daily for 11 days with vehicle or MEKi (Trametinib 2mg/kg). L. Immunoblot for total Transferrin receptor (TfR1) and Ferroportin (FPN) in KP4 cells treated with DMSO or MEKi. M. Flow cytometry-based measurement of cell surface Transferrin receptor in KP4 cells treated with DMSO or MEKi. N. Uptake of fluorescently labeled Transferrin in KP4 cells treated with DMSO or MEKi. Data are the mean ± s.d. and P values were determined using an unpaired two-tailed Student’s t-test (F, M, N) and one-way ANOVA (H). MEKi treatment was 100nM for 48h unless otherwise indicated.
Figure 5:
Figure 5:. Mitochondrial iron-sulfur cluster protein levels, complex activity and respiration is increased in response to MEK inhibition.
A. Volcano plot (shown also in figure 3K) of whole cell proteomics data from DMSO and MEKi treated KP4 cells. Data are plotted as log2 fold change (MEKi/DMSO) versus −log10 of the P-value. Iron-sulfur cluster (ISC) proteins specific to mitochondria (red), cytosol (orange) or nucleus (blue) are indicated. B. Immunoblot for mitochondrial ISC proteins in KP4 cells following treatment with the indicated concentrations of MEKi. C. Blue native PAGE analysis of purified mitochondrial fractions from KP4 cells treated with DMSO or MEKi showing the presence of ISC proteins in higher molecular weight structures. EZ blue staining on the left serves as the loading control. D. In-gel activity assay for Complex I activity in purified mitochondria from KP4 cells treated with DMSO or MEKi. Darker purple stain indicates complex activity. Quantification of activity from n=3 biological replicates normalized to control is shown at right. E. Activity of the ISC protein Aconitase 2 in KP4 cells treated with DMSO or MEKi normalized to total protein. F. Oxygen consumption rate of individual mitochondrial respiratory complex (complexes I-III and II-III) measured in the presence or absence of MEKi treatment in KP4 cells. G. Oxygen consumption rate of mitochondrial respiratory complex using seahorse in KP4 cells treated with DMSO or MEKi. H. Basal and maximal oxygen consumption rate in KP4 cells treated with DMSO or MEKi. Data are the mean ± s.d. and P values were determined using an unpaired two-tailed Student’s t-test. MEKi treatment was 100nM for 48h.
Figure 6:
Figure 6:. Blockade of ferritinophagy or the lysosome impairs mitochondrial activity and cell viability
A. Immunoblot of the indicated proteins following shRNA mediated knockdown of NCOA4 in the presence or absence of MEKi or exogenous iron (FAC,150μM). B. Immunoblot of the indicated ISC proteins and VDAC following 48h treatment with Chloroquine (CQ, 12.5μM) in the presence or absence of MEKi (100nM). Treatment with exogenous iron (FAC, 150μM) or an iron chelator (DFO, 300μM) serve as positive and negative controls, respectively. C. Complex I in-gel activity assay from purified mitochondria isolated from KP4 cells treated with the indicated agents for 48h. Darker purple stain indicates higher complex activity. EZ-Blue staining (left) serves as loading control. D. Measurement of oxygen consumption rate following shRNA mediated knockdown of NCOA4 in KP4 cells treated with DMSO or MEKi. E. Basal and maximal oxygen consumption rates from the experiment in D. F, G. Crystal violet stain (F) and quantification (G) of proliferation of the indicated cell lines following shRNA mediated knockdown of NCOA4 treated with MEKi, MEKi+FAC. H. Immunoblot of the indicated proteins following shRNA mediated knockdown of NCOA4 in the presence or absence of MEKi and following addition of exogenous iron (FAC, 150μM). I, J. Crystal violet stain (I) and quantification (J) of proliferation of the indicated cell lines following treatment with MEKi, BafA1, MEKi+BafA1 or MEKi+BafA1+FAC. Data are the mean ± s.d (E,G,J) and SEM (D). P values were determined using an unpaired two-way ANOVA (E), one-way ANOVA (G, J). MEKi treatment was 100nM for 48h.
Figure 7:
Figure 7:. Activation of autophagy-lysosome signatures occur broadly in response to stress and is anti-correlated with MYC activity.
A, B. Top upregulated pathways (Hallmark and KEGG) identified using gene set enrichment analysis of RNA-seq data obtained from HCT116 cells treated with DMSO and MEKi (30nM) for 8 weeks (GSE118490) (A) and NSCLC cell lines (A549, H2030, H460) treated with DMSO and MEKi (25nM) for 8 days (GSE110397) (B). C. Pearson correlation analysis of MYC (MYC_score) and MiT/TFE (Lyso_score) signatures in TCGA datasets from the indicated cancers. PAAD (n=111), COAD (n=171) and NSCLC (n=156) KRAS mutant tumors. D. Violin plots depicting the distribution of MYC_score associated with high and low Lyso_score of the TCGA datasets used in C. E. Model depicting the interplay between transcriptional and catabolic pathways in mediating adaptation to MAPK pathway suppression. Competition between MYC and MiT/TFE TFs for binding to autophagy and lysosome gene promoters regulates the magnitude of gene expression in PDA. Dysregulation of MYC, following MAPK suppression enables enhanced MiT/TFE-mediated induction of the autophagy-lysosome gene program. Enhanced pathway activity serves to maintain iron homeostasis important for mitochondrial respiration. P values were determined using an unpaired two-tailed Student’s t-test.

Comment in

Comment on

References

    1. Moore AR, Rosenberg SC, McCormick F, Malek S. RAS-targeted therapies: is the undruggable drugged? Nat Rev Drug Discov 2020;19: 533–52. - PMC - PubMed
    1. Papke B, Der CJ. Drugging RAS: Know the enemy. Science 2017;355: 1158–63. - PubMed
    1. Collins MA, Bednar F, Zhang Y, Brisset JC, Galban S, Galban CJ, et al. Oncogenic Kras is required for both the initiation and maintenance of pancreatic cancer in mice. J Clin Invest 2012;122: 639–53. - PMC - PubMed
    1. Collisson EA, Trejo CL, Silva JM, Gu S, Korkola JE, Heiser LM, et al. A central role for RAF-->MEK-->ERK signaling in the genesis of pancreatic ductal adenocarcinoma. Cancer Discov 2012;2: 685–93. - PMC - PubMed
    1. Ying H, Kimmelman AC, Lyssiotis CA, Hua S, Chu GC, Fletcher-Sananikone E, et al. Oncogenic Kras maintains pancreatic tumors through regulation of anabolic glucose metabolism. Cell 2012;149: 656–70. - PMC - PubMed

Publication types

MeSH terms