. 2022 Jun 30;17(6):e0270457.
doi: 10.1371/journal.pone.0270457. eCollection 2022.

How emotional changes affect skin odor and its impact on others

Affiliations

How emotional changes affect skin odor and its impact on others

Masako Katsuyama et al. PLoS One. .

Abstract

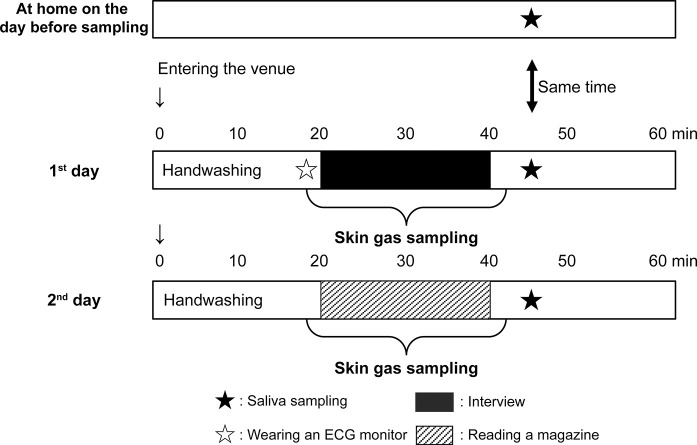
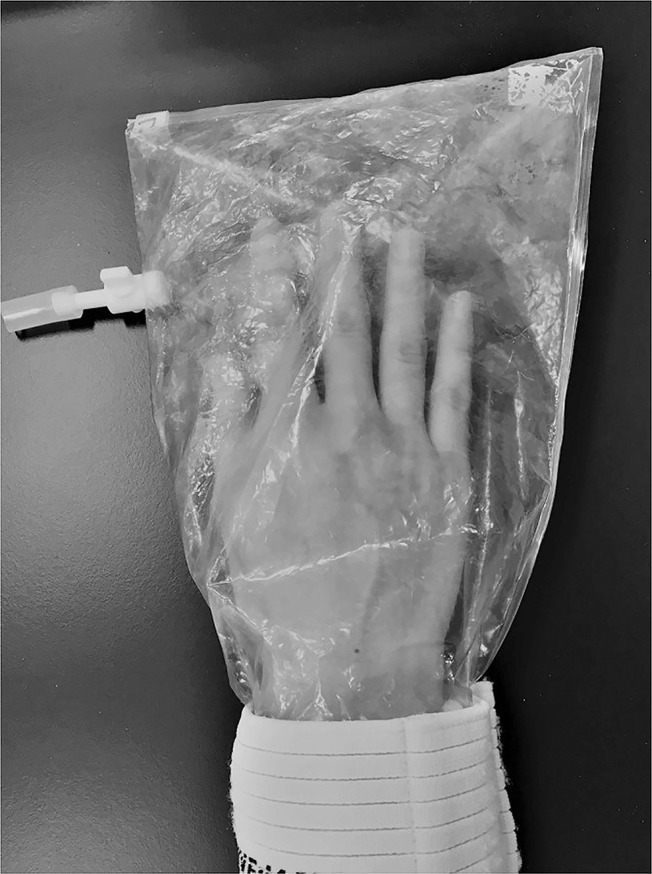
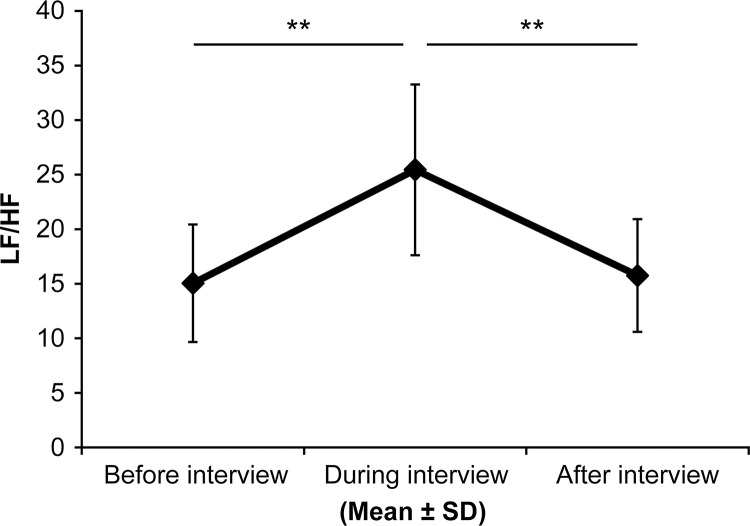
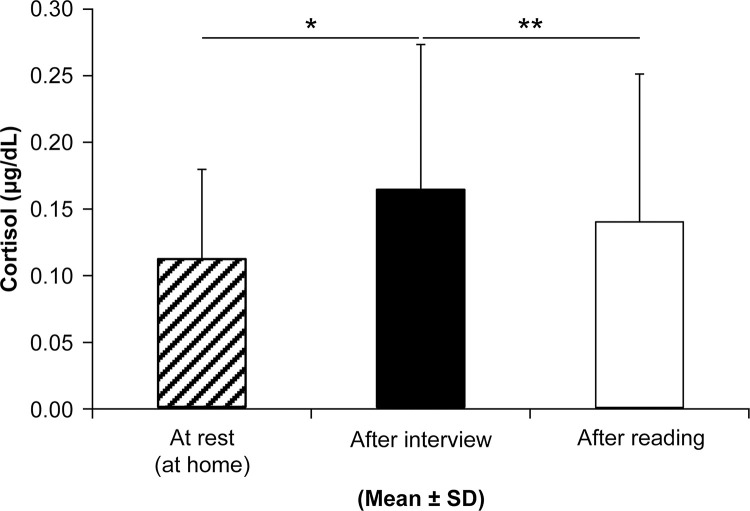
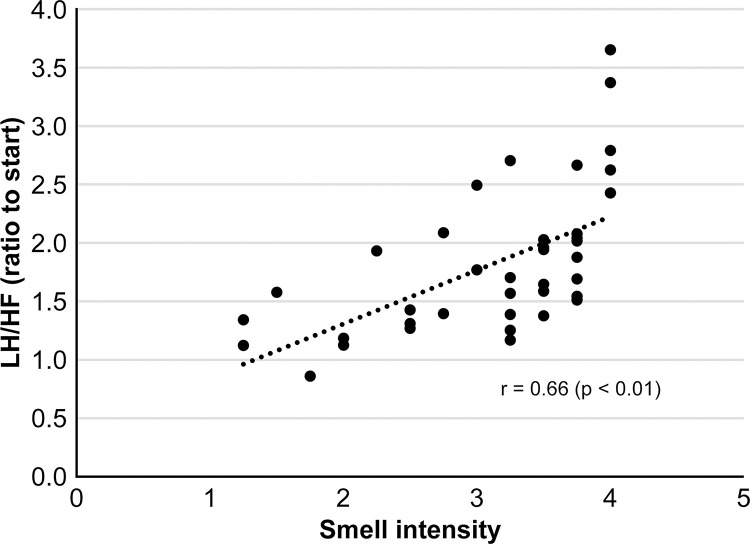
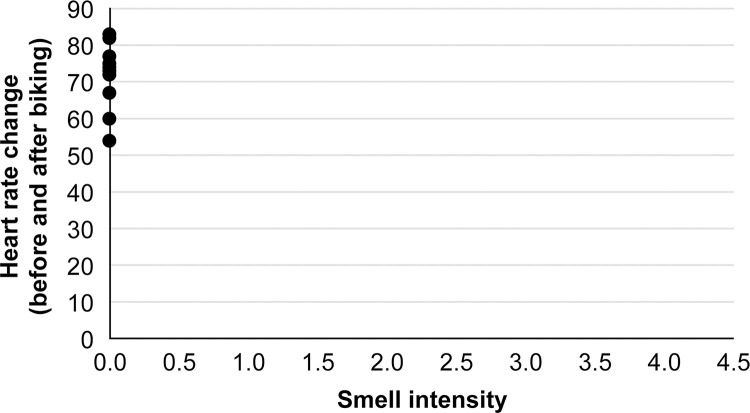
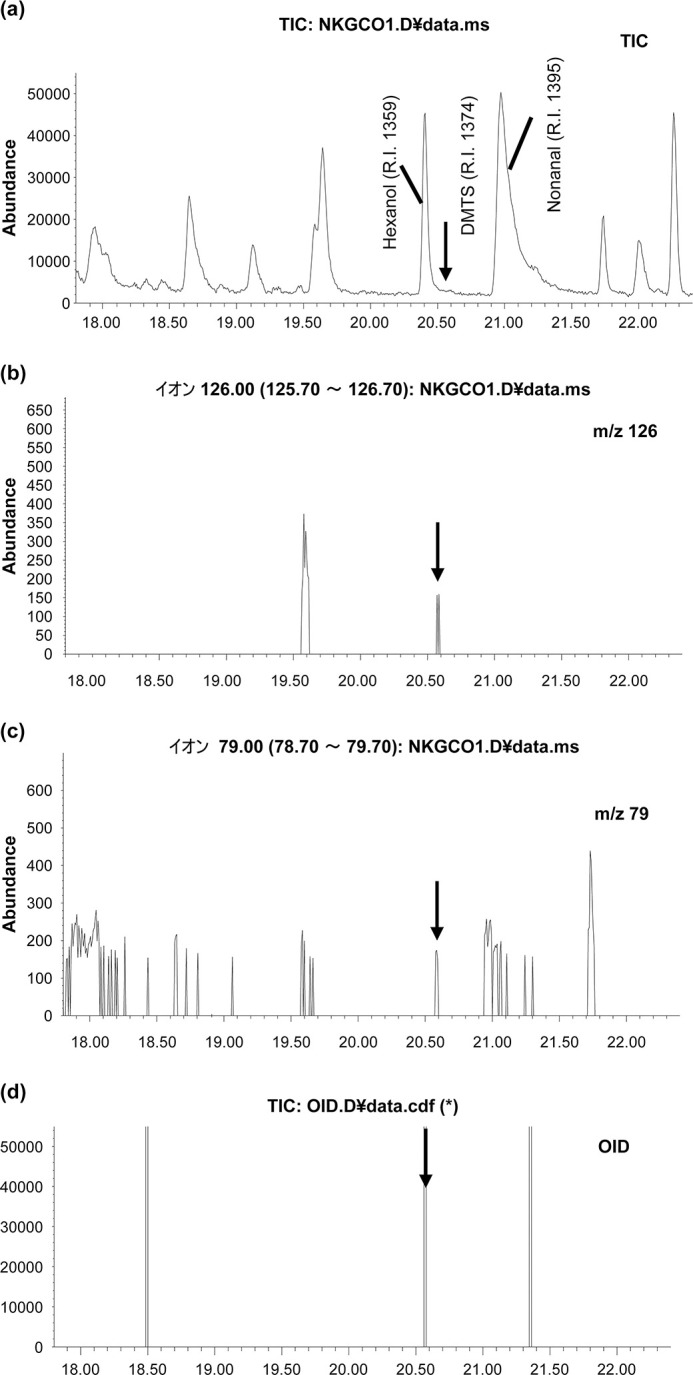
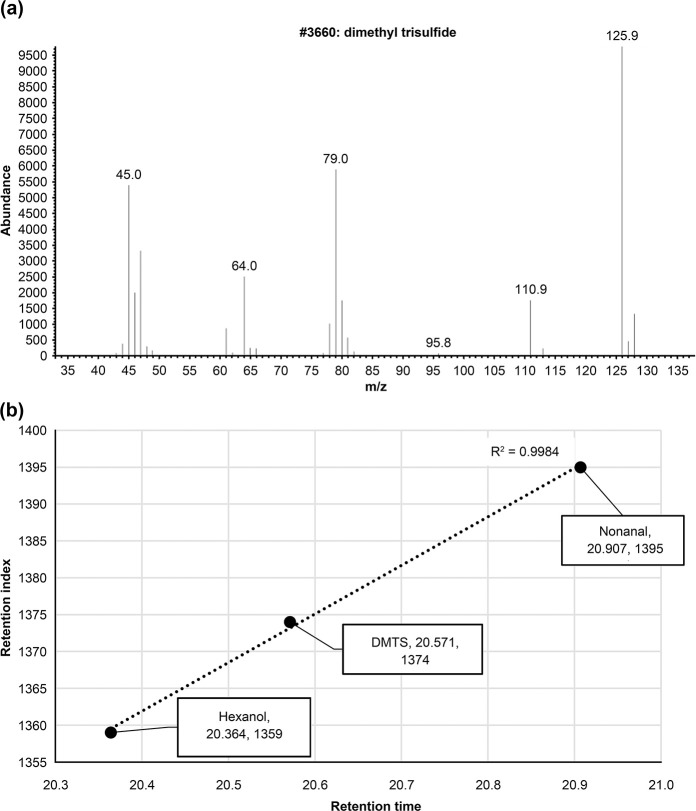
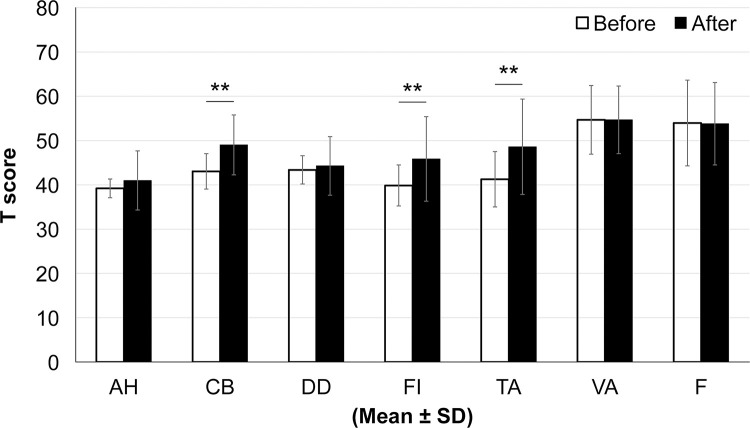
The gas emanating from human skin is known to vary depending on one's physical condition and diet. Thus, skin gas has been gaining substantial scholarly attention as an effective noninvasive biomarker for understanding different physical conditions. This study focuses on the relationship between psychological stress and skin gas, which has remained unclear to date. It has been deduced that when participants were subjected to interviews confirmed as stressful by physiological indicators, their skin emitted an odor similar to stir-fried leeks containing allyl mercaptan and dimethyl trisulfide. This characteristic, recognizable odor appeared reproducibly during the stress-inducing situations. Furthermore, the study deduced that individuals who perceive this stress odor experience subjective tension, confusion, and fatigue (Profile of Mood States scale). Thus, the study findings indicate the possibility of human nonverbal communication through odor, which could enhance our understanding of human interaction.


Conflict of interest statement

The authors have declared that no competing interests exist.

Figures

Fig 1
Fig 1. Effects of tension on skin gases.
Skin-gas samples were collected from each subject in two situations: under stress (answering questions for 20 min from an interviewer whom they did not know) and at rest (sitting on a chair and relaxing while reading a magazine on a different day). Subjects washed their hands with unscented soap before sampling. The electrocardiographic activity was measured continuously by an ECG monitor (Ledar Circ, Sumitomo Dainippon Pharmaceutical). Saliva samples were collected three times. The first measurement refers to samples collected as a baseline while the subjects were at home resting during the same time frame as that of the interview but on a different day. The second sample was collected after the interview, and the third one was collected after the subjects had read a magazine.
Fig 2
Fig 2. Collection bag for skin gas emanating from subjects’ hands.
Hands washed with unscented soap were covered with sampling bags made from a fluorinated ethylene-propylene copolymer material. The air inside was replaced with nitrogen and recovered after a certain period.
Fig 3
Fig 3. Autonomic nervous system activity during a stress-inducing interview.
The R wave intervals for the heart rate were calculated using electrocardiogram data. The high frequency intensity levels (HF, 0.2 to 2 Hz range) and low frequency (LF, 0.04 to 0.15 Hz range) components were identified. The LF/HF components were calculated using the activity index of the sympathetic nervous system. The LF/HF values collected during the interview were significantly higher than that of the previous and subsequent measurements, which indicates that the sympathetic nervous system was dominant (**p < 0.01 after Bonferroni correction).
Fig 4
Fig 4. Salivary cortisol measurements.
Saliva was collected three times. The first sample was collected within the same time frame as that of the interview but on a different day while the subjects were at home resting. The second sample was collected after the interview, and the third one was collected after the subjects had read a magazine. Salivary cortisol levels after the interview were significantly higher than those at baseline (*p < 0.05) and those while the subjects were reading (**p < 0.01, after Bonferroni correction).
Fig 5
Fig 5. Relationship between the intensity of tension-stress odor and autonomic nervous activity during the interview.
A panel of four odor experts evaluated the collected skin-gas samples to compare differences between those emanated during stress and at baseline. From all interview samples, we discovered a characteristic odor resembling stir-fried leek. The intensity of this characteristic odor was positively correlated with the rate of increase in sympathetic nerve activity during the interview compared with before the interview (Spearman’s correlation coefficient: r = 0.66 (p < 0.01)).
Fig 6
Fig 6. Relationship between the intensity of tension-stress odor during exercise and changes in heart rate.
A panel of four scent experts evaluated the collected skin-gas samples to identify odor differences among individuals exercising and at rest. No characteristic odor resembling stir-fried leek was observed in any samples when the heart rate increased because of exercise.
Fig 7
Fig 7. Results of analysis GC-O.
A sample during a tension interview showed a peak that was close to the characteristic odor with a retention time (RT) = 20.571 minutes. Moreover, standard DMTS was detected at RT = 20.571 minutes. (a, d). At the peak of RT = 20.571 min, these ions were detected by extracting mass chromatograms with m/s = 126 and 79 as a feature of DMTS (b, c).
Fig 8
Fig 8. Mass pattern of DMTS and correlations RT and RI.
Hexanol and nonanal were detected around the peak of RT = 0.20.571. The correlation between these RTs and the coefficient of determination (RI) of the three components registered in the MS Private Library Database of Takata Koryo Co., Ltd. was R2 = 0.9984 (b).
Fig 9
Fig 9. Selected ion monitoring (SIM) chromatograms according to allyl mercaptan (AM) (m/z74).
The peak in each skin-gas sample collected during the stress interview (b, c) was detected at the same RT as that of AM, and the peak intensity of the skin-gas was higher than 2.5 ng/L and lower than 12.5 ng/L. (a): The control skin-gas without the characteristic odor representative of skin-gas with the characteristic odor; (b),(c): collected during the stress interview (panels #1 and #2), (d): Nitrogen gas containing AM (2.5 ng/L); (e): Nitrogen gas containing AM (12.5 ng/L).
Fig 10
Fig 10. Subjective effects of the tension odor.
The model tension odor, formulated according to the threshold, was continuously sniffed by participants for 2 min. POMS 2 measured the participants’ subjective status at baseline and immediately after sniffing the sample. Note: AH: anger–hostility, CB: confusion–bewilderment, DD: depression–dejection, FI: fatigue–inertia, TA: tension–anxiety, VA: vigor–activity, and F: friendliness. The negative scores of “tension–anxiety” (p < 0.01), “confusion–bewilderment” (p < 0.01), and “fatigue–inertia” (p < 0.01) significantly increased after sniffing the model tension odor (Wilcoxon’s signed-rank test).

References

    1. Kanda F, Yagi E, Fukuda M, Nakajima K, Ohta T, Nakata O. Elucidation of chemical compounds responsible for foot malodor. Br. J. Dermatol. 1990;122:771–776. doi: 10.1111/j.1365-2133.1990.tb06265.x - DOI - PubMed
    1. Haze S, Gozu Y, Nakamura S, Kohno Y, Sawano K, Ohta H, et al.. 2-nonenal newly found in human body odor tends to increase with aging. J. Invest. Dermatol. 2001;116:520–524. doi: 10.1046/j.0022-202x.2001.01287.x - DOI - PubMed
    1. Tsuda T, Ohkuwa T, Itoh H. Findings of skin gases and their possibilities in healthcare monitoring. Gas. Biol. Res. Clin. Pract. 2011;125–132.
    1. Iitani K, Hayakawa Y, Toma K, Arakawa T, Mitsubayashi K. Switchable sniff-cam (gas-imaging system) based on redox reactions of alcohol dehydrogenase for ethanol and acetaldehyde in exhaled breath. Talanta. 2019;197:249–256. doi: 10.1016/j.talanta.2018.12.070 - DOI - PubMed
    1. Arakawa T, Aota T, Iitani K, Toma K, Iwasaki Y, Mitsubayashi K. Skin ethanol gas measurement system with a biochemical gas sensor and gas concentrator toward monitoring of blood volatile compounds. Talanta. 2020;219:1–7. doi: 10.1016/j.talanta.2020.121187 - DOI - PubMed