. 2022 Jun 30;17(6):e0270559.
doi: 10.1371/journal.pone.0270559. eCollection 2022.

A computational model of rabbit geometry and ECG: Optimizing ventricular activation sequence and APD distribution

Affiliations

A computational model of rabbit geometry and ECG: Optimizing ventricular activation sequence and APD distribution

Robin Moss et al. PLoS One. .

Abstract

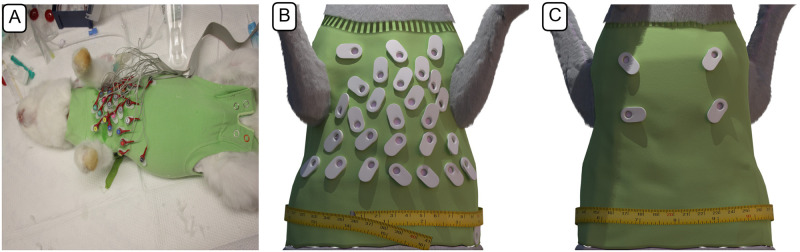
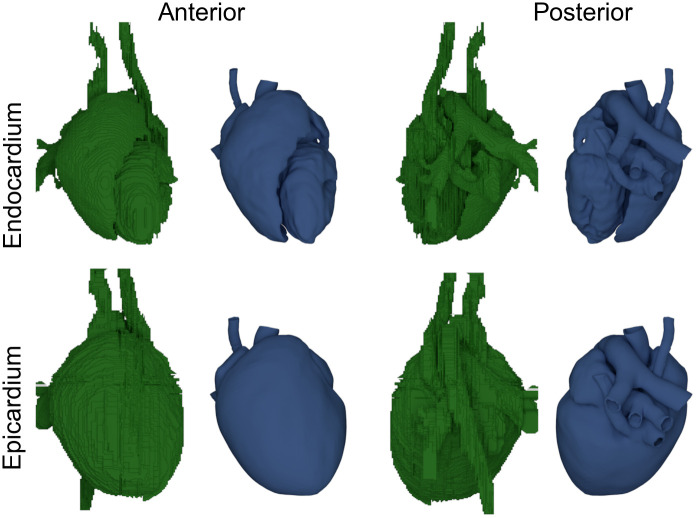
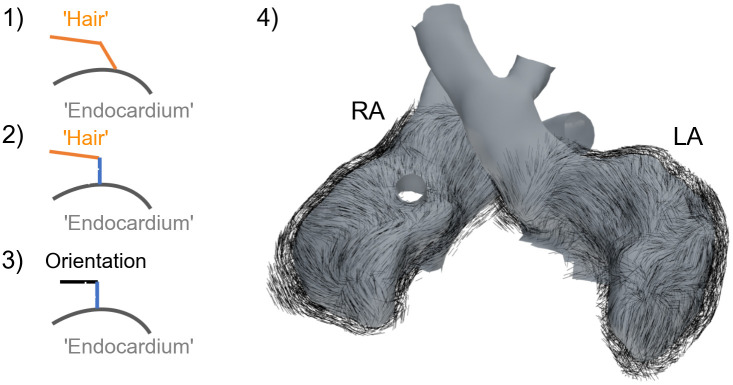
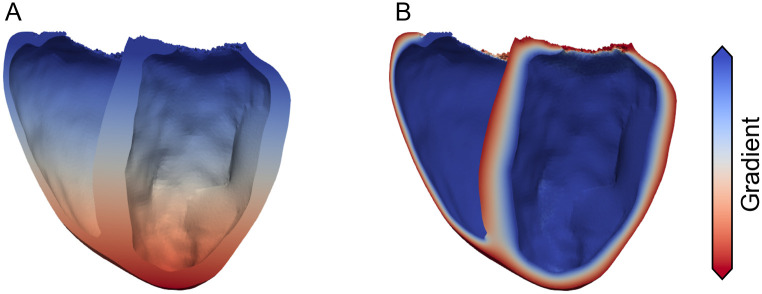
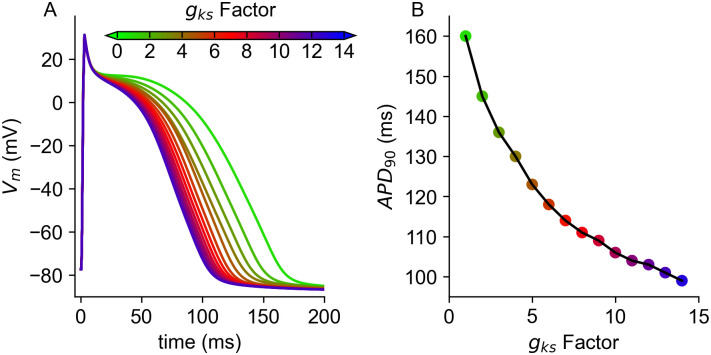
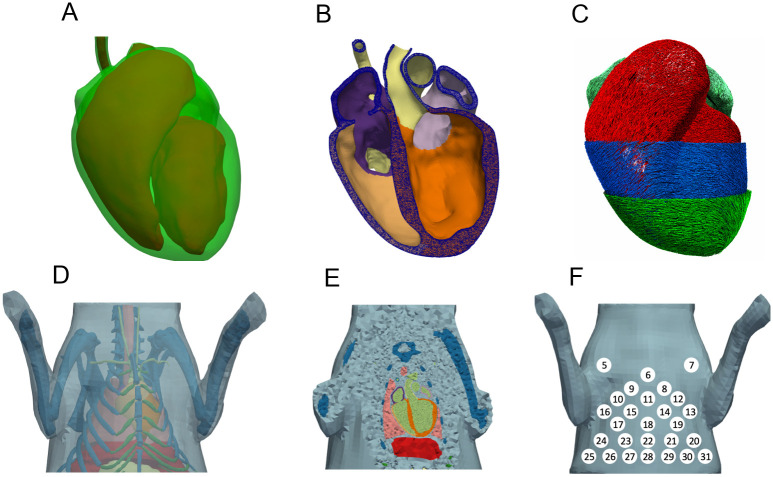
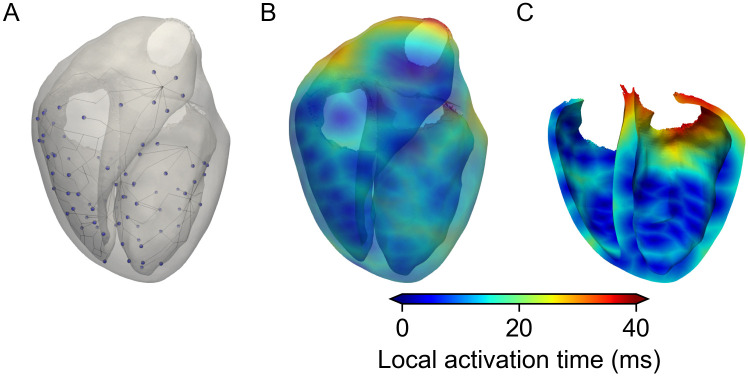
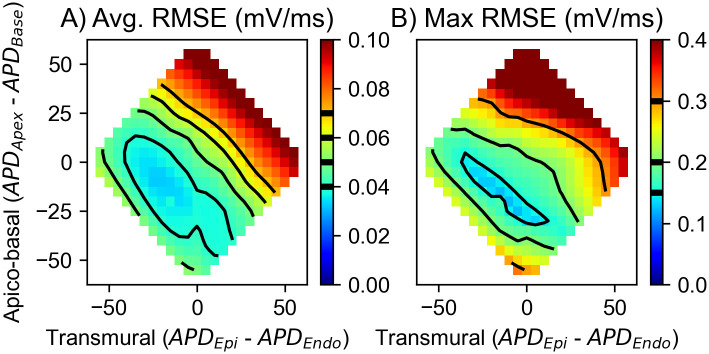
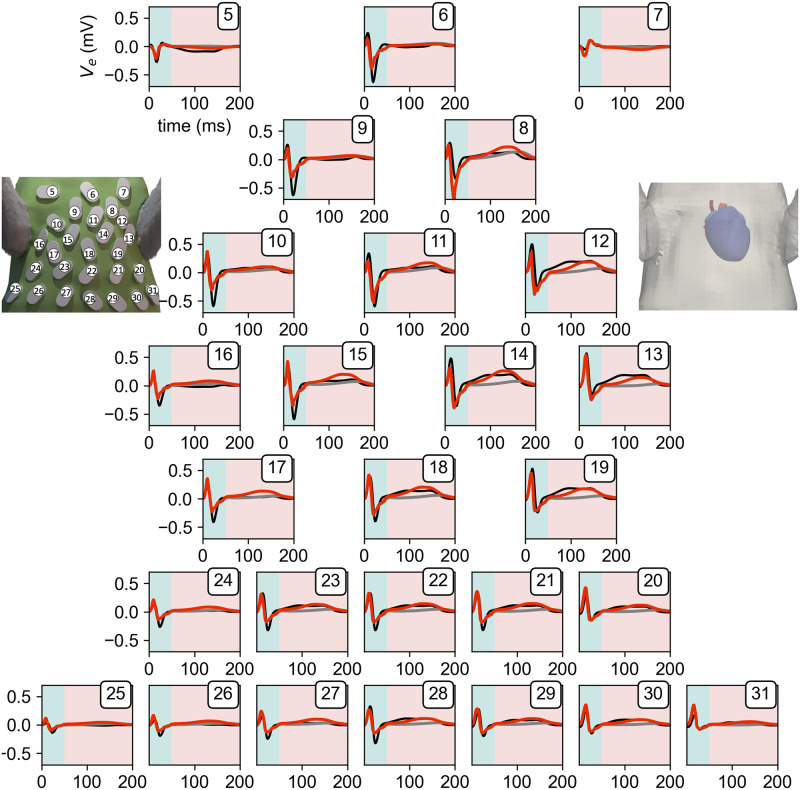
Computational modeling of electrophysiological properties of the rabbit heart is a commonly used way to enhance and/or complement findings from classic lab work on single cell or tissue levels. Yet, thus far, there was no possibility to extend the scope to include the resulting body surface potentials as a way of validation or to investigate the effect of certain pathologies. Based on CT imaging, we developed the first openly available computational geometrical model not only of the whole heart but also the complete torso of the rabbit. Additionally, we fabricated a 32-lead ECG-vest to record body surface potential signals of the aforementioned rabbit. Based on the developed geometrical model and the measured signals, we then optimized the activation sequence of the ventricles, recreating the functionality of the Purkinje network, and we investigated different apico-basal and transmural gradients in action potential duration. Optimization of the activation sequence resulted in an average root mean square error between measured and simulated signal of 0.074 mV/ms for all leads. The best-fit T-Wave, compared to measured data (0.038 mV/ms), resulted from incorporating an action potential duration gradient from base to apex with a respective shortening of 20 ms and a transmural gradient with a shortening of 15 ms from endocardium to epicardium. By making our model and measured data openly available, we hope to give other researchers the opportunity to verify their research, as well as to create the possibility to investigate the impact of electrophysiological alterations on body surface signals for translational research.


Conflict of interest statement

The authors have declared that no competing interests exist.

Figures

Fig 1
Fig 1. Rabbit 32-lead ECG-vest.
A: 32-lead ECG-vest designed to record body surface potentials on the rabbit torso in practical use; B: Rendered illustration of the vest from the anterior side; C: posterior view.
Fig 2
Fig 2. Surfaces of the initial segmented heart (green) and the resulting processed smoothed surfaces (blue).
Anterior and posterior view of the initially segmented surfaces (using Seg3D2 [17]) of endo-, and epicardium and the resulting retopologized smooth surfaces (using Blender [18] and InstantMeshes [19]).
Fig 3
Fig 3. Workflow to generate atrial myocyte orientation.
Using a hair particle system with two segments (2 line elements) in Blender [18], the hair was groomed to visually recreate the myocyte orientation published by Kharche et al. [25], step 1. Then the segment connected to the endocardial surface is corrected to be in normal direction, step 2. By assuming that the myocyte sheet direction is in parallel and the sheet-normal direction is in normal direction in respect to the endocardial surface, we can correct the second segment such that it is orthogonal to the other two directions, step 3. Finally, the segment connected to the endocardial surface is removed, leaving the second segment depicting the myocyte orientation (not defined for vessels), step 4.
Fig 4
Fig 4. Transmural and apico-basal gradients.
Transmural (A) and apico-basal (B) gradient used to define different gradients in APD. The gradients were flipped for respective APD lengthening; meaning that for example for a shortening in APD from base towards apex, blue represents 0 ms and red the APD shortening; for a shortening towards the base (i.e. a lengthening towards apex), blue would represent the APD shortening and red 0 ms.
Fig 5
Fig 5. Action potential and APD90 in relation to gks conductivity.
Resulting action potentials (A) in relation to different factors of gks (gksFac) and resulting APD at 90% repolarization.
Fig 6
Fig 6. Heart and Torso surfaces and geometry.
A: Surfaces of the endocardium (red, solid) and epicardium (green, transparent) of the heart. B: Open cut through meshed (tetrahedral) geometry of the heart. C: Representation of cardiomyocyte orientation of the heart, with the ventricles being visualized on endo-, mid-, and epicardial areas. D: Surface of the rabbit torso and all its organs (Light-blue: fat, Dark-blue: bones, Dark-green: cartilage; Salmon: lungs, Red: liver; Light-green: blood, Light-yellow: stomach). E: Open cut through the meshed geometry of the torso. F: Location of the ECG-Leads on the ventral side of the rabbit vest (5–31).
Fig 7
Fig 7. Optimized activation sequence and local activation times.
A: Resulting optimized Purkinje tree used to generate activation times within the ventricles. B: Local activation times throughout the ventricles. C: Cut view of the ventricles showing the initial activation at the septum. Due to the small size of the ventricles and the high velocity within the Purkinje network of 3655mm/s, all stimulation points activate roughly synchronously.
Fig 8
Fig 8. Resulting mean and maximum RMSE of all leads.
Resulting mean error of all leads (A) and maximum occurring RMSE error across all leads (B). As the mean error in (A) on its own does not provide a clear global minimum across all combinations of APD gradients, we looked further into maximum occurring error in (B).
Fig 9
Fig 9. Resulting measured and simulated lead signals.
Measured (black), simulated without any gradient (gray), and best simulated gradient (red) signal of body surface potential traces for Lead5Lead31 (Lead1Lead4, Lead32 not shown). The simulated traces where scaled as described in the methods section. Turquoise background indicates the QRS-Complex (1–50 ms) and salmon the T-Wave (50–200 ms). Each subplot is labeled by the respective lead number on the top right corresponding to its placement seen in the left image of the ECG-vest. The displayed simulated trace incorporates a gradient in APD of a shortening towards the apex of 20 ms and a shortening towards the epicardium of 15ms. This results in an overall average RMSE of the leads during the QRS-Complex of 0.074 mV/ms and 0.038 mV/ms during the T-Wave part.

Similar articles

References

    1. Nerbonne JM. Molecular basis of functional voltage-gated K+ channel diversity in the mammalian myocardium. Journal of Physiology. 2000;525:285–298. doi: 10.1111/j.1469-7793.2000.t01-1-00285.x - DOI - PMC - PubMed
    1. Keller DUJ, Weiss DL, Dössel O, Seemann G. Influence of IKs heterogeneities on the genesis of the T-wave: A computational evaluation. IEEE Transactions on Biomedical Engineering. 2012;59(2):311–322. doi: 10.1109/TBME.2011.2168397 - DOI - PubMed
    1. Gillette K, Gsell MAF, Prassl AJ, Karabelas E, Reiter U, Reiter G, et al.. A Framework for the generation of digital twins of cardiac electrophysiology from clinical 12-leads ECGs. Medical Image Analysis. 2021;71. doi: 10.1016/j.media.2021.102080 - DOI - PubMed
    1. Potse M. Mathematical modeling and simulation of ventricular activation sequences: Implications for cardiac resynchronization therapy. Journal of Cardiovascular Translational Research. 2012;5(2):146–158. doi: 10.1007/s12265-011-9343-6 - DOI - PMC - PubMed
    1. Vetter FJ, Mcculloch AD. Three-dimensional analysis of regional cardiac function: a model of rabbit ventricular anatomy. Progress in Biophysics & Molecular Biology. 1998;69(2):157–183. doi: 10.1016/S0079-6107(98)00006-6 - DOI - PubMed

Publication types