. 2022 Jul;377(6601):56-62.
doi: 10.1126/science.abm1741. Epub 2022 Jun 30.

Conservation and divergence of cortical cell organization in human and mouse revealed by MERFISH

Affiliations

Conservation and divergence of cortical cell organization in human and mouse revealed by MERFISH

Rongxin Fang et al. Science. 2022 Jul.

Abstract

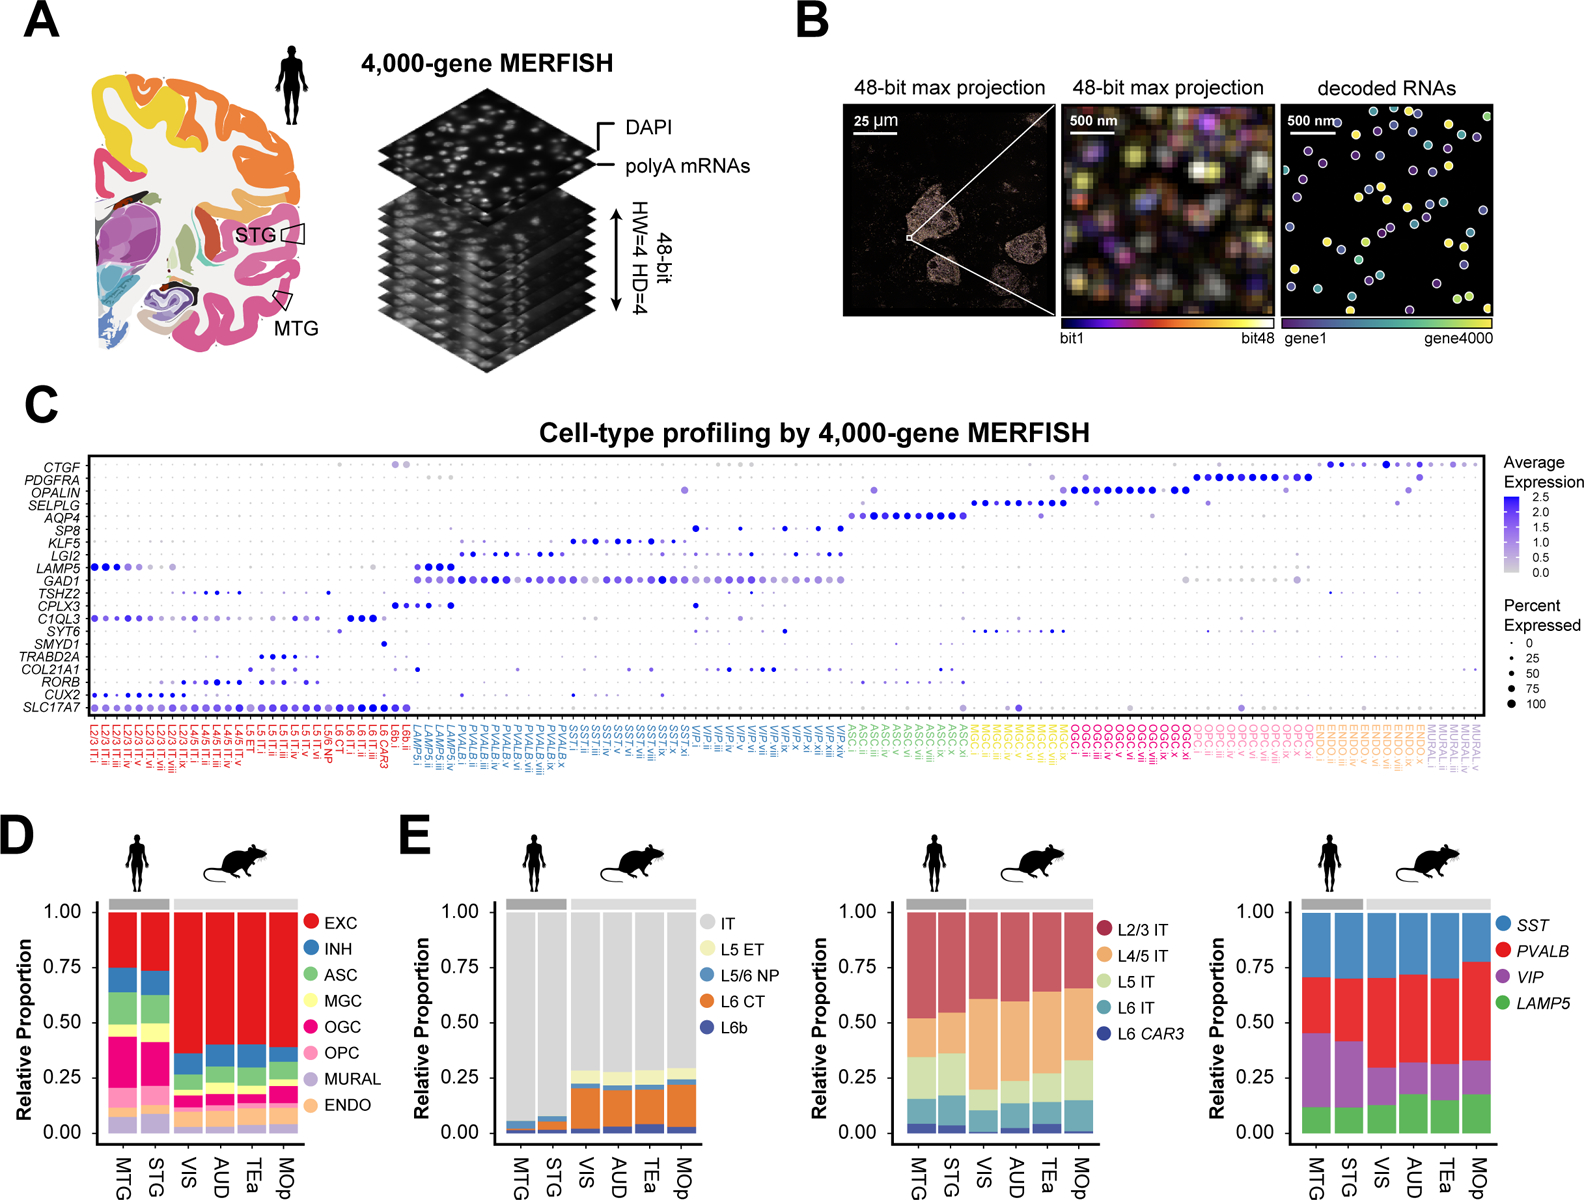
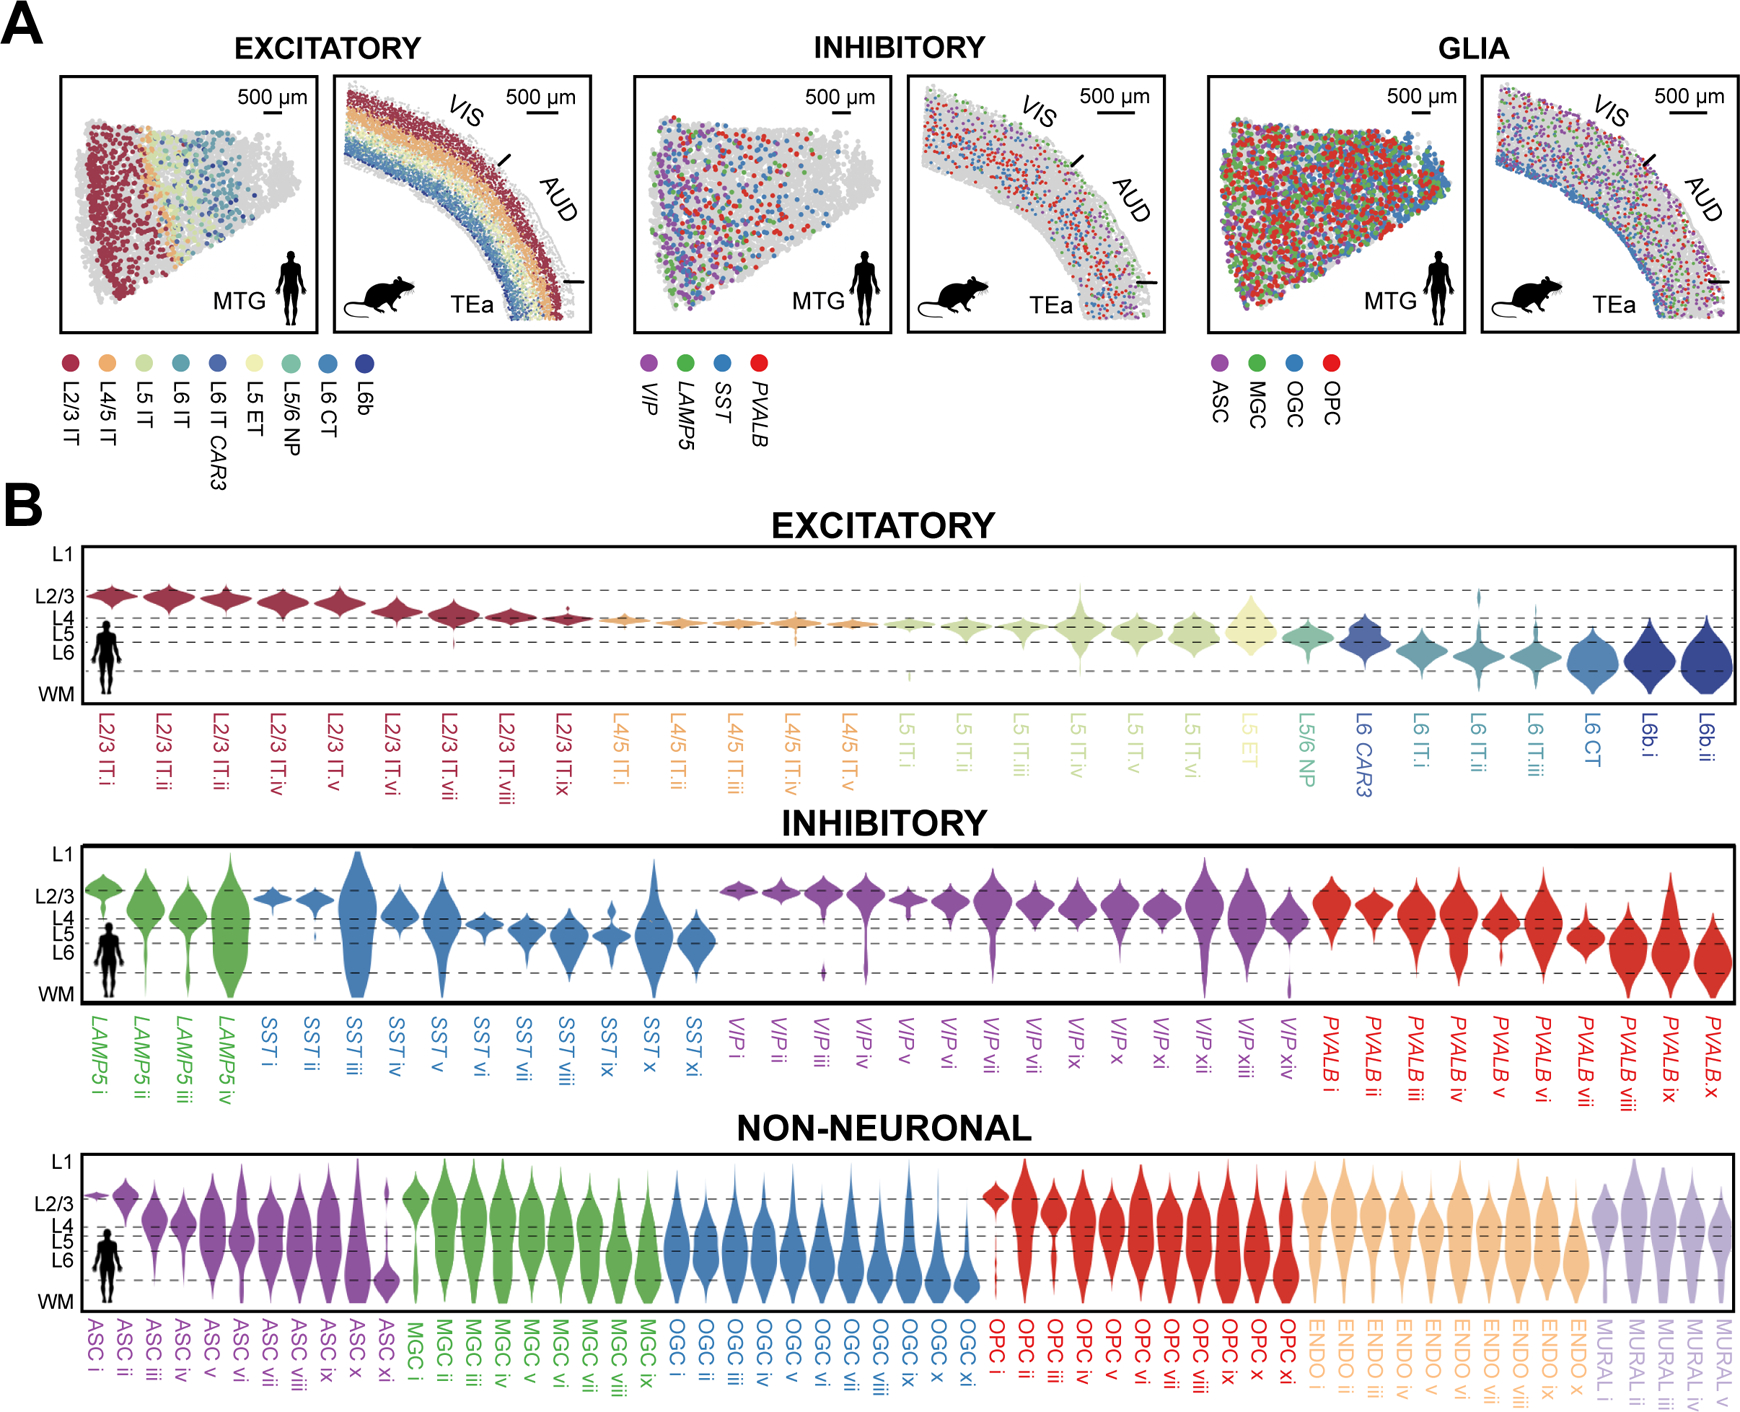
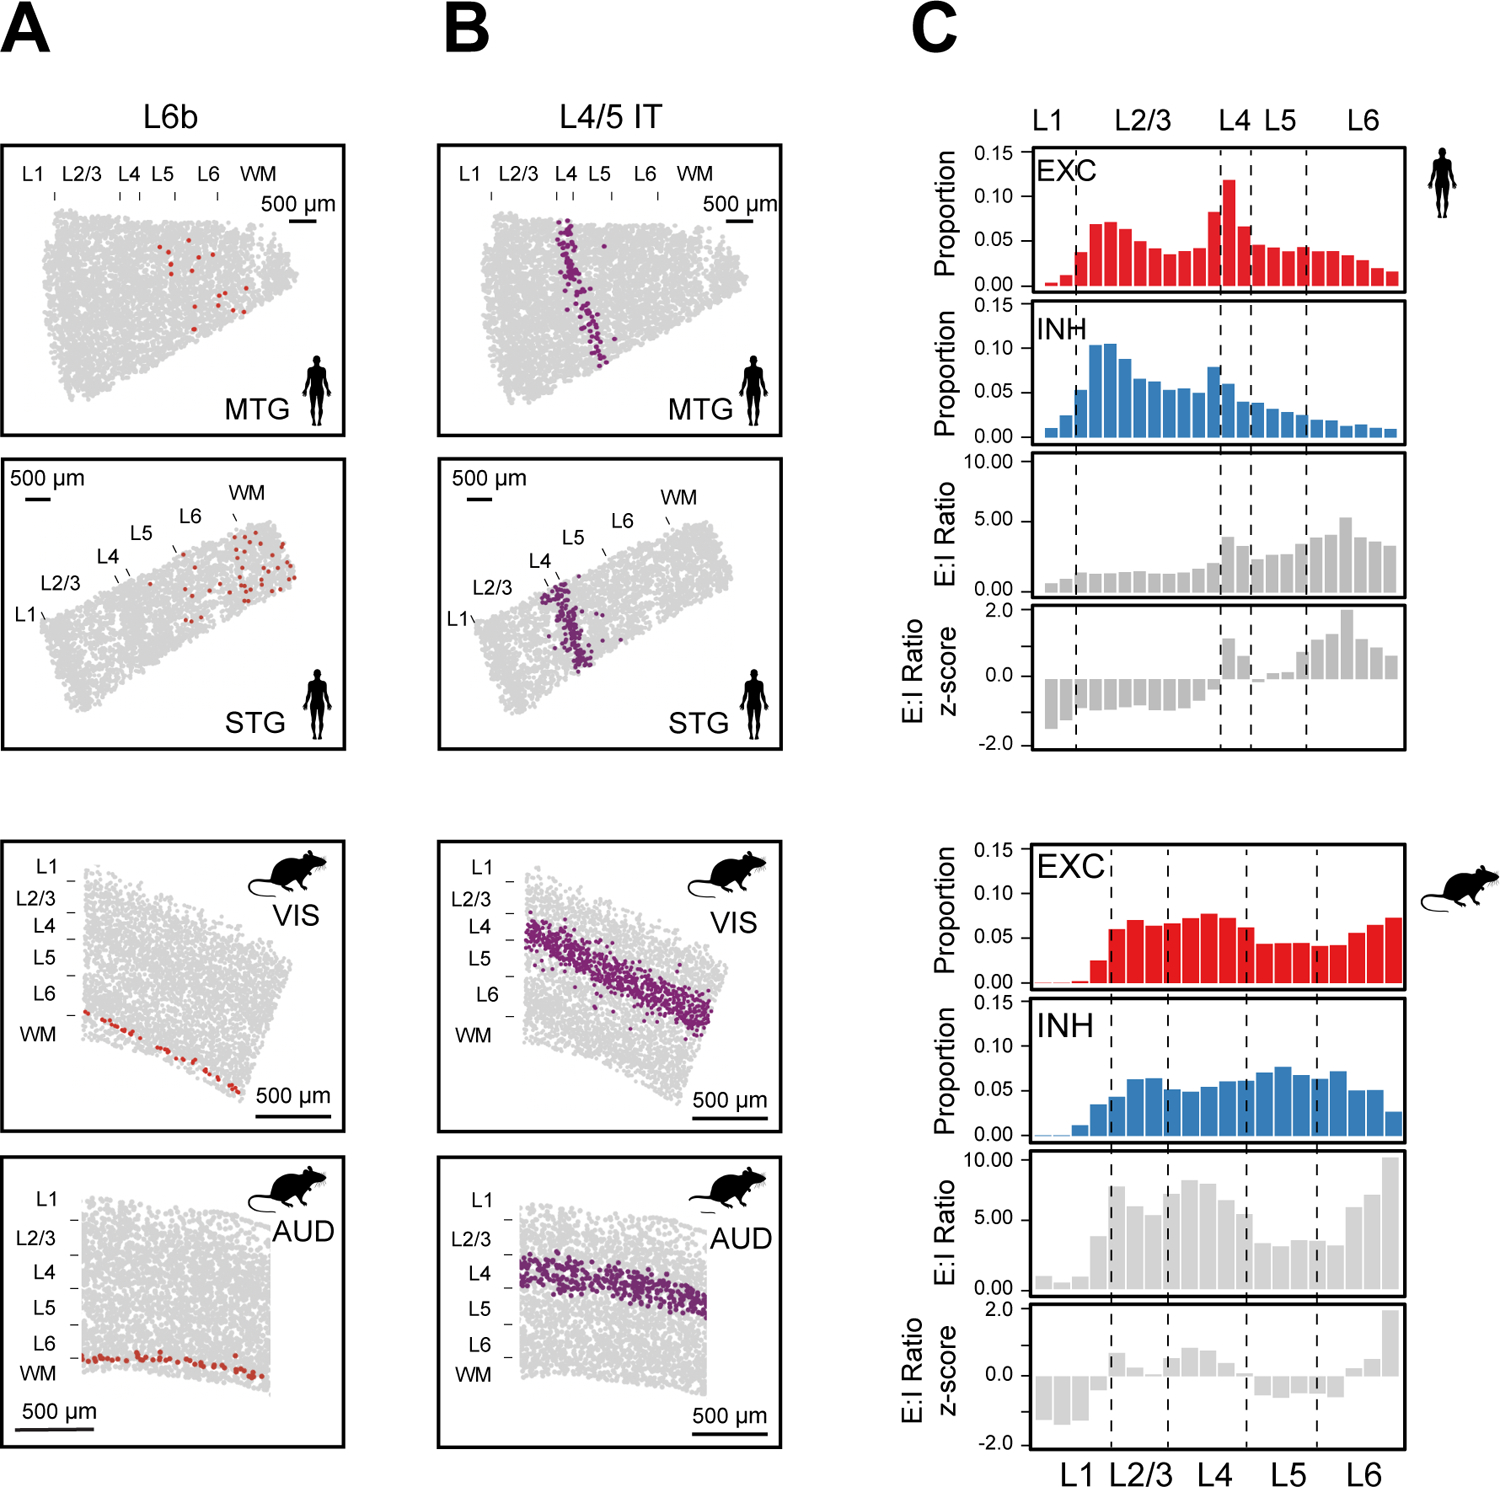
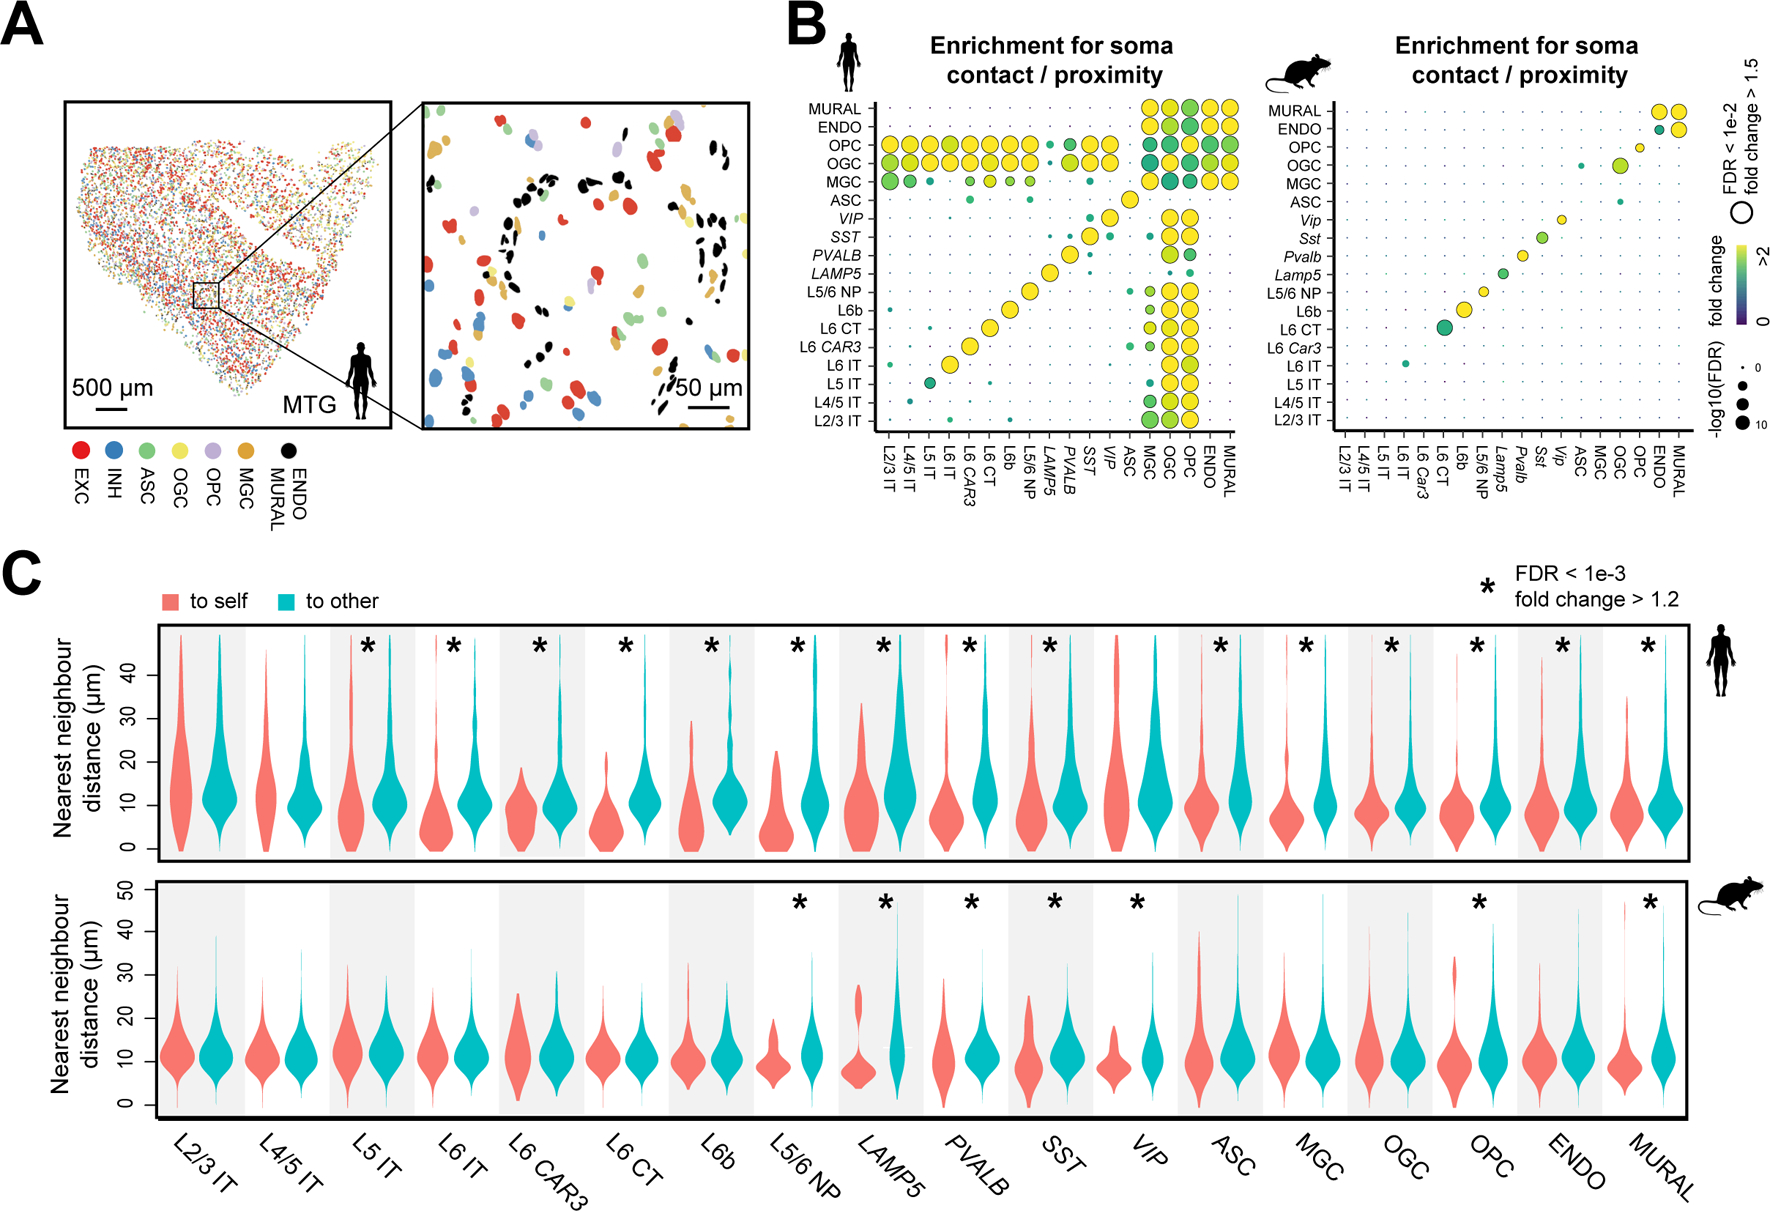
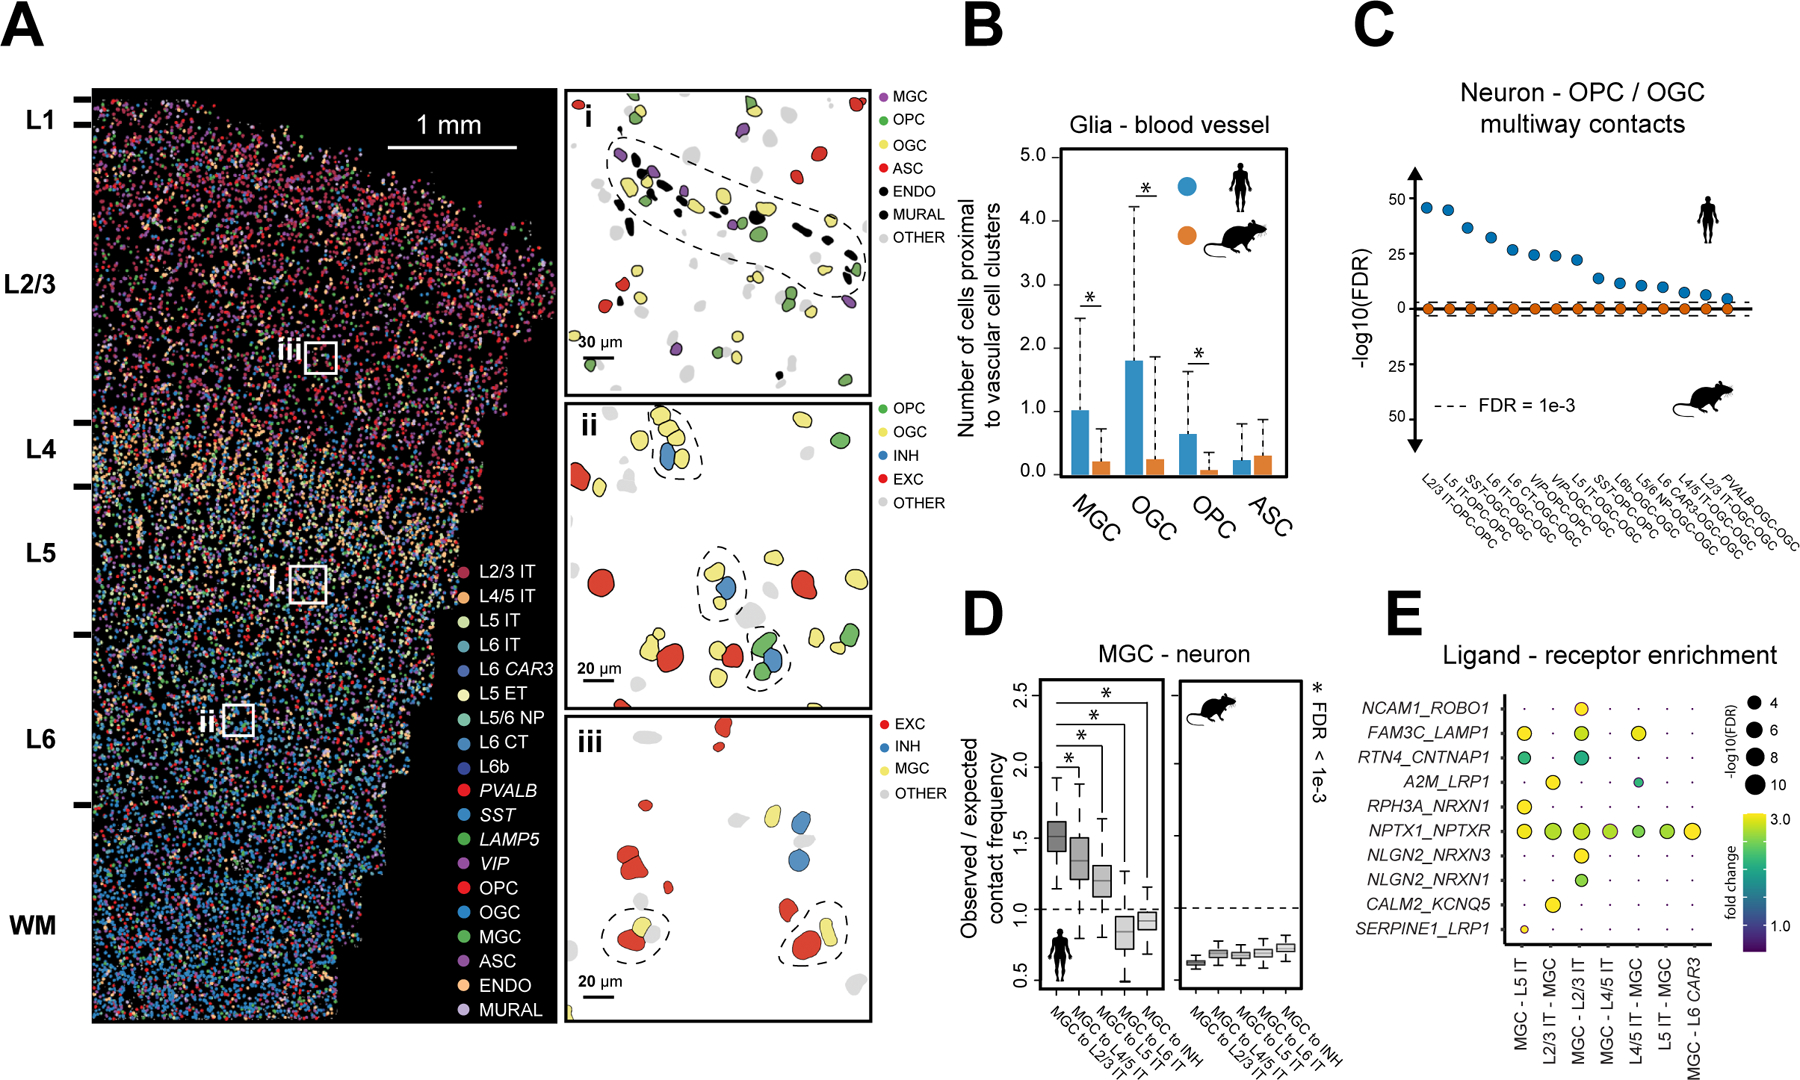
The human cerebral cortex has tremendous cellular diversity. How different cell types are organized in the human cortex and how cellular organization varies across species remain unclear. In this study, we performed spatially resolved single-cell profiling of 4000 genes using multiplexed error-robust fluorescence in situ hybridization (MERFISH), identified more than 100 transcriptionally distinct cell populations, and generated a molecularly defined and spatially resolved cell atlas of the human middle and superior temporal gyrus. We further explored cell-cell interactions arising from soma contact or proximity in a cell type-specific manner. Comparison of the human and mouse cortices showed conservation in the laminar organization of cells and differences in somatic interactions across species. Our data revealed human-specific cell-cell proximity patterns and a markedly increased enrichment for interactions between neurons and non-neuronal cells in the human cortex.


Conflict of interest statement

Competing interests:

C.X. and X.Z. are inventors on patents applied for by Harvard University related to MERFISH. X.Z. is a co-founder and consultant of Vizgen.

Figures

Fig. 1.
Fig. 1.. Spatially resolved single-cell transcriptome profiling of the human cortex by MERFISH.
(A) Schematic of 4000-gene MERFISH measurements of the human MTG and STG using a 48-bit error-correcting code. (B) Example MERFISH images. Left: MERFISH image of a single field-of-view, with maximum projection across all 48 bits shown. Middle: Zoomed-in image of the boxed region. Right: Decoded RNA molecules of the zoomed-in region. Scale bars indicate the real size of the sample prior to expansion. (C) Cell-type classification of the MTG and STG from MERFISH data and the expression of a subset of marker genes. EXC: excitatory neurons; INH: inhibitory neurons; ASC: astrocytes; MGC: microglial cells; OGC: oligodendrocytes; OPC: oligodendrocyte progenitor cells; ENDO: endothelial cells; MURAL: mural cells; IT: intratelencephalic-projecting neurons; ET: extratelencephalic-projecting neurons; NP: near-projecting neurons; CT: cortico-thalamic projecting neurons. The size and color of each dot correspond to the percentage of cells expressing the gene in each cluster and the average normalized expression level, respectively. (D) Proportions of excitatory neurons, inhibitory neurons, and major subclasses of non-neuronal cells in human MTG and STG and four mouse cortical regions including MOp, VIS, AUD and TEa. (E) Proportion of subclasses of excitatory neurons (left), IT neurons (middle), and inhibitory neurons (right) in human MTG and STG and the four mouse cortical regions.
Fig. 2.
Fig. 2.. Laminar organization of cell types in the human and mouse cortex.
(A) Spatial maps of subclasses of excitatory neurons, inhibitory neurons, and glial cells determined by MERFISH in a human MTG slice and a mouse slice containing VIS, AUD and TEa. Indicated subclasses are shown in colors and other cells are in grey. (B) Cortical-depth distribution of excitatory (top), inhibitory (middle) and non-neuronal (bottom) clusters in the human MTG. The dashed grey lines mark the approximate layer boundaries. WM: white matter.
Fig. 3.
Fig. 3.. Cortical-depth distributions of L6b, L4/5 IT, and excitatory-to-inhibitory neuronal ratio.
(A-B) Spatial maps of L6b (A) and L4/5 IT (B) neurons in a human MTG slice (top), a human STG slice (second), a VIS-containing region (third) and AUD containing region (bottom) in a mouse slice. (C) Normalized cortical-depth distributions of excitatory (EXC) and inhibitory (INH) neurons, E:I ratio, and E:I ratio z-score in human (top) and mouse (bottom) cortex. E:I ratio: the ratio between the numbers of excitatory and inhibitory neurons.
Fig. 4.
Fig. 4.. Cell-type-specific cell-cell interactions in the human and mouse cortex
. (A) Spatial map of excitatory neurons, inhibitory neurons, and six major subclasses of non-neuronal cells in a human MTG slice (left) and a zoomed-in image of the boxed region (right). Colored shapes are cell nuclei segmentations. (B) Enrichment map of pairwise soma contact or proximity for subclasses of cells in human (left) and mouse (right) cortex. The color of the dots indicates the fold change between the observed frequency of soma contact or proximity and the average expected frequency from the spatial permutations that disrupt the spatial relationship between neighboring cells (fig. S13). The size of the dots indicates the significance level of the enrichment. FDR: P-value determined with upper-tailed Z-test and adjusted to FDR by the BH procedure. (C) Distributions of the nearest-neighbor distances from cells in individual subclasses to cells in the same subclass (“to self”, red) or other subclasses (“to other”, blue) in human (top) and mouse (bottom) cortex. FDR: P-value determined with the Wilcoxon rank-sum one-sided test and adjusted to FDR by the BH procedure.
Fig. 5.
Fig. 5.. Interactions between glial and vascular cells and between glial cells and neurons in the human and mouse cortex
. (A) Spatial map of subclasses of cells in a human STG slice. Top right: Zoom-in of boxed region i. A blood vessel with juxtaposed glial cells is marked by dashed line. Middle right: Zoom-in of boxed region ii. Multiway contacts between neurons and oligodendrocytes and/or OPCs are marked by dashed lines. Bottom right: Zoom-in of boxed region iii. Contacting pairs of neurons and microglia are marked by dash lines. Colored and grey shapes are cell nuclei segmentations, (B) Average numbers of microglia, oligodendrocytes, OPCs, and astrocytes adjacent to each identified blood vessel in human (blue) and mouse (orange). Error bars are standard deviation (N = 3,415 vascular structures). * FDR < 1e-3 (as determined in Fig. 4B). (C) The significance level of multiway contacts between neurons and oligodendrocytes and/or OPCs in human (blue) and mouse (orange) cortex. The significance level was determined by comparing the observed contact frequency with the expected frequencies from spatial permutations as described in fig. S13. FDR: P-values determined with an upper-tailed Z-test and adjusted to FDR by the BH procedure. (D) The ratio between observed contact frequency and expected contact frequency (from spatial permutations) between microglia and L2/3 IT, L4/5 IT, L5 IT, L6 IT, and inhibitory neurons in human (left) and mouse (right). In the box plot, midline is the median, box edges are 75th and 25th percentiles, and whiskers indicate 1.5 times the interquartile range. * FDR < 1e-3 (as determined in Fig. 4B). (E) Enrichment of ligand-receptor pairs in contacting microglia and IT neurons. The color and size of the dots correspond to the fold change and significance level of the observed ligand-receptor scores over their expected values. FDR as determined in (C).

References

    1. Herculano-Houzel S, The human brain in numbers: a linearly scaled-up primate brain. Front. Hum. Neurosci 3 (2009), doi:10.3389/neuro.09.031.2009. - DOI - PMC - PubMed
    1. Lui JH, Hansen DV, Kriegstein AR, Development and Evolution of the Human Neocortex. Cell. 146, 18–36 (2011). - PMC - PubMed
    1. Fields RD, Stevens-Graham B, New Insights into Neuron-Glia Communication. Science. 298, 556–562 (2002). - PMC - PubMed
    1. Barres BA, The Mystery and Magic of Glia: A Perspective on Their Roles in Health and Disease. Neuron. 60, 430–440 (2008). - PubMed
    1. Scuderi C, Verkhratsky A, in Progress in Molecular Biology and Translational Science (Elsevier, 2020), vol. 173, pp. 301–330. - PubMed

LinkOut - more resources