Review
. 2022 Nov 2;46(6):fuac030.
doi: 10.1093/femsre/fuac030.

Methods to monitor bacterial growth and replicative rates at the single-cell level

Affiliations
Review

Methods to monitor bacterial growth and replicative rates at the single-cell level

Florian C Marro et al. FEMS Microbiol Rev. .

Abstract

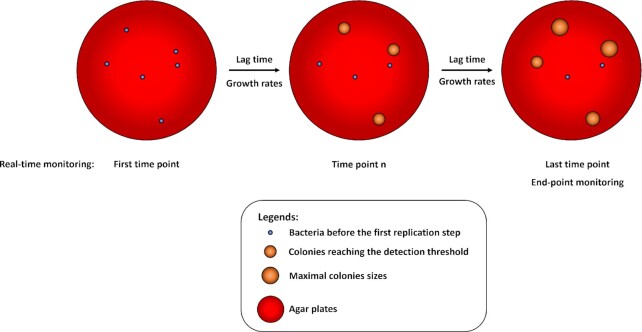
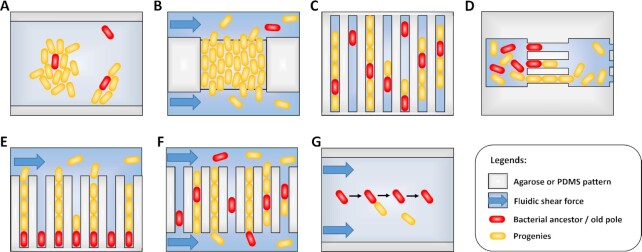
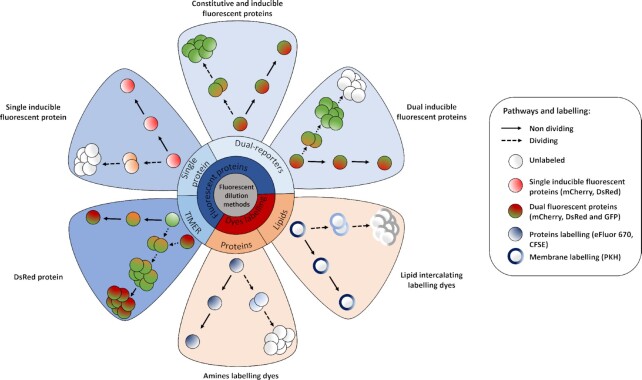
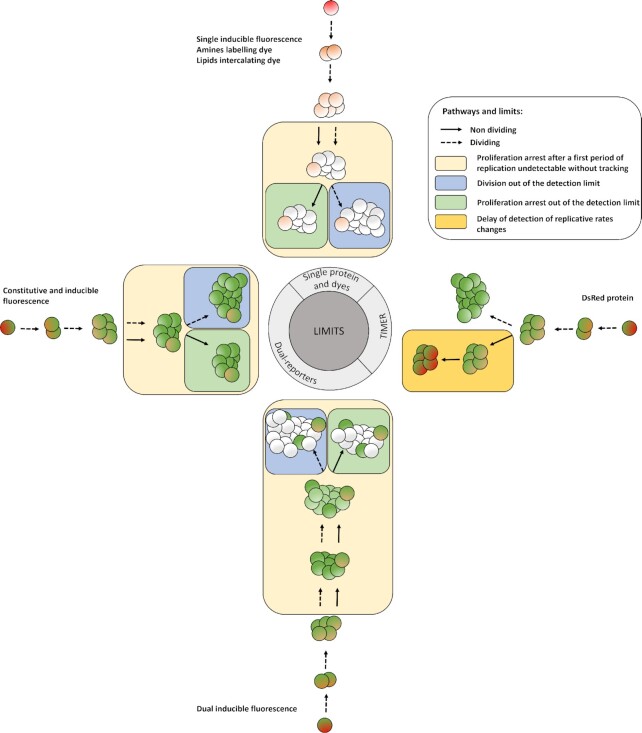
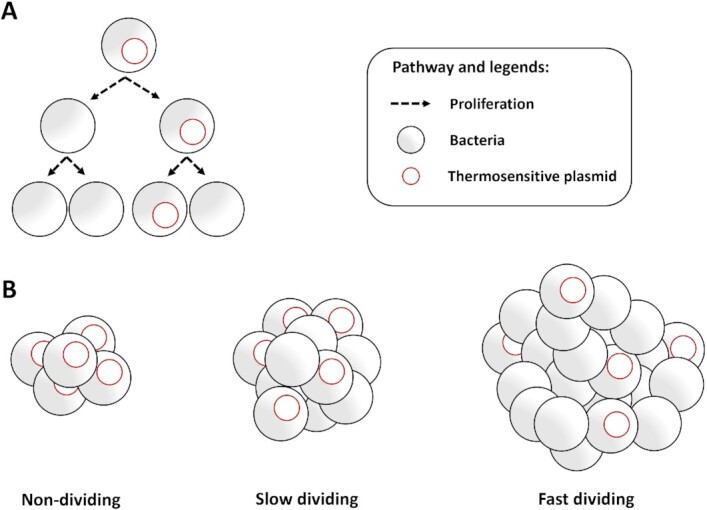
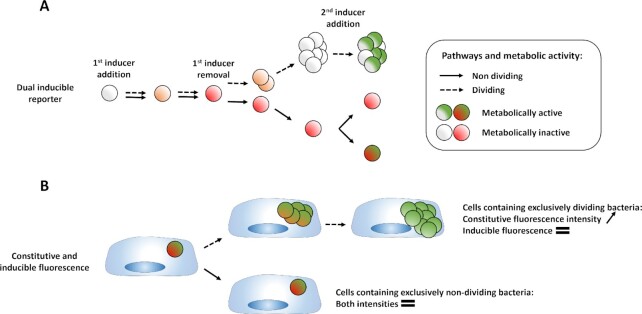
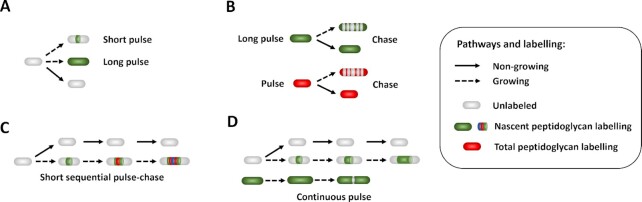
The heterogeneity of bacterial growth and replicative rates within a population was proposed a century ago notably to explain the presence of bacterial persisters. The term "growth rate" at the single-cell level corresponds to the increase in size or mass of an individual bacterium while the "replicative rate" refers to its division capacity within a defined temporality. After a decades long hiatus, recent technical innovative approaches allow population growth and replicative rates heterogeneity monitoring at the single-cell level resuming in earnest. Among these techniques, the oldest and widely used is time-lapse microscopy, most recently combined with microfluidics. We also discuss recent fluorescence dilution methods informing only on replicative rates and best suited. Some new elegant single cell methods so far only sporadically used such as buoyant mass measurement and stable isotope probing have emerged. Overall, such tools are widely used to investigate and compare the growth and replicative rates of bacteria displaying drug-persistent behaviors to that of bacteria growing in specific ecological niches or collected from patients. In this review, we describe the current methods available, discussing both the type of queries these have been used to answer and the specific strengths and limitations of each method.


Figures

Figure 1.
Figure 1.
Principle of the colonies monitoring methods to record indirectly bacterial first replicative step at the single cell level. A known number of bacteria are spread onto agar plates (left panel). Then acquisition device, either a scanner or a digital camera, record plates at intervals during the experiment to perform real-time monitoring or at the end of the experiments to perform end-point monitoring. Using both methods, colonies are detected when it reaches the detection threshold of the systems (middle panel). End-point monitoring allows determining at a specific time point the ratio of bacteria having done at least one replicative step versus VBNC (right panel). Real-time monitoring allows determining colony lag time and/or subsequent growth rates of colonies. Using live microscopic control, the colonies calculated appearance delays could be extrapolated as bacterial lag time.
Figure 2.
Figure 2.
Patterns of the time-lapse microscopy method to monitor growth and replicative rates. Schemes representing methods for time-lapse microscopy 2D microcolonies (A) and (B), (top left), linear microcolonies (C)–(F), (top right and bottom left), and individual bacterium monitoring (G), (bottom right). (A) 2D monolayer microcolonies method; bacteria are spread on a pad and allowed to grow and divide in two dimensions. (A)–(G) Optionally, medium is flowed in via microfluidics to feed the microcolonies. (B) Turbidostat method; bacteria are caught on a trap formed by two large neighboring cavities (above and below). Laminar fluidic shear force remove and flow away the bacterial ancestor and its progenies having fallen into the opposite openings via growth and dividing spatial force. (C) Narrow grooves method, bacteria are caught on linear traps and allowed to grow and divide, thus forming linear microcolonies. (D) Successive interconnected chambers method; bacteria are seeded inside the first chamber of the array. Ancestors enter within narrow grooves, growth and dividing spatial force push half of the linear microcolonies inside the next chamber. The successive chambers have thinner grooves than the first it is connect to. (E) Mother machine method; individual bacteria are seeded at the dead end of narrow grooves. Growth and dividing spatial force pushes progenies toward the opened end. Bacteria are then flowed away by laminar fluidic shear force. Mother bacteria with the oldest pole remain at the bottom of the channels. (F) Chemostat method; bacteria are seeded inside narrow grooves opened at both sides. Growth and dividing spatial force pushes progenies and ancestor outside of the channels. Shear force flows away bacteria having fallen. (G) Individual bacteria monitoring method; adherent bacteria are spread on a pad and allowed to grow and divide. Laminar fluidic shear force removes the non-adhering progenies while the ancestors remain anchored. Furthermore, ancestor and progenies can be isolated or trashed via optical tweezers able to penetrate inside micropattern (not represented).
Figure 3.
Figure 3.
Principles of the different fluorescence dilutions methods to study bacterial replicative rates at the single cell level. Dyes(bottom and bottom right) either label-free amines or intercalate in the lipid membrane(s) of bacteria. At each replicative step the initially labeled content of the bacteria will be diluted by a factor two resulting in halving of the fluorescence intensity recorded. When pre-expressed, single inducible fluorescent proteins(top left) will be similarly diluted during bacterial proliferation. Meanwhile bacteria that do not undergo any replication will remain as labeled initially. Dual reporter methods combine a single inducible fluorescent protein with either a constitutive fluorescent protein (top) or another inducible fluorescent protein (top right). Dual-reporters constructed on the basis of two independently inducible fluorescent proteins improve the detection range of the method by successive removal of each inducer. The TIMER method employing mainly DsRed protein(bottom left) relies on both the global initial bacterial content reduction at each replicative step and the sequential maturing fluorescent proteins. One fluorescent protein matures faster than the other does and can, thus accumulate within the replicating bacterial population whereas, in contrast, the slower maturing cannot. Moreover, within proliferation arrested bacteria both differentially maturing proteins can accumulate. In contrast, when replicating arrested bacteria enter a replicative phase the slowly maturing protein will be diluted by a factor two at each replicative step.
Figure 4.
Figure 4.
Limits of the fluorescence dilution methods. In total, four classes of limits are here represented: (1) a proliferation arrested phase occurring before the detection limit of the method is reached after a first period of replication cannot be detected without bacterial tracking, (2) any dividing, or (3) dividing-arrested phases outside of the dilution detection limit will not be recordable. (1), (2), and (3) represent limits of dyes, single inducible fluorescent proteins,anddual-reporters tools(top, left, and bottom). Finally; and specific to the TIMER method (right), (3) rapid dividing state changes will not be detectable due to the slow maturing protein. Amine labeling dye combined with constitutively expressed fluorescent protein as well as dual-reporter constructions carrying both a constitutive and an inducible fluorescence reporter allow bacterial tracking outside of the dilution limit via microscopy.
Figure 5.
Figure 5.
Thermosensitive plasmid method to analyze population-dividing rates from single cell data level. (A) Plasmid dilution principle (top) (B) Schematic representation of plasmid dilution ratio within Non-dividing, Slow dividing and Fast dividing bacterial population (bottom).
Figure 6.
Figure 6.
Dual-reporters plasmids concomitant assessment. (A) Metabolic assessment (top) and (B) host cell sorting depending on bacterial intracellular replicative content (bottom).
Figure 7.
Figure 7.
Models for the DsRed maturation pathways. Mutational engineering shed light on the E5 DsRed mutant regarding its fluorescence that change over time (Terskikh 2000). During the maturation kinetics, a green fluorescence appears early and declines as red fluorescence appears as shown in the Conventional model (Terskikh ; top). However, even after a prolonged period of maturation, the chromophore sample was composed of equally distributed green and red fluorescence (Garcia-Parajo et al. , Gross et al. 2000), suggesting a coexistence of both chromophore, which makes null and void the Conventional model. The Irreversible deprotonation model inserts an intermediate blue species within the maturation path (Verkhusha et al. ; middle). It gives by competition either the green chromophore by deprotonation of the phenolic group or the red chromophore by oxidation, explaining the final coexistence of both. Of note, within the irreversible deprotonation model, intratetramer fluorescence resonance energy transfer (FRET) occurred from green to red fluorescent proteins, decreasing green fluorescence while increasing red fluorescence (Strack et al. 2010). Strack et al. (2010) proposed a novel branched pathway model (bottom). In this model, a branch point intermediate is the place of two competing reactions. Dehydration opens the way to the green branch, while final oxidation creates a blue species, which itself may give rise to a red and non-absorbing species.
Figure 8.
Figure 8.
Principles of the peptidoglycan biosynthesis highlighting methods to monitor growth rate and dividing behavior. The nascent and total bacterial peptidoglycan regions can be labeled using antibiotics, lectins, and amino acids derivatives. (A) Peptidoglycan synthesis dyes during short pulse labeled the nascent peptidoglycan sites while long pulse uniformly labeled growing bacteria. Of note, non-growing bacterial subset remains unlabeled. (B) Bacteria uniformly labeled with either nascent peptidoglycan dyes during long pulse or total peptidoglycan dyes will incorporated unlabeled new materials during the chase period. Time-lapse microscopy monitoring allows measuring the bacterial and the subcellular growth rate based on unlabeled region extension. A non-growing bacterial subset should remain uniformly labeled at the chase time. (C) Short sequential pulse-chase using different fluorophores label the nascent peptidoglycan sites sequentially. End-point analysis creates a growing map over-time. (D) Continuous pulse enable real-time measurement of the nascent peptidoglycan sites kinetics of growing bacteria using time-lapse microscopy. Growing labeled bacteria via the recycling pathway highlight dividing step due to fluorescence intensity drop at the septum. (C) and (D) Short sequential pulse-chase and continuous pulse should, therefore, discriminate the non-growing unlabeled subset and highlighted the growth rate.

Similar articles

Cited by

References

    1. Adams KN, Takaki K, Connolly LE. et al. . Drug tolerance in replicating mycobacteria mediated by a macrophage-induced efflux mechanism. Cell. 2011;145:39–53. - PMC - PubMed
    1. Aldridge BB, Fernandez-Suarez M, Heller D.et al. . Asymmetry and aging of mycobacterial cells lead to variable growth and antibiotic susceptibility. Science. 2012;335:100–4. - PMC - PubMed
    1. Antunes LCS, Imperi F, Carattoli A. et al. . Deciphering the multifactorial nature of Acinetobacter baumannii pathogenicity. PLoS ONE. 2011;6:10. - PMC - PubMed
    1. Arnoldini M, Vizcarra IA, Peña-Miller R. et al. . Bistable expression of virulence genes in Salmonella leads to the formation of an antibiotic-tolerant subpopulation. Balaban N (ed.). PLoS Biol. 2014;12:e1001928. - PMC - PubMed
    1. Atwal S, Giengkam S, VanNieuwenhze M. et al. . Live imaging of the genetically intractable obligate intracellular bacteria Orientia tsutsugamushi using a panel of fluorescent dyes. J Microbiol Methods. 2016;130:169–76. - PMC - PubMed

Publication types