. 2022 Sep 1;82(17):3284-3298.e7.
doi: 10.1016/j.molcel.2022.06.008. Epub 2022 Jun 29.

The mTORC1-SLC4A7 axis stimulates bicarbonate import to enhance de novo nucleotide synthesis

Affiliations

The mTORC1-SLC4A7 axis stimulates bicarbonate import to enhance de novo nucleotide synthesis

Eunus S Ali et al. Mol Cell. .

Abstract

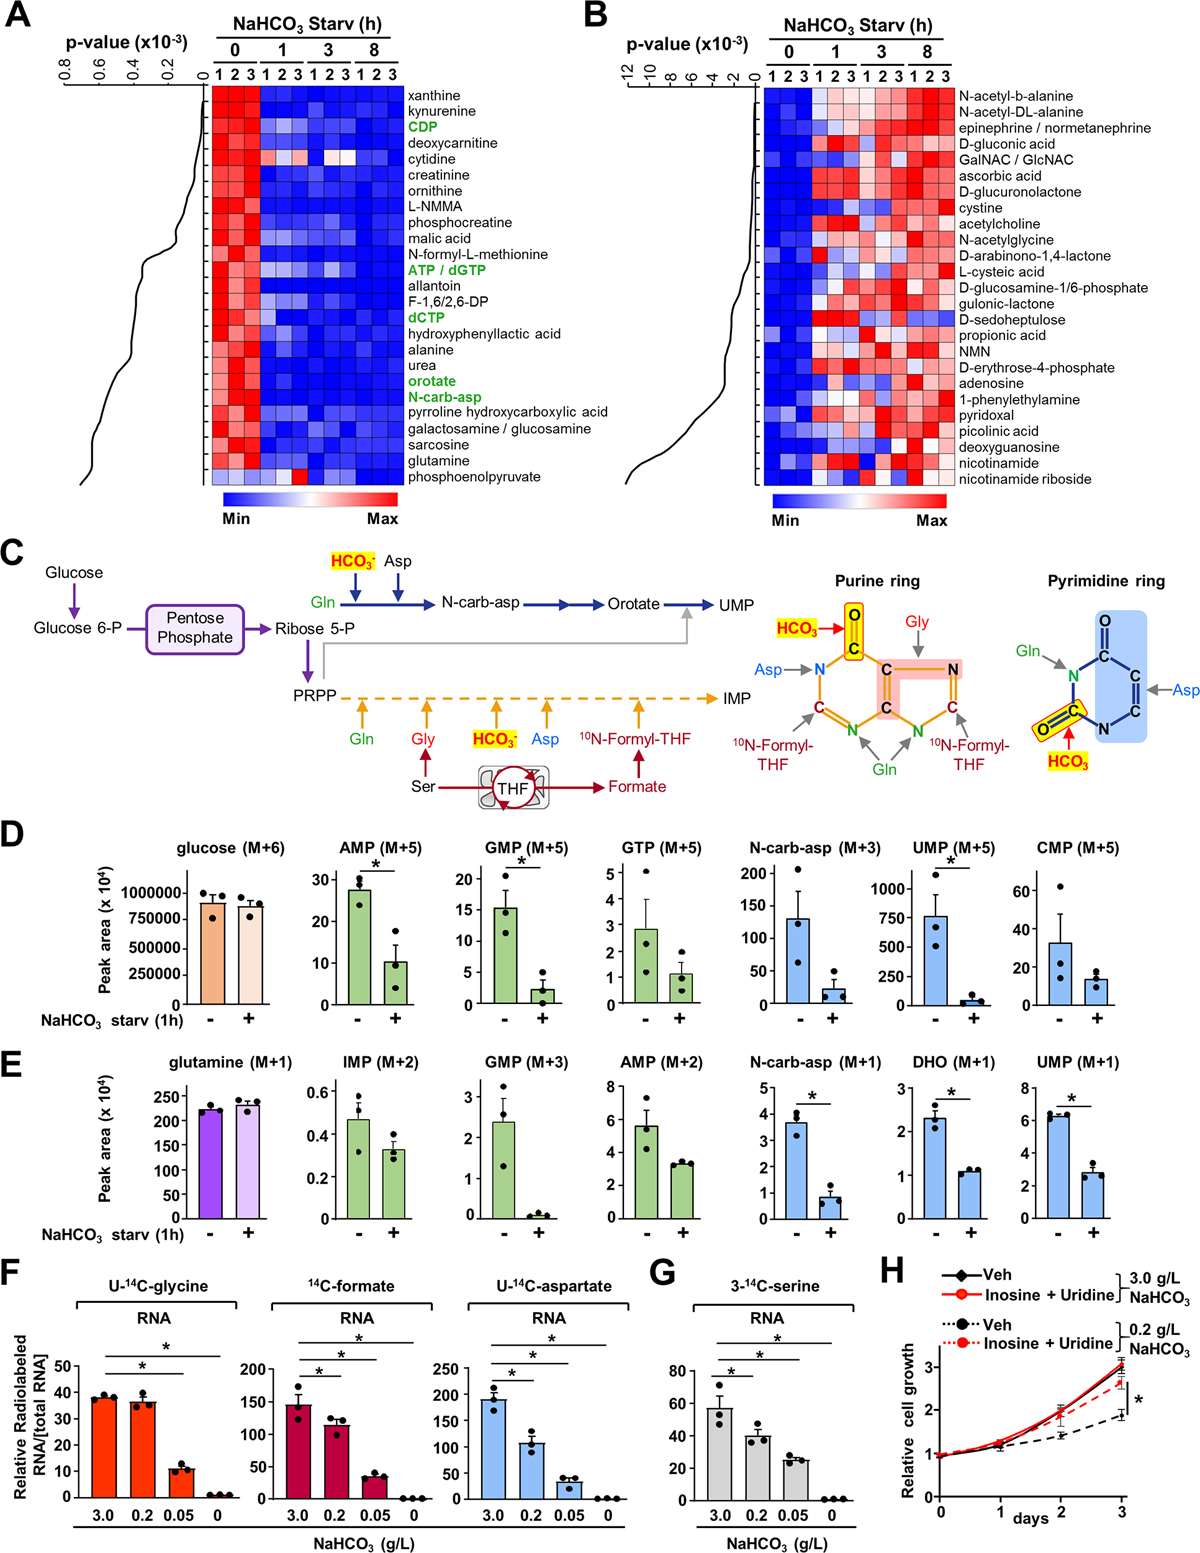
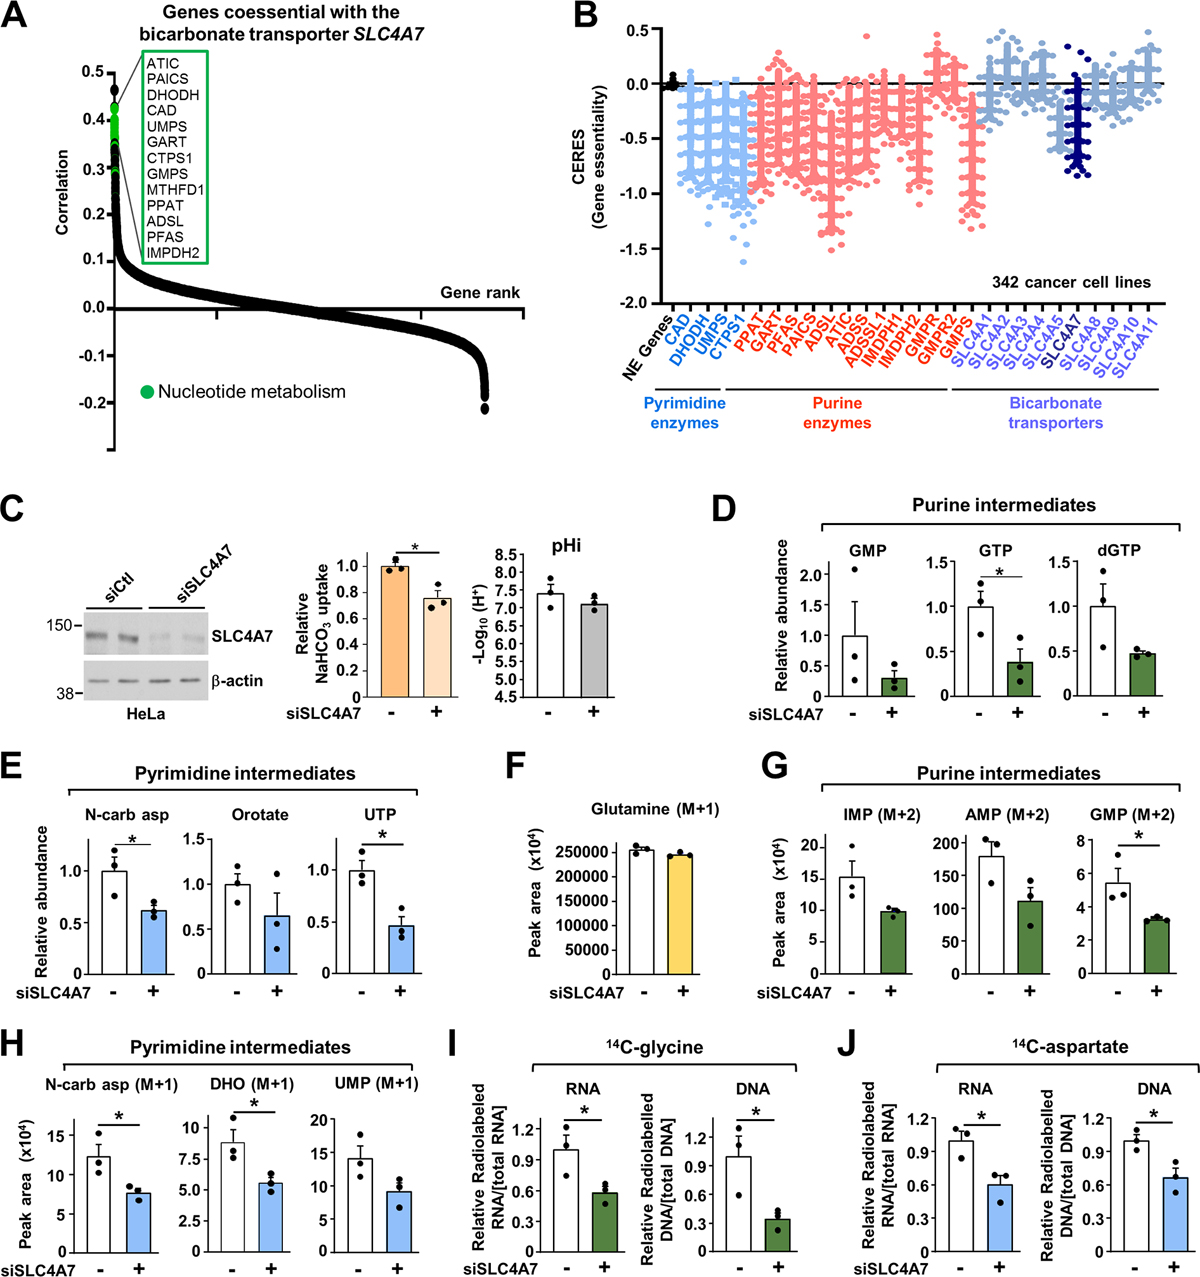
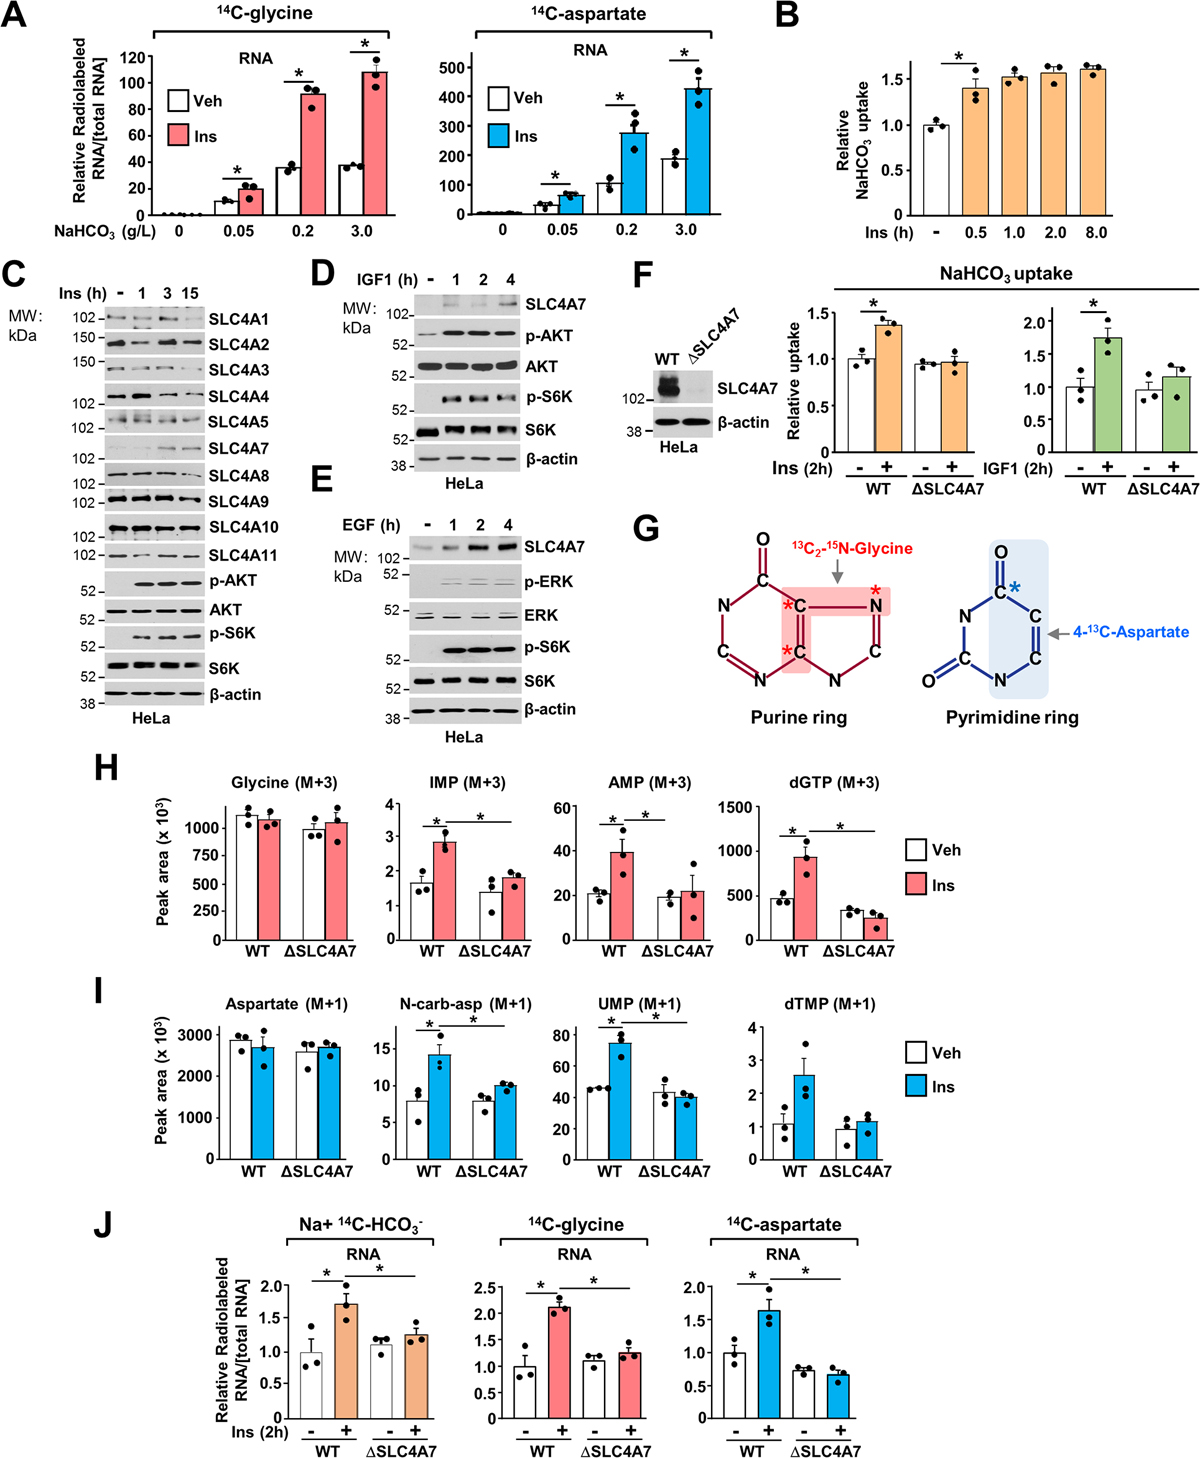
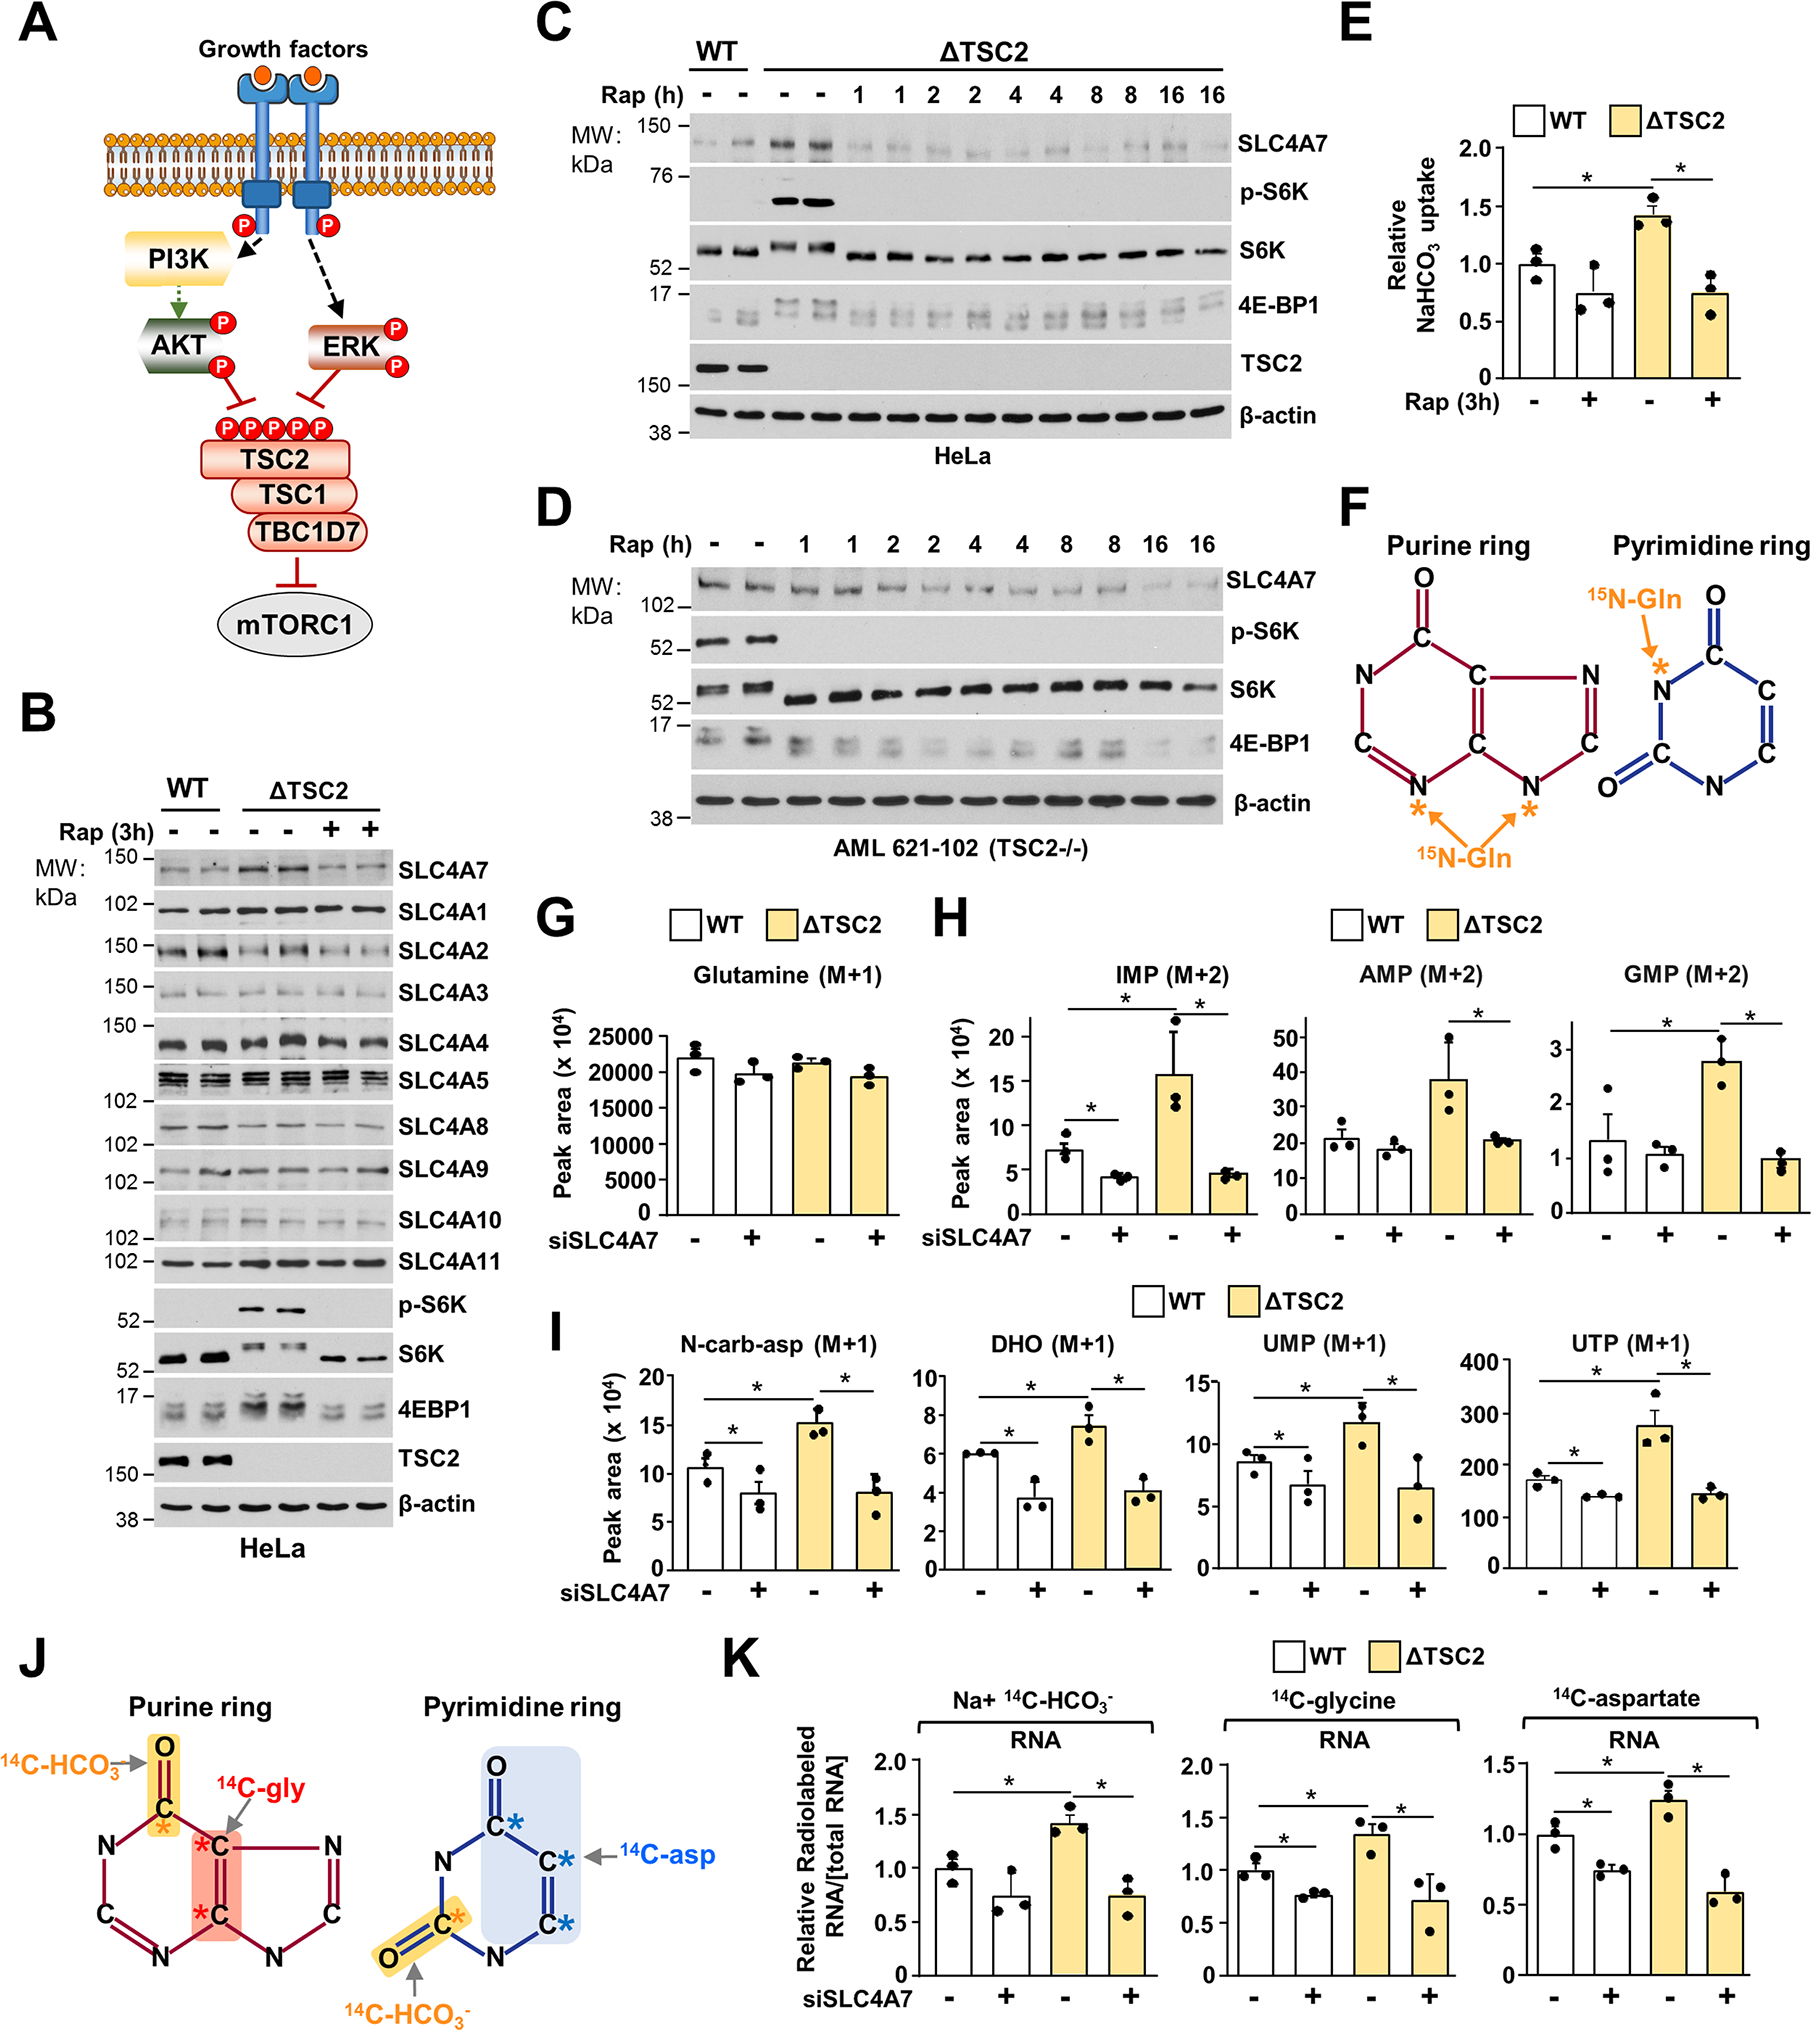
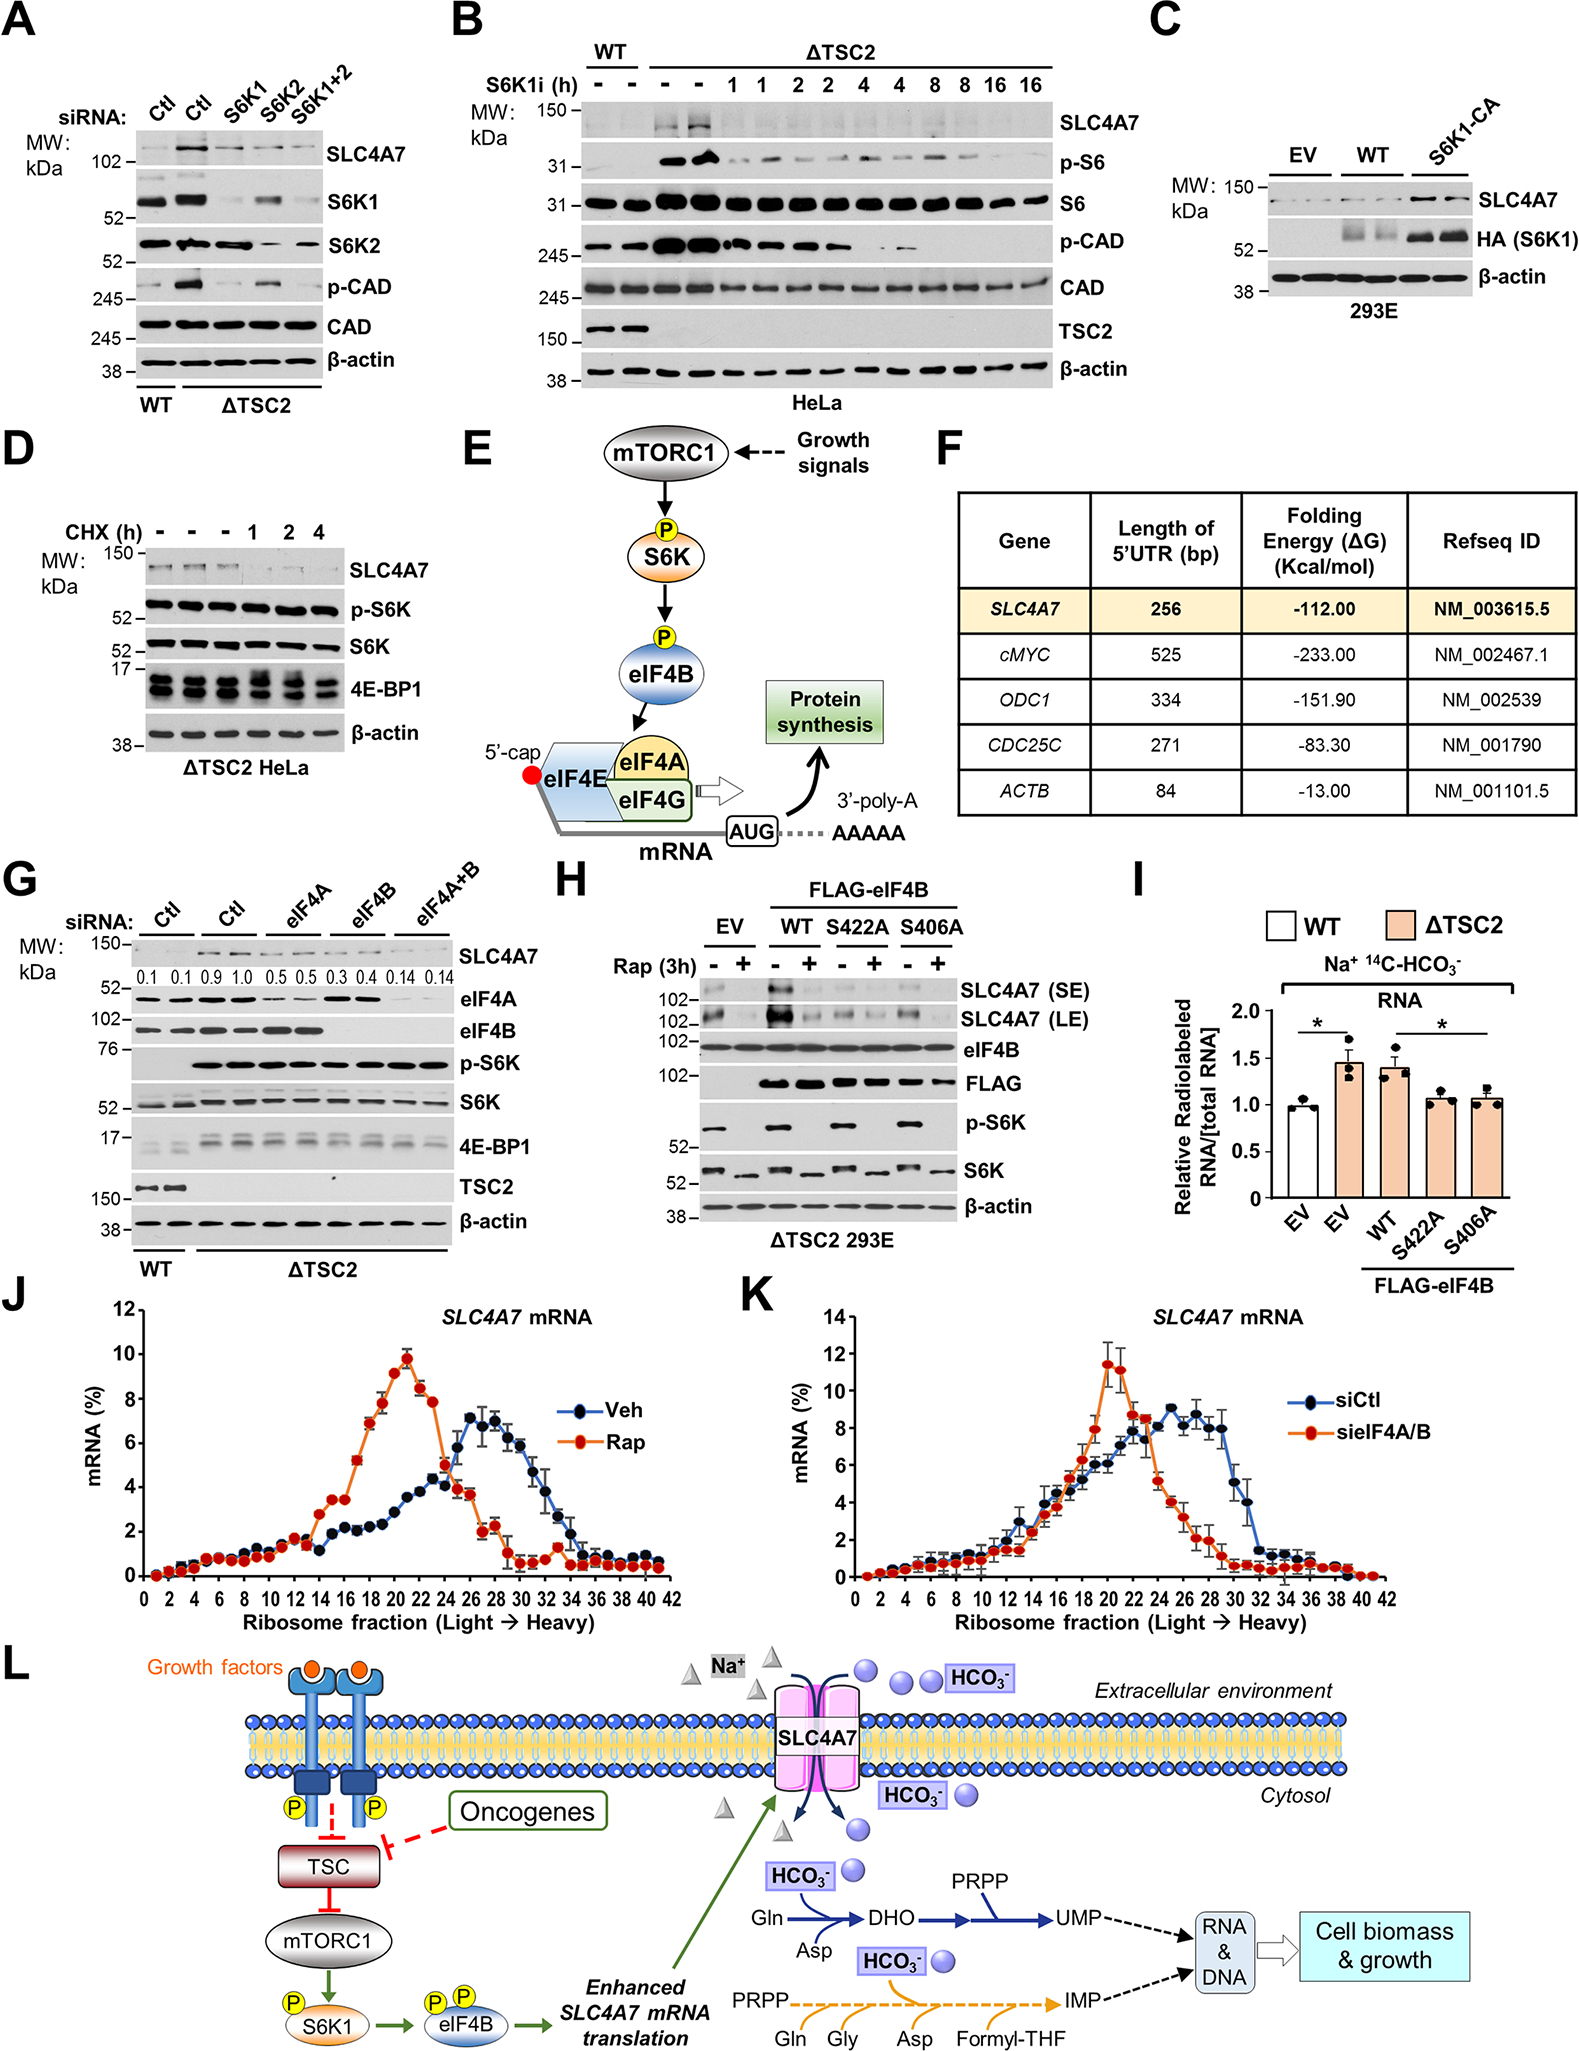
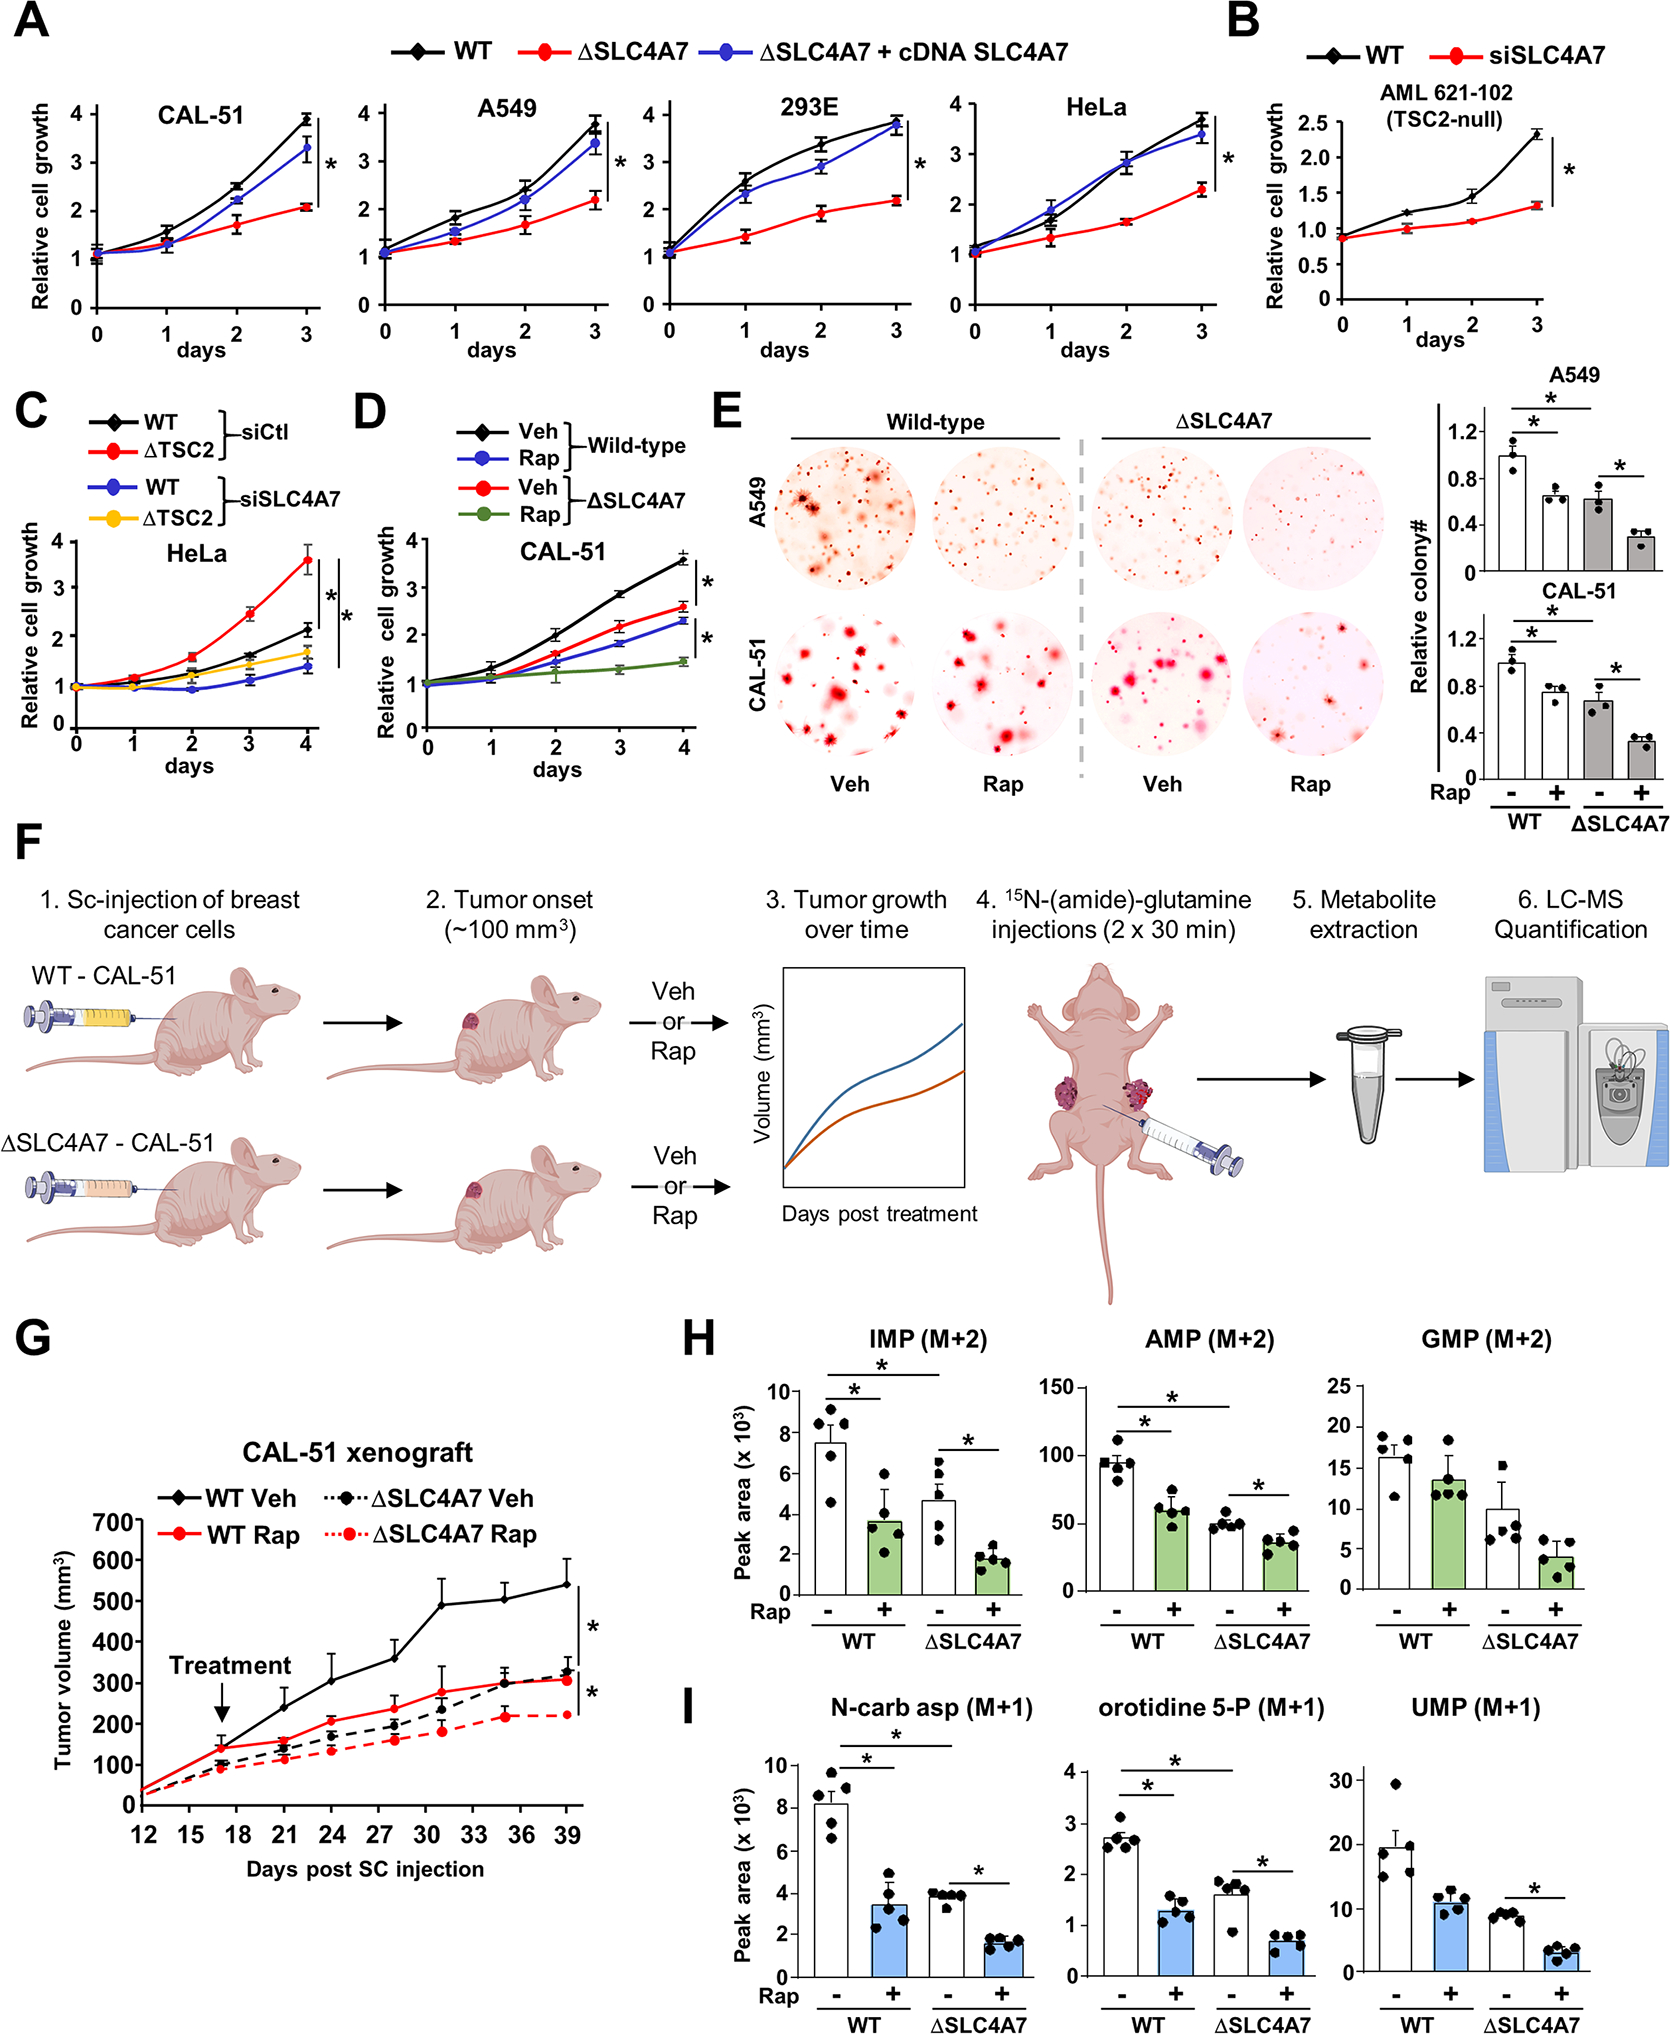
Bicarbonate (HCO3-) ions maintain pH homeostasis in eukaryotic cells and serve as a carbonyl donor to support cellular metabolism. However, whether the abundance of HCO3- is regulated or harnessed to promote cell growth is unknown. The mechanistic target of rapamycin complex 1 (mTORC1) adjusts cellular metabolism to support biomass production and cell growth. We find that mTORC1 stimulates the intracellular transport of HCO3- to promote nucleotide synthesis through the selective translational regulation of the sodium bicarbonate cotransporter SLC4A7. Downstream of mTORC1, SLC4A7 mRNA translation required the S6K-dependent phosphorylation of the translation factor eIF4B. In mTORC1-driven cells, loss of SLC4A7 resulted in reduced cell and tumor growth and decreased flux through de novo purine and pyrimidine synthesis in human cells and tumors without altering the intracellular pH. Thus, mTORC1 signaling, through the control of SLC4A7 expression, harnesses environmental bicarbonate to promote anabolic metabolism, cell biomass, and growth.

Keywords: SLC4A7/NBCn1; bicarbonate metabolism; mTOR signaling; purine metabolism; pyrimidine metabolism.


Conflict of interest statement

Declaration of interests The authors declare no conflict of interests.

Figures

Figure 1.
Figure 1.. Influence of sodium bicarbonate levels on nucleotide synthesis activity.
(A, B) Steady-state metabolite profiles from HeLa cells cultured in buffered DMEM medium (20 mM HEPES) in the presence or absence of sodium bicarbonate (NaHCO3) over the indicated times. Intracellular metabolites from three independent samples per condition were profiled by means of liquid chromatography‒mass spectrometry LC-MS/MS and ranked by those significantly decreased upon NaHCO3 depletion (8 h) relative to non-depleted condition (A) or increased upon NaHCO3 depletion (8 h) (B). The top 25 most significant metabolites are shown as row-normalized heat maps (A, B) ranked according to p-value. The complete metabolite profiles from these samples are provided in Table S1. (C) Schematic illustrating the fate of the carbon and oxygen from bicarbonate and other metabolites into the pyrimidine and the purine rings. (D) Normalized peak areas of 13C-labeled purine and pyrimidine intermediates, as measured by targeted LC-MS/MS, in HeLa cells grown in dialyzed serum and depleted of NaHCO3 for 1 h and labeled with 13C6-glucose for 1 h. (E) Normalized peak areas of 15N-labeled purine intermediates from HeLa cells treated as in (D) and labeled with 15N-(amide)-glutamine for 1 h. (F, G) Radiolabeling was performed for 3 h in the presence of the indicated concentrations of NaHCO3 (g/L) reflecting de novo purine synthesis (U-14C-glycine, 14C-formate), pyrimidine synthesis (U-14C-aspartate), or one-carbon metabolism (3-14C-serine). (H) Proliferation of HeLa cells grown in dialyzed serum with indicated NaHCO3 concentrations in buffered medium supplemented or not with purine nucleoside (inosine 60 μM) and pyrimidine nucleoside (uridine 100 μM). (D)-(H) The data are graphed as the means ± SDs of biological triplicates and are representative of at least two independent experiments. *p < 0.05, by two-tailed Student’s t-test for pairwise comparisons in (D, E) or one-way ANOVA with Tukey’s post hoc test for multiple pairwise comparisons (F, G, H).
Figure 2.
Figure 2.. The sodium bicarbonate carrier SLC4A7 provides cellular bicarbonate for de novo purine and pyrimidine synthesis.
(A) Genes coessential with the sodium bicarbonate carrier SLC4A7. (B) CERES dependency score for the de novo purine, pyrimidine synthesis and bicarbonate transporter enzymes. A CERES score less than 0 indicates a higher likelihood that the gene of interest is essential in a given cell line. A score of 0 indicates a gene is not essential (NE Genes: Non-essential genes). (C) Immunoblots of HeLa cells transfected with siRNA targeting SLC4A7 or nontargeting controls, and measurement of intracellular pH (pHi) and NaHCO3 uptake. (D, E) Purine and pyrimidine levels measured via LC-MS/MS in HeLa cells transfected as in (C) (F) Normalized peak areas of 15N-glutamine levels measured as in (D) in HeLa cells treated as in (C) and labeled with 15N-amide-glutamine for 1 h. (G, H) Normalized peak areas of 15N-labeled nucleotide intermediates from HeLa cells measured and treated as in (F). (I, J) Radiolabeling was performed for 6 h in HeLa cells transfected as in (C) to measure de novo purine synthesis (14C-glycine) (I) or pyrimidine synthesis activity (14C-aspartate) (J). (C)-(J) The data are graphed as the means ± SDs of biological triplicates and are representative of at least two independent experiments. *p < 0.05, by two-tailed Student’s t-test for pairwise comparisons.
Figure 3.
Figure 3.. Growth factor signaling stimulates SLC4A7 expression and promotes bicarbonate uptake to promote nucleotide synthesis.
(A) Relative incorporation of radiolabels from 14C-glycine or 14C-aspartate (3 h labeling) into RNA from HeLa cells serum starved for 15 h and stimulated or not with insulin (100 nM) for 3 h in the presence of the indicated concentration of NaHCO3 (g/L). (B) NaHCO3 uptake in HeLa cells serum starved for 15 h and stimulated or not with insulin (100 nM) over a time course. (C) Immunoblots of HeLa cells serum starved for 15 h and stimulated or not with Insulin (100 nM) over a time-course. (D, E) Immunoblots of HeLa cells serum starved for 15 h and stimulated or not with IGF1 (50 nM) (D) or EGF (50 ng/mL) (E) over a time-course (F) Immunoblots of HeLa cells validating SLC4A7 loss (ΔSLC4A7) after gene editing through CRISPR-Cas9. NaHCO3 uptake in wild-type or ΔSLC4A7 HeLa cells serum starved for 15 h and stimulated or not with Insulin (100 nM) or IGF1 (50 nM) for 2 h and labeled for 5 min with Na+, 14C-HCO3 to measure. Uptake measurements are shown as relative to the vehicle-treated wildtype cell line. (G) Illustration of the carbon and nitrogen from glycine and aspartate incorporated into the purine and pyrimidine ring, respectively. (H) Normalized peak areas of 13C, 15N-labeled purine intermediates measured via LC-MS/MS in wild-type and ΔSLC4A7 HeLa cells, serum starved for 15 h and stimulated with insulin for 6 h and labeled with 13C2-15N-glycine (M+3) for the last hour. (I) Normalized peak areas of 13C-labeled pyrimidine intermediates measured and treated as in (H) but stimulated with insulin for 2 h and labeled with 4-13C-aspartate (M+1) for the last hour. (J) Wild-type and ΔSLC4A7 HeLa cells were serum starved for 15 h and stimulated or not with insulin (100 nM) for 2 h in the presence of the indicated radiotracers. (A), (B), (F), (H)-(J) The data are plotted as the means ± SDs of biological triplicates and are representative of at least two independent experiments. *p < 0.05, by one-way ANOVA with Tukey’s post hoc test for multiple pairwise comparisons.
Figure 4.
Figure 4.. mTORC1 stimulates SLC4A7 protein abundance and bicarbonate uptake to promote de novo nucleotide synthesis.
(A) Schematic illustrating the convergence of Akt and ERK signaling on the TSC-mTORC1 axis. (B) Immunoblots of serum-deprived wild-type or ΔTSC2 HeLa cells for 15 h and treated with vehicle (DMSO) or rapamycin (20 nM) for 3 h. (C, D) Immunoblots of HeLa (C) or human angiomyolipoma (AML) 621–102 TSC2−/− (D) cells prepared as in (B) but treated with rapamycin (20 nM) over a time course. (E) NaHCO3 uptake from serum-deprived wild-type or ΔTSC2 HeLa cells treated with vehicle (DMSO) or rapamycin (20 nM) for 3 h. (F) Illustration of the nitrogen from glutamine incorporated into the purine and pyrimidine rings. (G) Normalized peak areas of 15N-glutamine measured via LC-MS/MS in HeLa cells transfected with siRNA targeting SLC4A7 or nontargeting controls after labeling cells with 15N-(amide)-glutamine for 1 h. (H) Normalized peak areas of 15N-labeled purine intermediates measured via LC-MS/MS in HeLa cells transfected with siRNA targeting SLC4A7 or nontargeting treated as in (F). (I) Normalized peak areas of 15N-labeled pyrimidine intermediates measured as in (F) and (G). (J) Schematic of the carbons from glycine, aspartate and bicarbonate incorporated into the purine and pyrimidine rings. (K) Relative incorporation of 14C from HCO3, glycine, aspartate into RNA. 48 h after transfection with SLC4A7 siRNAs or nontargeting controls, wild-type or ΔTSC2 HeLa cells were serum starved for 15 h and labeled with the indicated radiotracers for 6 h. (E),(G),(H)-(K) The data are plotted as the means ± SDs of biological triplicates and are representative of at least two independent experiments. *p < 0.05, by one-way ANOVA with Tukey’s post hoc test for multiple pairwise comparisons (E)-(I).
Figure 5.
Figure 5.. mTORC1-S6 kinase promotes SLC4A7 mRNA translation through the control of eIF4B phosphorylation.
(A) Immunoblots of wild-type or ΔTSC2 HeLa cells transfected with siRNA targeting S6K1, S6K2, both or nontargeting controls for 48 h followed by a 15 h serum starvation. (B) Immunoblots of wild-type or ΔTSC2 HeLa cells grown in serum depleted condition for 15 h and treated with either vehicle (DMSO) or S6K1 inhibitor (S6K1i, PF470871 10 μM). (C) Immunoblots of wild-type HEK293E cells transfected with empty vector (EV), wild-type S6K1 (S6K1-WT) or constitutively active S6K1 (S6K1-CA) for 36 h and grown in serum depleted condition for 15 h. (D) Immunoblots of ΔTSC2 HeLa cells grown in serum-depleted condition for 15 h and treated with either vehicle (DMSO) or cycloheximide (CHX, 10 μM) over a time-course. (E) Schematic illustrating the role of the S6K-eIF4 complex in the regulation of mRNA translation downstream of mTORC1 signaling. (F) Analysis of the Gibbs free energy (ΔG) of 5′ UTR of mRNA. (G) Immunoblots of wild-type or ΔTSC2 HeLa cells transfected with siRNA targeting eIF4A, eIF4B, both or nontargeting controls for 48 h. (H) Immunoblots of ΔTSC2 HEK293E cells transfected with empty vector, wild-type eIF4B, eIF4B S422A, or eIF4B S406A for 36 h and serum starved for 15 h prior to protein extraction. (I) Relative incorporation of 14C from HCO3 into RNA from wild-type or ΔTSC2 HEK293E cells treated as in (H) and serum starved for 15 h and incubated for 6 h in the presence of the Na+, 14C-HCO3. (J) qPCR analysis of sucrose-gradient polysome fractions of ΔTSC2 HeLa cells treated with vehicle (DMSO) or rapamycin (20 nM) for 3 hours. (K) qPCR analysis of sucrose-gradient polysome fractions of ΔTSC2 HeLa cells transfected with siRNA targeting eIF4A/B or nontargeting controls for 48 h. (L) Model of regulation and function of SLC4A7 downstream of mTORC1 signaling. (I)-(K) The data are plotted as the means ± SDs of biological triplicates. (A)-(D), (G), (H) are representative of at least two independent experiments *p < 0.05, by one-way ANOVA with Tukey’s post hoc test for multiple pairwise comparisons (I).
Figure 6.
Figure 6.. SLC4A7 is required for tumor growth and de novo nucleotide synthesis in tumors.
(A) Indicated wild-type or ΔSLC4A7 cell lines were transfected with either empty vector or SLC4A7 cDNA for 48 h and grown in 1 % serum (CAL-51 and A549 cells) or 10 % dialyzed serum (HEK293E and HeLa cells) for 72 h, and cell number was measured via crystal violet staining every 24 h. (B, C) AML 621–102 (TSC2−/− cells) (B), wild-type and ΔTSC2 HeLa cells (C) grown in 1 % serum for 72 h (B) or 96 h (C), and cell number was measured via crystal violet staining every 24 h. (D) Wild-type and ΔSLC4A7 CAL-51 cells treated with vehicle or rapamycin (20 nM) for 96 h, and cell number was measured via crystal violet staining every 24 h. (E) Soft agar colony formation assay with indicated cells treated with vehicle (DMSO) or rapamycin (10 nM) for three weeks. Cell images were acquired at 3× magnification. Colony quantification from three independent biological replicates is shown. (F) Workflow for the xenograft and in vivo 15N-(amide)-glutamine stable isotope tracing experiments. (G) Wild-type and ΔSLC4A7 CAL-51 cells were subcutaneously injected into athymic nude mice (n = 5 per group). Mice were treated with vehicle or rapamycin (1 mg/kg), and tumor volume was monitored over time. (H, I) Mice bearing wild-type or ΔSLC4A7 CAL-51-derived tumors (n = 5) injected with 15N-glutamine (0.8 g/kg) through the intraperitoneal route for 60 min prior to tumor collection and metabolite extraction and analysis via LC-MS/MS. (A)-(E) The data are plotted as the means ± SDs of biological triplicates and are representative of at least two independent experiments. *p < 0.05, by two-tailed Student’s t-test for pairwise comparisons (B) or one-way ANOVA with Tukey’s post hoc test for multiple pairwise comparisons (A), (C)-(E), (G)-(I).

Comment in

References

    1. Ali ES, Sahu U, Villa E, O’Hara BP, Gao P, Beaudet C, Wood AW, Asara JM, and Ben-Sahra I (2020). ERK2 Phosphorylates PFAS to Mediate Posttranslational Control of De Novo Purine Synthesis. Mol Cell 78, 1178–1191.e1176. - PMC - PubMed
    1. Amici DR, Jackson JM, Truica MI, Smith RS, Abdulkadir SA, and Mendillo ML (2021). FIREWORKS: a bottom-up approach to integrative coessentiality network analysis. Life Sci Alliance 4. - PMC - PubMed
    1. Andrejeva G, and Rathmell JC (2017). Similarities and Distinctions of Cancer and Immune Metabolism in Inflammation and Tumors. Cell Metab 26, 49–70. - PMC - PubMed
    1. Aoi W, and Marunaka Y (2014). Importance of pH homeostasis in metabolic health and diseases: crucial role of membrane proton transport. Biomed Res Int 2014, 598986. - PMC - PubMed
    1. Ben-Sahra I, Howell JJ, Asara JM, and Manning BD (2013). Stimulation of de novo pyrimidine synthesis by growth signaling through mTOR and S6K1. Science (New York, N.Y.) 339, 1323–1328. - PMC - PubMed

Publication types

MeSH terms