. 2022 Sep;609(7928):741-746.
doi: 10.1038/s41586-022-05012-5. Epub 2022 Jun 30.

Surface-to-space atmospheric waves from Hunga Tonga-Hunga Ha'apai eruption

Affiliations

Surface-to-space atmospheric waves from Hunga Tonga-Hunga Ha'apai eruption

Corwin J Wright et al. Nature. 2022 Sep.

Abstract

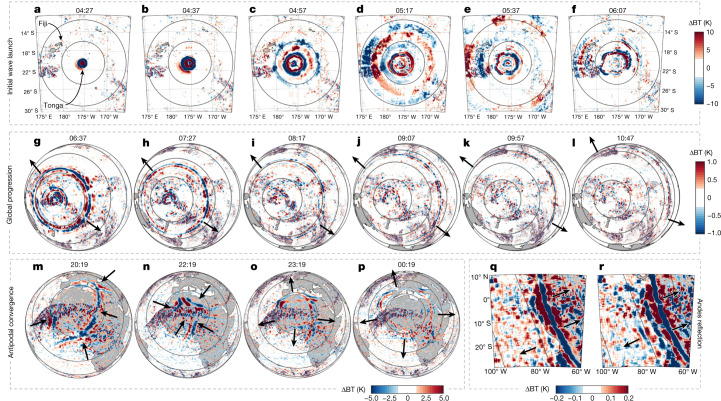
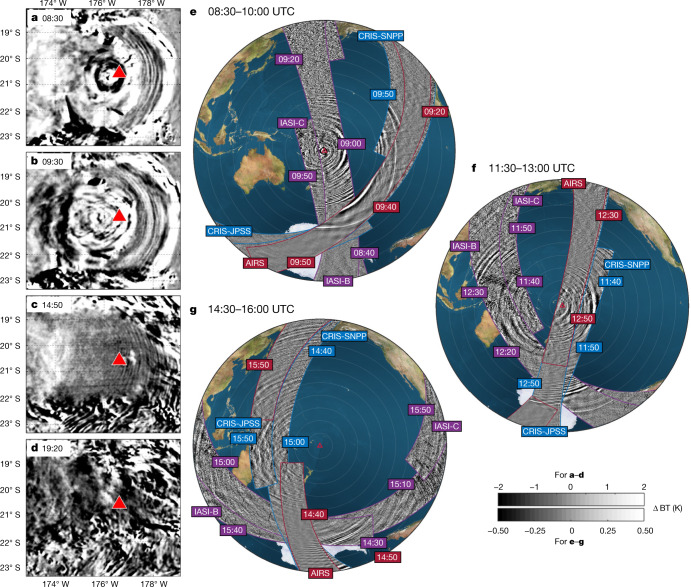
The January 2022 Hunga Tonga-Hunga Ha'apai eruption was one of the most explosive volcanic events of the modern era1,2, producing a vertical plume that peaked more than 50 km above the Earth3. The initial explosion and subsequent plume triggered atmospheric waves that propagated around the world multiple times4. A global-scale wave response of this magnitude from a single source has not previously been observed. Here we show the details of this response, using a comprehensive set of satellite and ground-based observations to quantify it from surface to ionosphere. A broad spectrum of waves was triggered by the initial explosion, including Lamb waves5,6 propagating at phase speeds of 318.2 ± 6 m s-1 at surface level and between 308 ± 5 to 319 ± 4 m s-1 in the stratosphere, and gravity waves7 propagating at 238 ± 3 to 269 ± 3 m s-1 in the stratosphere. Gravity waves at sub-ionospheric heights have not previously been observed propagating at this speed or over the whole Earth from a single source8,9. Latent heat release from the plume remained the most significant individual gravity wave source worldwide for more than 12 h, producing circular wavefronts visible across the Pacific basin in satellite observations. A single source dominating such a large region is also unique in the observational record. The Hunga Tonga eruption represents a key natural experiment in how the atmosphere responds to a sudden point-source-driven state change, which will be of use for improving weather and climate models.


Conflict of interest statement

The authors declare no competing interests.

Figures

Fig. 1
Fig. 1. Initial Lamb wave propagation in the troposphere.
Brightness temperature changes (ΔBT) observed by GOES (al), the Meteosat Spinning Enhanced Visible and InfraRed Imager (SEVIRI) (mp) and GOES-EAST (q,r). Range rings indicate distance from Hunga Tonga in 500 km (af) and 2,000 km (gr) steps. To reduce noise from weather systems, global and antipodal panels have been processed with a 200-km-radius Wiener filter, and Andes panels with a 400 km boxcar and 72-km-radius Wiener filter. Black arrows indicate approximate wave location and propagation direction. All times are UTC.
Fig. 2
Fig. 2. Initial gravity wave and Lamb wave propagation at all heights.
a, Combined measurements of the initial wave release as observed by multiple platforms, listed with their approximate altitudes at right and at times as indicated by overlaid text labels. c,d, Pressure (c) and TEC (d) distance/time series are reproduced as Extended Data Figs. 1d and 3, respectively. Note that AIRS, CrIS and IASI all measure the same three stratospheric altitude channels, but only one is used here from each instrument to show all levels while maintaining visual clarity; owing to the long vertical wavelengths of the observed waves, all three levels are near-identical. b, A northward view containing the Lamb wavefront at 09:20 UTC, around 30 min after the wave passed overhead. cp, phase speed; GNSS, global navigation satellite system; JPSS, Joint Polar Satellite System; SNPP, Suomi National Polar-orbiting Partnership. Airglow image: NSF NoirLab.
Fig. 3
Fig. 3. Post-eruption gravity wave activity.
ag, Activity in and around the volcanic plume as observed by GOES (ad) and over the entire Pacific basin as observed by AIRS, CrIS and IASI (eg). For eg, coloured labels indicate individual satellite overpass times for context, with AIRS labelled in red, CrIS in blue and IASI in purple. Note that the colour scales in a and b saturate significantly and values extend to ±8 K.
Extended Data Fig. 1
Extended Data Fig. 1. Eruptive energy and Lamb wave speed derived from surface pressure changes.
ad, Estimates of (a) Lamb-wave-induced pressure anomaly, (b) eruption explosive energy, (c) Lamb wave phase speed and (d) time of primary explosion, as computed from surface pressure data. e, Time series of measured pressure anomaly at Broome, Australia. Data in all cases are derived from surface pressure stations, with the exception of reference values for other eruptions which are derived from ref. . Error bars on panels ab are conservatively set to 0.5 hPa.
Extended Data Fig. 2
Extended Data Fig. 2. Reprocessed data for the 1991 Pinatubo eruption show evidence of gravity wave activity in the eruptive plume.
Brightness temperature measurements over the 1991 Pinatubo eruption plume, as observed by the Advanced Very High Resolution Radiometer. Phase fronts can be seen faintly in the cloud radiating from a point slightly west of Pinatubo.
Extended Data Fig. 3
Extended Data Fig. 3. Evidence of waves in the ionosphere over New Zealand and North America triggered by the Hunga Tonga eruption.
Time-distance plots of ionospheric disturbances over New Zealand and the United States, computed from GNSS-TEC perturbation data. a, TEC perturbations as a function of distance from Hunga Tonga and time over New Zealand. b, Surface pressure at Tonga, approximately 60 km from Hunga Tonga. c, TEC perturbations as a function of distance and time over North America. d, Cross-section through panel a for selected period.
Extended Data Fig. 4
Extended Data Fig. 4. The waves generated by the eruption propagated up to the mesosphere and travelled horizontally at speeds consistent with their types.
a, Lamb wave as observed by CIPS (centred at 24°S 309°E, 12 300 km from Hunga Tonga, and recorded 10.75 h after the eruption). In these data, the Lamb wave is extremely close to the instrument noise floor and statistical tests were carried out to confirm that the small signal seen is consistent with the expected speed and wavelength of the Lamb wave. b, Time-distance spectrum derived from GOES 10 um channel, with Hunga Tonga located at the origin. Red solid line identifies the primary Lamb wave, red dashed lines identify weaker secondary Lamb waves, and yellow dashed lines outline the limits of the dispersive gravity waves in the initially released packet.
Extended Data Fig. 5
Extended Data Fig. 5. Spectral analysis provides quantitative details of stratospheric waves generated by the eruption.
2D S-Transform (2DST) estimates of gravity wave properties measured by AIRS in a descending-node pass over the Pacific Ocean on the 15th of January 2022. a, Temperature perturbations relative to a fourth-order polynomial fit across track. b, amplitudes estimated from these perturbations using the 2DST. c, Horizontal wavelengths estimated from these perturbations using the 2DST.
Extended Data Fig. 6
Extended Data Fig. 6. The gravity waves generated by the eruption travelled close to their maximum phase speed limit.
Expected maximum speed of a gravity wave packet relative to the observed Lamb wave, as a function of horizontal gravity wave wavelength. Blue line thickness represents the range of Lamb wave propagation speeds that we compute from AIRS, with the fast edge being approximately equal to the speed of the surface pressure signal. Orange lines represent the fast limit of gravity wave phase speeds versus horizontal wavelength, which is in the limit that the vertical wavenumber —>0. This has been calculated using the upper and lower Lamb wave speeds as the sound speed for this calculation, shown as two closely overlaid orange lines.
Extended Data Fig. 7
Extended Data Fig. 7. Gravity waves produced by the eruption traversed the entire globe and dominated the Pacific basin following the eruption.
ac, Transit of the leading gravity wave packet over the antipode in CrIS and AIRS 4.3 μm data. (do, GW amplitudes over Pacific computed from AIRS, IASI and CrIS 4.3 μm data using the 2DST.
Extended Data Fig. 8
Extended Data Fig. 8. Surface pressure data show evidence of multiple subsequent explosions.
Surface pressure station measurements from 04:00–12:00 UTC from Tonga, approximately 64 km from Hunga Tonga. Note the multiple explosions after the initial primary Lamb wave trigger.
Extended Data Fig. 9
Extended Data Fig. 9. Water vapour observations are consistent with our proposed eruptive energy transfer mechanism.
1x1 degree maps of IASI-B and IASI-C water vapour mixing ratio at the 2, 10 and 20 hPa levels for the 15th of January 2021, using nighttime data. ac, show the data as absolute values and df as a difference from the local mean for January 2021. White squares indicate a lack of data owing to retrieval failure, most likely due to the highly anomalous atmospheric state associated with the eruption plume.
Extended Data Fig. 10
Extended Data Fig. 10. The Lamb wave shows evidence of slowing down over South America.
Filtered data from GOES’ IR channel showing the Lamb wave (strong blue/red/blue alternating lines) before (left) and after (right) passage over South America. Overlaid grey line shows the the expected location of the phase front assuming uniform progression. An increased deviation from this expected line is seen in the portion of the wave which passed over the northern half of South America.

Comment in

References

    1. Poli, P. & Shapiro, N. M. Rapid characterization of large volcanic eruptions: measuring the impulse of the Hunga Tonga explosion from teleseismic waves. ESSOAr10.1002/essoar.10510358.1 (2022).
    1. Pyle, D. M. in The Encyclopedia of Volcanoes (eds Sigurdsson, H. et al.) 263–269 (Elsevier, 2000).
    1. Carr JL, Horvath A, Wu DL, Friberg MD. Stereo plume height and motion retrievals for the record-setting Hunga Tonga-Hunga Ha’apai eruption of 15 January 2022. Geophys. Res. Lett. 2022;49:e2022GL098131. doi: 10.1029/2022GL098131. - DOI
    1. Harrison G. Pressure anomalies from the January 2022 Hunga Tonga‐Hunga Ha’apai eruption. Weather. 2022;77:87–90. doi: 10.1002/wea.4170. - DOI
    1. Garrett CJR. Atmospheric edge waves. Q.J Royal Met. Soc. 1969;95:731–753. doi: 10.1002/qj.49709540607. - DOI

Publication types