. 2022 Jun 30;13(1):3766.
doi: 10.1038/s41467-022-31421-1.

Reconstruction of a catalogue of genome-scale metabolic models with enzymatic constraints using GECKO 2.0

Affiliations

Reconstruction of a catalogue of genome-scale metabolic models with enzymatic constraints using GECKO 2.0

Iván Domenzain et al. Nat Commun. .

Abstract

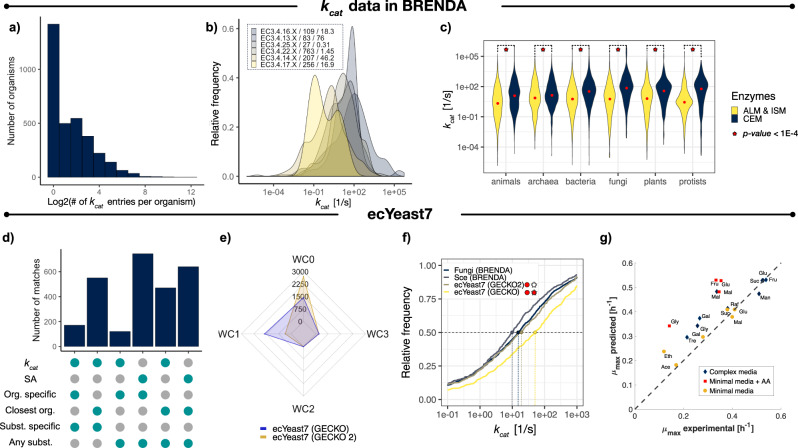
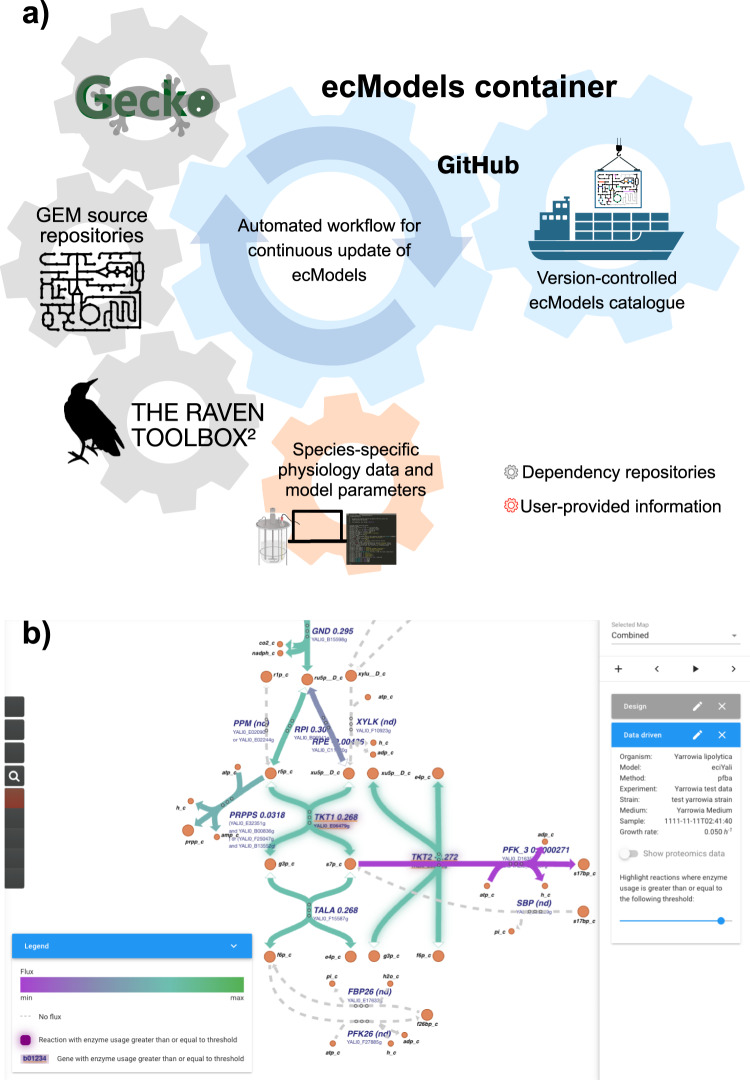
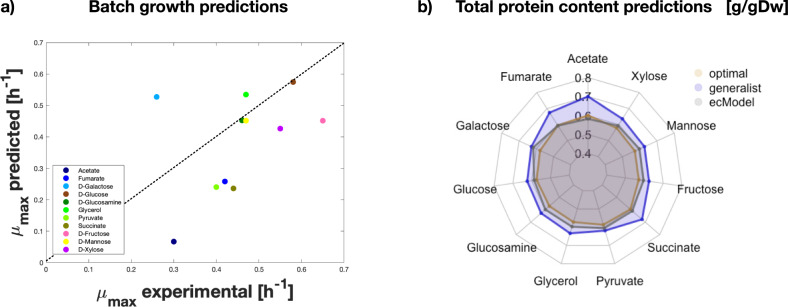
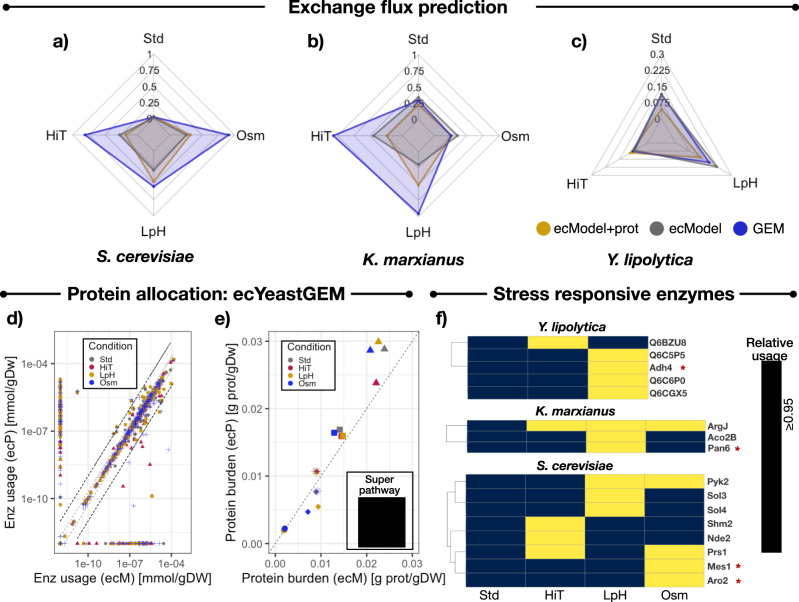
Genome-scale metabolic models (GEMs) have been widely used for quantitative exploration of the relation between genotype and phenotype. Streamlined integration of enzyme constraints and proteomics data into such models was first enabled by the GECKO toolbox, allowing the study of phenotypes constrained by protein limitations. Here, we upgrade the toolbox in order to enhance models with enzyme and proteomics constraints for any organism with a compatible GEM reconstruction. With this, enzyme-constrained models for the budding yeasts Saccharomyces cerevisiae, Yarrowia lipolytica and Kluyveromyces marxianus are generated to study their long-term adaptation to several stress factors by incorporation of proteomics data. Predictions reveal that upregulation and high saturation of enzymes in amino acid metabolism are common across organisms and conditions, suggesting the relevance of metabolic robustness in contrast to optimal protein utilization as a cellular objective for microbial growth under stress and nutrient-limited conditions. The functionality of GECKO is expanded with an automated framework for continuous and version-controlled update of enzyme-constrained GEMs, also producing such models for Escherichia coli and Homo sapiens. In this work, we facilitate the utilization of enzyme-constrained GEMs in basic science, metabolic engineering and synthetic biology purposes.


Conflict of interest statement

The authors declare no competing interests.

Figures

Fig. 1
Fig. 1. kcat distributions in BRENDA and ecYeast7.
a Number of kcat entries in BRENDA per organism. b kcat distributions for closely related enzyme families. Sample size and median values (in s−1) are shown after each family identifier. c kcat distributions for enzymes in BRENDA by metabolic context and life kingdoms. Median values are indicated by red dots in each distribution, statistical significance (under a one-sided Kolmogorov–Smirnov test) is indicated by red stars for each pair of distributions for a given kingdom. CEM—central carbon and energy metabolism; ALM—Amino acid and lipid metabolism; ISM—intermediate and secondary metabolism. Computed P-values are 2.8 × 10–27 for animals; 3.85 × 10–5 for archaea; 1.62 × 10–92 for bacteria; 1.024 × 10–30 for fungi; 2.36 × 10–16 for plants and 4.75 × 10–21 for protists. d Number of kcat matches in ecYeast7 per assignment category (GECKO 2.0). e Comparison of the number of kcat matches for E.C. numbers with 0, 1, 2, and 3 introduced wildcards by GECKO 2.0 and GECKO kcat matching algorithms. f Cumulative kcat distributions for: all S. cerevisiae entries in BRENDA, all entries for fungi in BRENDA, ecYeast7 enhanced by GECKO and ecYeast7 enhanced by GECKO 2.0. Colored points and vertical dashed lines indicate the median value for each distribution. Statistical significance under a two-sided Kolmogorov–Smirnov test of the matched kcat distributions when compared to all entries for S. cerevisiae and fungi, is shown with red circles and stars, respectively. P-values below 1 × 10−2 are indicated with red. Computed P-values are 0.538 for the comparison between GECKO2 vs. all fungi, 2.7 × 10−3 for GECKO2 vs. S. cerevisiae, 3.9 × 10−8 for GECKO vs. all fungi and, 2.1 × 10−11 for GECKO vs. the S. cerevisiae entries. g Prediction of batch maximum growth rates on diverse media with ecYeast7 enhanced by GECKO 2.0. Glu—glucose, Fru—fructose, Suc—sucrose, Raf— raffinose, Mal—maltose, Gal—galactose, Tre—trehalose, Gly—glycerol, Ace—acetate, Eth —ethanol. Source data are provided in Source Data: Data Source file 1.
Fig. 2
Fig. 2. Extending utilization of ecModels.
a ecModels container: Integrated pipeline for continuous and automated update of ecModels. b Implementation of GECKO simulations in the Caffeine platform (https://caffeine.dd-decaf.eu/) for visualization of enzyme usage. The color of the arrows corresponds to the value of the corresponding fluxes. Genes or reactions connected to enzymes with a usage above 90% are highlighted with a glow around the corresponding text or arrow, respectively. The chosen usage threshold to highlight can be tuned with the slider on the right.
Fig. 3
Fig. 3. Comparison of predictive capabilities between eciML1515 and ME-iJL1678 for E. coli.
a Maximum batch growth rate predictions on minimal media with diverse carbon sources, with an average relative error for eciML1515 of 34,43%, and an R2 of 0.196. The sum of squared errors when compared to experimental values are 0.2785 for eciML1515 and 1.21 for ME-iJL1678. b Prediction of total protein content in the cell by eciML1515 and ME-iJL1678 using the optimal and generalist approaches. Source data are provided in Source Data: Data Source file 1.
Fig. 4
Fig. 4. Evaluation of proteomics-constrained ecModels.
Comparison of median relative error in prediction of exchange fluxes for O2 and CO2 by GEMs, ecModels and proteomics-constrained ecModels across diverse conditions (chemostat cultures at 0.1 h−1 dilution rate) for a S. cerevisiae, b K. marxianus, c Y. lipolytica. d Comparison of absolute enzyme usage profiles [mmol/gDw] predicted by ecYeastGEM (ecM) and ecYeastGEM with proteomics constraints (ecP) for several experimental conditions. The region between the two dashed gray lines indicates enzyme usages predicted in the interval 0.5 EiecP/EiecM 2, the region between the two dashed black lines indicates enzyme usages predicted in the interval 0.1 EiecP/EiecM 10, when comparing the two ecModels. e Protein burden for different superpathways predicted by ecYeastGEM (ecM) and ecYeastGEM with proteomics constraints (ecP). f Highly saturated enzymes at different stress conditions for S. cerevisiae, K. marxianus, and Y. lipolytica predicted by their corresponding ecModels constrained with proteomics data. Yellow cells indicate condition-responsive enzymes (relativeusage ≥ 0.95). Red asterisks indicate enzymes conserved as single copy orthologs across the three yeast species. Std—Reference condition, HiT—high-temperature condition, LpH—Low pH condition, Osm—Osmotic stress condition, AA—amino acid metabolism, NUC—nucleotide metabolism, CEM—central carbon and energy metabolism, CofVit—cofactor and vitamin metabolism, Lip—lipid and fatty acid metabolism. Source data are provided in Source Data: Data Source File 2.
Fig. 5
Fig. 5. Cumulative distributions of flux variability ranges for iSM996, iYali4 and iML1515 compared to their respective enzyme-constrained versions at low and high growth rates.
Source data are provided in the Source Data: Data Source File 3.

References

    1. Lu H, et al. A consensus S. cerevisiae metabolic model Yeast8 and its ecosystem for comprehensively probing cellular metabolism. Nat. Commun. 2019;10:3586. doi: 10.1038/s41467-019-11581-3. - DOI - PMC - PubMed
    1. Robinson, J. L. et al. An atlas of human metabolism. Sci. Signal. 13, eaaz1482 (2020). - PMC - PubMed
    1. Tiukova IA, Prigent S, Nielsen J, Sandgren M, Kerkhoven EJ. Genome‐scale model of Rhodotorula toruloides metabolism. Biotechnol. Bioeng. 2019;116:3396–3408. doi: 10.1002/bit.27162. - DOI - PubMed
    1. Monk JM, et al. iML1515, a knowledgebase that computes Escherichia coli traits. Nat. Biotechnol. 2017;35:904–908. doi: 10.1038/nbt.3956. - DOI - PMC - PubMed
    1. Kerkhoven EJ, Pomraning KR, Baker SE, Nielsen J. Regulation of amino-acid metabolism controls flux to lipid accumulation in Yarrowia lipolytica. NPJ Syst. Biol. Appl. 2016;2:16005. doi: 10.1038/npjsba.2016.5. - DOI - PMC - PubMed

Publication types

Supplementary concepts