. 2022 Jun 30;13(6):576.
doi: 10.1038/s41419-022-05028-9.

Dihydroorotate dehydrogenase inhibition reveals metabolic vulnerability in chronic myeloid leukemia

Affiliations

Dihydroorotate dehydrogenase inhibition reveals metabolic vulnerability in chronic myeloid leukemia

Mohammad Houshmand et al. Cell Death Dis. .

Abstract

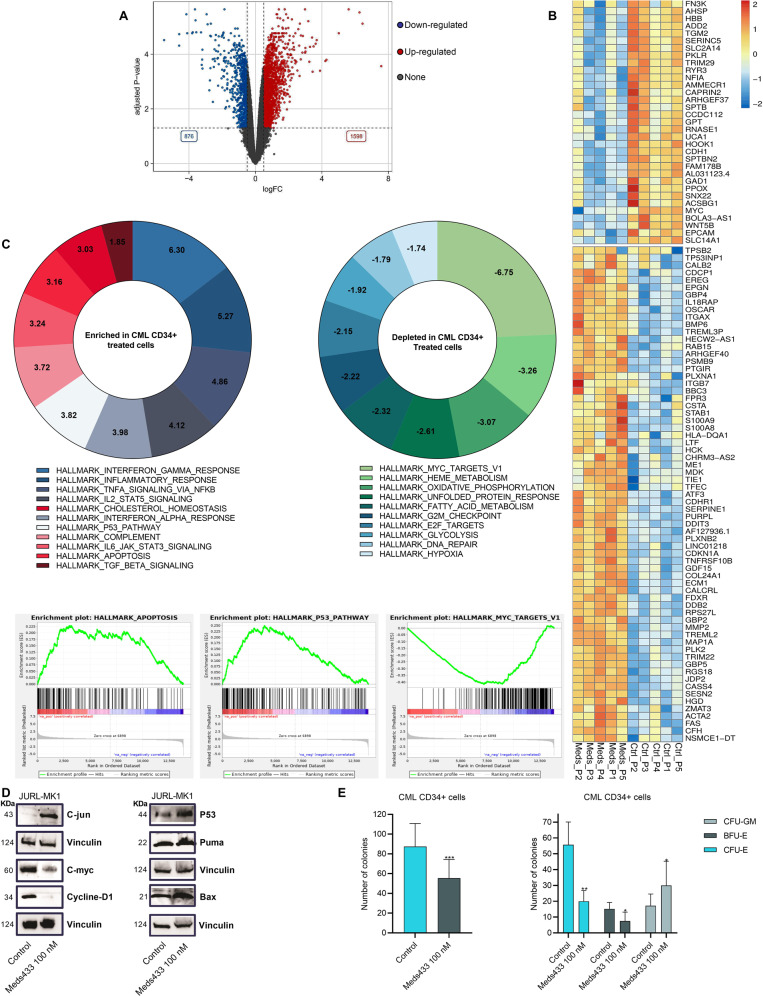
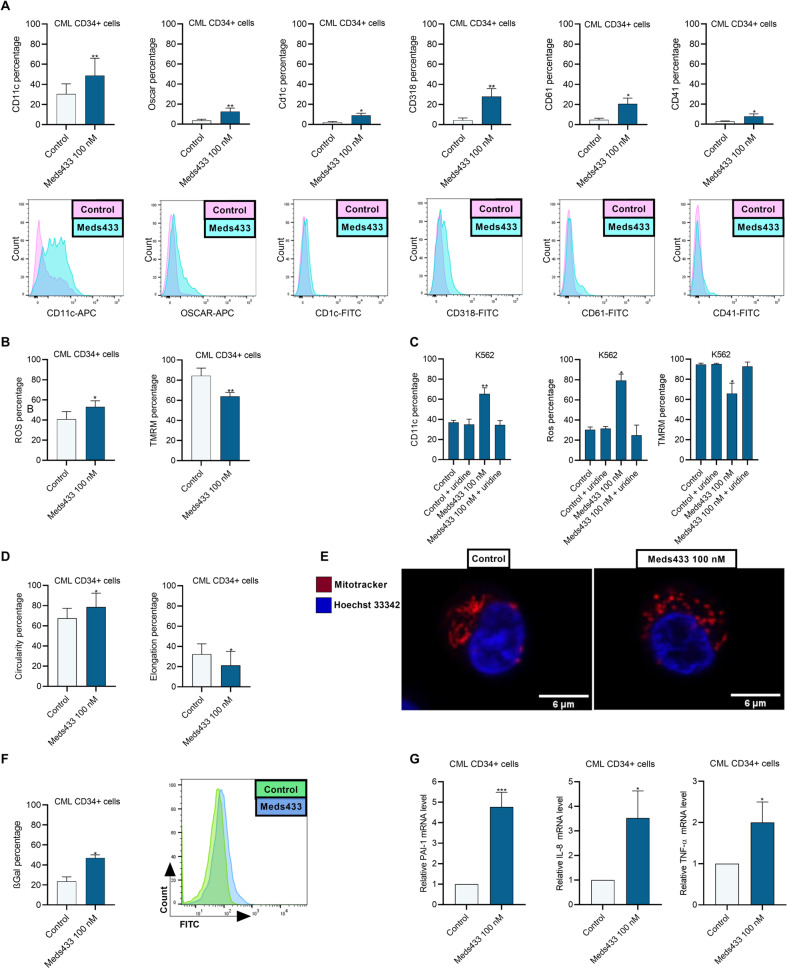
The development of different generations of BCR-ABL1 tyrosine kinase inhibitors (TKIs) has led to the high overall survival of chronic myeloid leukemia (CML) patients. However, there are CML patients who show resistance to TKI therapy and are prone to progress to more advanced phases of the disease. So, implementing an alternative approach for targeting TKIs insensitive cells would be of the essence. Dihydroorotate dehydrogenase (DHODH) is an enzyme in the de novo pyrimidine biosynthesis pathway that is located in the inner membrane of mitochondria. Here, we found that CML cells are vulnerable to DHODH inhibition mediated by Meds433, a new and potent DHODH inhibitor recently developed by our group. Meds433 significantly activates the apoptotic pathway and leads to the reduction of amino acids and induction of huge metabolic stress in CML CD34+ cells. Altogether, our study shows that DHODH inhibition is a promising approach for targeting CML stem/progenitor cells and may help more patients discontinue the therapy.


Conflict of interest statement

The authors declare no competing interests.

Figures

Fig. 1
Fig. 1. DHODH inhibition induces apoptosis in CML.
A represents the positive cell percentage of Annexin V/PI subsets. The results were obtained in newly diagnosed CML CD34+ (n:6) patients’ cells after treatment with various concentrations of Meds433 for 3 days. Also, flow cytometry graphs of one treated CML CD34+ cells are shown in the A right panel. B represents the effect of Meds433 on resistant CML CD34+ cells (n:4) which is shown by the positive cell percentage of Annexin V/PI subsets. C demonstrates apoptosis induction that is shown by positive cells’ percentage of Annexin V/PI subsets after treatment of K562 and CML-T1 with different concentrations of Meds433 and BQ for 3 days (n:3). D shows Western blot analysis of PARP1 and Caspase 3 after treatment of K562 and CML-T1 with 100 nM Meds433 for 3 days (n:3). E shows uridine level based on RLU in the cell lysate of K562 cells after treatment with 100 nM Meds433 for 2 and 3 days (n:3). RLU inversely correlates with the uridine level in cells. F displays the kinetic of apoptosis after treatment of K562 and CML-T1 with 100 nM Meds433 (n:3). G represents uridine rescue that was measured using Annexin V/PI in K562 and CML-T1 after the addition of exogenous uridine at the concentration of 100 µM (n:3). The addition of uridine activates the salvage pyrimidine pathway and hampers activation of the de novo pyrimidine biosynthesis pathway. *p < 0.05, **p < 0.01, ***p < 0.001, ****p < 0.0001, *****p < 0.00001.
Fig. 2
Fig. 2. Effect of DHODH inhibition on cell cycle and cell growth rate.
A displays cell growth rate by CCK8 assay in K562 and CML-T1 treated with Meds433 and BQ for 3 days (n:3). To calculate the cell growth rate, OD values were subtracted from the blank. Then, the OD values of treated cells were normalized to the OD values of the control group. B demonstrates IC50 of Meds433 and BQ in K562- and CML-T1-treated cells using cell growth data. C shows rescue of cell growth inhibition in CML cell lines in the presence of exogenous uridine at the concentration of 100 µM after 3 days of treatment (n:3). D displays kinetic of cell growth rate after the treatment of K562 and CML-T1 with 100 nM Meds433 obtained by CCK8 assay (n:3). E shows proliferation index in CML CD34+ cells (n:3) treated with different concentrations of Meds433 for 3 days and flow cytometry graphs of one treated patient (right panel). The proliferation index is considered as the total number of cell divisions divided by the number of cells that underwent division. F demonstrates cell cycle analysis in CML CD34+ cells (n:6), two different CML cell lines (n:3), and flow cytometry graphs for one patient CD34+ cells treated with Meds433 for 3 days. At a high concentration of 1 µM, the number of live cells was less than at the lower concentrations. This might cause a dissimilarity between the percentage of G1/S/G2M at the concentration of 1 µM in comparison to 100 nM Meds433. *p < 0.05, **p < 0.01. ***p < 0.001.
Fig. 3
Fig. 3. Meds433 impedes tumor growth in 3D co-culture and xenograft mice.
A shows mean fluorescent intensity (MFI) of CFSE-labeled CML-T1 treated with 100 nM Meds433 for 3 days in a 3D co-culture platform (n:3) (a higher, mean fluorescent intensity, MFI, means that cells are non-proliferative while a lower MFI means that cells proliferate more and CFSE dye is divided between daughter cells). (B) demonstrates electron microscopy images of the 3D co-culture platform. B1 shows demineralized bone matrix (DBM) treated with collagen type 1. B2 shows mesenchymal stromal cells (MSCs) in the DBM scaffold. B3 shows the addition of labeled CML-T1 with CFSE to the MSCs in the scaffold. B4 displays a 3D co-culture condition treated with 100 nM Meds433. C, D represent KU-812-derived tumor mass volume and tumor weight after the treatment with 10 and 20 mg/kg Meds433, respectively. E represents the morphology of tumors treated with Meds433. Noteworthy, the administration of Meds433 20 mg/kg eliminated tumors in two mice. F shows tumor burden after the treatment with 10 and 20 mg/kg Meds433 in BM and spleen. G displays an immunohistochemical analysis of Ki67 expression in the vehicle, 10 mg/kg, and 20 mg/kg Meds433 treated mice (×20 magnification). Arrows indicate Ki67-positive cells and the number is related to tumors of each mouse displayed in E. H represents drug concentration and Glucoronoide as the drug metabolite in the plasma of treated mice. *p < 0.05, **p < 0.01, ***p < 0.001.
Fig. 4
Fig. 4. RNA-seq analysis following DHODH inhibition in CML.
A The volcano plot demonstrates the number of up- and down-regulated genes in CML CD34+ (n:5) patients’ cells after treatment with 100 nM Meds433 for 3 days. B The top 100 differentially expressed genes based on adjusted p value are depicted in the heatmap, and C shows enriched and depleted hallmark gene sets and three enrichment plots related to apoptosis, P53 pathway, and MYC targets. The number in the plots demonstrates a normalized enrichment score (NES). D demonstrates Western blot analysis of JURL-MK1 cell line treated with 100 nM Meds433 for 3 days (n:3). E shows CFU assay after the treatment of CML CD34+ (n:5) patients’ cells with Meds433. For this figure, the total number of colonies (CFU-GM + CFU-E + BFU-E) and the number of each subset are displayed. *p < 0.05, **p < 0.01, ***p < 0.001.
Fig. 5
Fig. 5. DHODH inhibition induces differentiation and disrupts mitochondria function in CML.
A shows the percentage of lineage-specific CD markers on gated live cells after the treatment of CML CD34+ (n:21) patients’ cells with Meds433 for 3 days. Also, flow cytometry graphs of each CD marker are shown below each bar chart. B demonstrates measurement of ROS and mitochondria cell membrane potential using flow cytometry analysis in CML CD34+ (n:5) patients’ cells treated with Meds433 for 3 days. C represents CD11c percentage, ROS production, and mitochondria membrane potential after the addition of exogenous uridine in K562 treated cells after 3 days of treatment (n:3). D shows percentage of mitochondria with circularity>0.8 and elongation>1.25 in CML CD34+ (n:4) patients’ cells after 3 days of treatment with 100 nM Meds433. Inverse circularity was used as a measure of mitochondrial elongation. A value of circularity = 0.8 was chosen as the threshold for circular mitochondria and elongation = 1.25 was chosen as the threshold for elongated mitochondria. The graph shows the percentages of circular mitochondria (with circularity >0.8) and elongated mitochondria (elongation > 1.25) induced by our treatment. E displays confocal images of one CML CD34+ sample treated with 100 nM Meds433 for 3 days, where the nucleus was labeled with Hoechst dye (blue) and mitochondria were labeled with Mitotracker (red). F shows the β-Gal percentage in CML CD34+ (n:3) patients’ cells measured by flow cytometry after DHODH inhibition for 3 days. For β-Gal analysis, live cells were gated. Also, a flow cytometry graph of one treated patient sample is shown. G demonstrates relative mRNA levels of PAI-1, IL-8, and TNF-α in treated CML CD34+ (n:3) with 100 nM Meds433 for 3 days. *p < 0.05, **p < 0.01, ***p < 0.001.
Fig. 6
Fig. 6. DHODH inhibition changes the metabolic profile in CML CD34+ cells.
A shows altered metabolites following treatment of CML CD34+ (n:5) with Meds433 for 3 days. B represents the micromolar concentration of some metabolites in treated and untreated CML CD34+ cells (these metabolites were selected based on their relevance to different biological effects caused by Meds433). C shows the relative mRNA level of DDIT3, p21, and GPT1 in K562 cells treated with 100 nM Meds433 and 1 µM BQ for 3 days (n:3). D shows the relative mRNA level of GPT1 in treated CML CD34+ (n:5) patients’ cells for 3 days. EG show the percentage of CD11c (n:4), ROS (n:4) production, and cell viability (n:3) in K562 and GPT1 overexpressed K562 after 3 days, respectively. Also, corresponding flow cytometry graphs of CD11c and ROS are shown. H, I demonstrate Pyruvate levels based on RFU in the supernatant and cell lysate of K562 and GPT1 overexpressed K562 after 2 and 3 days of the treatment, respectively. In E, F, H, and I, K562- and GPT1-treated Meds433 were not compared due to different levels of untreated groups. *p < 0.05, **p < 0.01, ***p < 0.001.

References

    1. Goldman JM, Melo JV. Targeting the BCR-ABL tyrosine kinase in chronic myeloid leukemia. N Engl J Med. 2001;344:1084–6. doi: 10.1056/NEJM200104053441409. - DOI - PubMed
    1. Legros L, Nicolini FE, Etienne G, Rousselot P, Rea D, Giraudier S, et al. Second tyrosine kinase inhibitor discontinuation attempt in patients with chronic myeloid leukemia. Cancer. 2017;123:4403–10.. doi: 10.1002/cncr.30885. - DOI - PubMed
    1. Loscocco F, Visani G, Galimberti S, Curti A, Isidori A. BCR-ABL independent mechanisms of resistance in chronic myeloid leukemia. Front Oncol. 2019;9:939. doi: 10.3389/fonc.2019.00939. - DOI - PMC - PubMed
    1. Barnes DJ, Palaiologou D, Panousopoulou E, Schultheis B, Yong AS, Wong A, et al. Bcr-Abl expression levels determine the rate of development of resistance to imatinib mesylate in chronic myeloid leukemia. Cancer Res. 2005;65:8912–9. doi: 10.1158/0008-5472.CAN-05-0076. - DOI - PubMed
    1. O’Hare T, Eide CA, Deininger MW. Bcr-Abl kinase domain mutations, drug resistance, and the road to a cure for chronic myeloid leukemia. Blood. 2007;110:2242–9. doi: 10.1182/blood-2007-03-066936. - DOI - PubMed

Publication types

MeSH terms

Substances