. 2022 Jun 30;13(1):3771.
doi: 10.1038/s41467-022-30931-2.

Inherited basis of visceral, abdominal subcutaneous and gluteofemoral fat depots

Affiliations

Inherited basis of visceral, abdominal subcutaneous and gluteofemoral fat depots

Saaket Agrawal et al. Nat Commun. .

Abstract

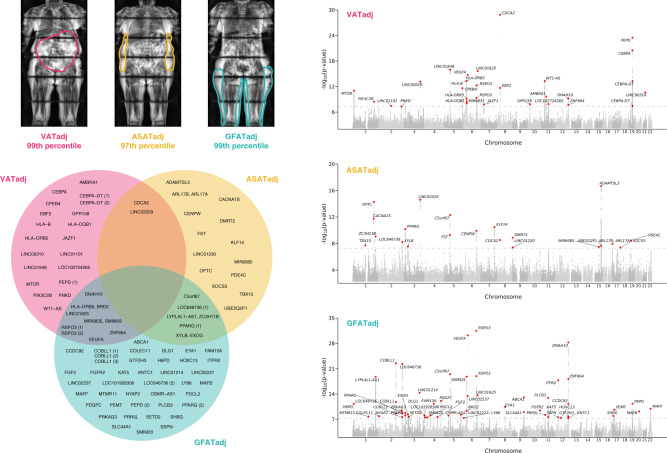
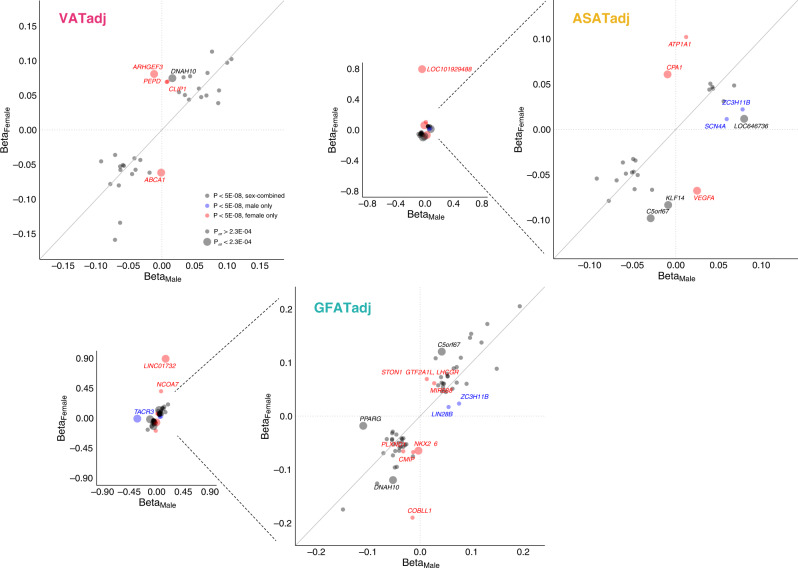
For any given level of overall adiposity, individuals vary considerably in fat distribution. The inherited basis of fat distribution in the general population is not fully understood. Here, we study up to 38,965 UK Biobank participants with MRI-derived visceral (VAT), abdominal subcutaneous (ASAT), and gluteofemoral (GFAT) adipose tissue volumes. Because these fat depot volumes are highly correlated with BMI, we additionally study six local adiposity traits: VAT adjusted for BMI and height (VATadj), ASATadj, GFATadj, VAT/ASAT, VAT/GFAT, and ASAT/GFAT. We identify 250 independent common variants (39 newly-identified) associated with at least one trait, with many associations more pronounced in female participants. Rare variant association studies extend prior evidence for PDE3B as an important modulator of fat distribution. Local adiposity traits (1) highlight depot-specific genetic architecture and (2) enable construction of depot-specific polygenic scores that have divergent associations with type 2 diabetes and coronary artery disease. These results - using MRI-derived, BMI-independent measures of local adiposity - confirm fat distribution as a highly heritable trait with important implications for cardiometabolic health outcomes.


Conflict of interest statement

S.A. has served as a scientific consultant to Third Rock Ventures. M.D.R.K., A.P., and P.B. are supported by grants from Bayer AG applying machine learning in cardiovascular disease. P.T.E. receives sponsored research support from Bayer AG and IBM and has consulted for Bayer AG, Novartis, MyoKardia and Quest Diagnostics. A.P. is also employed as a Venture Partner at GV and consulted for Novartis; and has received funding from Intel, Verily and MSFT. M.C. holds equity in Waypoint Bio and is a member of the Nestle Scientific Advisory Board. K.N. is an employee of IBM Research. P.B. serves as a consultant for Novartis. A.V.K. is an employee and holds equity in Verve Therapeutics; has served as a scientific advisor to Amgen, Maze Therapeutics, Navitor Pharmaceuticals, Sarepta Therapeutics, Novartis, Silence Therapeutics, Korro Bio, Veritas International, Color Health, Third Rock Ventures, Illumina, Foresite Labs, and Columbia University (NIH); received speaking fees from Illumina, MedGenome, Amgen, and the Novartis Institute for Biomedical Research; and received a sponsored research agreement from IBM Research. The remaining authors declare no competing interests.

Figures

Fig. 1
Fig. 1. Genome-wide association studies of VATadj, ASATadj, and GFATadj.
(Top left) Three female participants from the UK Biobank with similar age (67–70 years) and similar overweight BMI (27.6–28.6 kg/m2) with highly discordant fat distributions (right) Manhattan plots for sex-combined GWASs with VAT adjusted for BMI and height (VATadj), ASATadj, and GFATadj. Lead SNPs are described in Supplementary Data 3. (Bottom left) Overlap between VATadj, ASATadj, and GFATadj loci denoted by the nearest gene; lead SNPs of two traits in high LD (R2 ≥ 0.1) were plotted in the intersection. GWAS significance at a commonly used threshold of p < 5 × 10−8 was required for inclusion in the Venn diagram.
Fig. 2
Fig. 2. Observational and genetic correlations between MRI-derived adiposity traits, BMI, and WHRadjBMI.
Observational correlations displayed are Pearson correlation coefficients. Genetic correlations were obtained from cross-trait LD-score regression using sex-combined summary statistics. Additional correlogram entries, including sex-stratified analyses, are available in Supplementary Figs. 6 and 7.
Fig. 3
Fig. 3. Common variant sex heterogeneity for VATadj, ASATadj, and GFATadj local adiposity traits.
For each adiposity trait, independent loci that were associated with the trait in either sex-combined or sex-stratified analyses are plotted (Supplementary Data 10). Thirty-four such loci are plotted for VATadj, 27 for ASATadj, and 65 for GFATadj. Loci colored black were genome-wide significant (p < 5 × 10−8) in sex-combined analysis, blue loci were significant for males, but neither females nor sex-combined, and red loci were significant for females, but neither males nor sex-combined. pdiff corresponds to the “calcpdiff” function in EasyStrata comparing SNP effects in males and females (Methods). Across six adiposity traits (VATadj, ASATadj, GFATadj, VAT/ASAT, VAT/GFAT, and ASAT/GFAT), 220 unique loci-trait pairs were tested for sex heterogeneity (Supplementary Fig. 15), so a Bonferroni-corrected significance threshold of pdiff < 0.05/220 = 2.3 × 10−4 was set.
Fig. 4
Fig. 4. Effects of previously identified WHRadjBMI loci on local adiposity traits.
In total, 345 of the 346 index SNPs associated with WHRadjBMI in a recent meta-analysis from the GIANT consortium were available in the studied cohort. Effect sizes of VATadj, ASATadj, and GFATadj are plotted against the effect size for WHRadjBMI as reported in the cited study (Supplementary Data 11). Betas and p values for VATadj, ASATadj, and GFATadj correspond to the BOLT-LMM association p values computed in this study for the 345 index SNPs.
Fig. 5
Fig. 5. Rare variants in PDE3B selectively associate with fat distribution in female participants.
A mask combining predicted loss-of-function variants and missense variants predicted to be deleterious by 5 out of 5 in silico prediction algorithms in PDE3B associated with GFATadj in females with exome-wide significance (Supplementary Data 15). Effect sizes with 95% confidence intervals are plotted for carrier status. Linear regressions were adjusted for age, age squared, imaging center, genotyping array, and the first ten principal components of genetic ancestry (Supplementary Data 16). Note that the carrier counts are with respect to individuals who had “adj” traits available. For the other six traits, the carrier counts are 26 carriers/9616 participants for males and 25 carriers/9879 participants for females.
Fig. 6
Fig. 6. Enrichment of VATadj, ASATadj, and GFATadj genome-wide polygenic scores in tails of the distribution.
For each fat depot “adj” trait, a polygenic score was trained using LDpred2 on 70% of the studied cohort and a 10% validation cohort was used to determine the optimal set of hyperparameters. Results in this figure correspond to the 20% imaged and testing set (N = 7795). Supplementary Fig. 18 shows the full distribution of each polygenic score in each tail of VATadj, ASATadj, and GFATadj.
Fig. 7
Fig. 7. Effects of VATadj, ASATadj, and GFATadj polygenic scores on metabolically relevant biomarkers and diseases.
The central density plots indicate the distributions of VATadj, ASATadj, and GFATadj polygenic scores in genotyped individuals of the UK Biobank who were not imaged (N = 447,486). The dotted lines and shaded regions correspond to individuals in the top 5% and bottom 5% of the polygenic score. Forest plots to the right correspond to effect sizes of an indicator variable for being in the top 5% of the polygenic score (with identical color-coding to the density plots), while forest plots to the left correspond to effect sizes of an indicator variable for being in the bottom 5% of the polygenic score. Each polygenic score was residualized against the first ten principal components of genetic ancestry prior to being discretized, and each regression was adjusted for age at imaging, sex, and the first ten principal components of genetic ancestry. HbA1C hemoglobin A1C, HDL-c HDL-cholesterol, Trig triglycerides, ALT alanine aminotransferase, T2D prevalent type 2 diabetes (at time of imaging), CAD prevalent coronary artery disease, HTN prevalent hypertension. Corresponding data are found in Supplementary Data 20.

References

    1. González-Muniesa P, et al. Obesity. Nat. Rev. Dis. Prim. 2017;3:1–18. - PubMed
    1. Kivimäki M, et al. Overweight, obesity, and risk of cardiometabolic multimorbidity: pooled analysis of individual-level data for 120 813 adults from 16 cohort studies from the USA and Europe. Lancet Public Health. 2017;2:e277–e285. doi: 10.1016/S2468-2667(17)30074-9. - DOI - PMC - PubMed
    1. Stefan N, Schick F, Häring H-U. Causes, characteristics, and consequences of metabolically unhealthy normal weight in humans. Cell Metab. 2017;26:292–300. doi: 10.1016/j.cmet.2017.07.008. - DOI - PubMed
    1. Stefan N. Causes, consequences, and treatment of metabolically unhealthy fat distribution. Lancet Diabetes Endocrinol. 2020;8:616–627. doi: 10.1016/S2213-8587(20)30110-8. - DOI - PubMed
    1. Agrawal, S. et al. Association of machine learning-derived measures of body fat distribution in >40,000 individuals with cardiometabolic diseases. medRxiv. 10.1101/2021.05.07.21256854 (2021).

Publication types