. 2022 Dec;40(12):1807-1813.
doi: 10.1038/s41587-022-01377-0. Epub 2022 Jun 30.

Frequent aneuploidy in primary human T cells after CRISPR-Cas9 cleavage

Affiliations

Frequent aneuploidy in primary human T cells after CRISPR-Cas9 cleavage

Alessio David Nahmad et al. Nat Biotechnol. 2022 Dec.

Abstract

Multiple clinical trials of allogeneic T cell therapy use site-specific nucleases to disrupt T cell receptor (TCR) and other genes1-6. In this study, using single-cell RNA sequencing, we investigated genome editing outcomes in primary human T cells transfected with CRISPR-Cas9 and guide RNAs targeting genes for TCR chains and programmed cell death protein 1. Four days after transfection, we found a loss of chromosome 14, harboring the TCRα locus, in up to 9% of the cells and a chromosome 14 gain in up to 1.4% of the cells. Chromosome 7, harboring the TCRβ locus, was truncated in 9.9% of the cells. Aberrations were validated using fluorescence in situ hybridization and digital droplet PCR. Aneuploidy was associated with reduced proliferation, induced p53 activation and cell death. However, at 11 days after transfection, 0.9% of T cells still had a chromosome 14 loss. Aneuploidy and chromosomal truncations are, thus, frequent outcomes of CRISPR-Cas9 cleavage that should be monitored and minimized in clinical protocols.


Conflict of interest statement

Competing Interests

A.B is a co-founder and an inventor of the underlying patents for LogicBio Therapeutics, developing CRISPR-free genome editing.

A.D.N and A.B. are co-founders and inventors of the underlying patents for Tabby Therapeutics, using CRISPR-Cas9 for B cell engineering. A.D.N and A.B hold equity and receive monetary compensation from Tabby Therapeutics. E.R. is an employee of Future Meat Technologies.

Figures
Extended Data Fig. 1
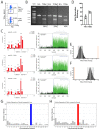
Extended Data Fig. 1. Quantification of InDels produced by CRISPR-Cas9 activity at the TCRα locus indicates efficient cleavage.
A. Flow cytometry example of TCR ablation in primary human T cells following CRISPR-Cas9 RNP electroporation. Cells were electroporated with Cas9 and either a non-specific gRNA or a TCRα-targeting gRNA. B. T7 Endonuclease 1 (T7E1) assay for three independent experiments. For each experiment, one lane for non-Specific gRNA (N.S.) and one lane for TCRα-targeting gRNA treated cells are presented. Experiments are separated by a black bar. Percentages, presented below the lanes, refer to cleavage efficiency as inferred by densitometric analysis. Loading Ladder and relative sizes are indicated on the left. Unprocessed scan can be found in Supplementary Data 1. C. TIDE Analysis for the same experiments as in B. In the left panel, the height of each bar corresponds to the rate of sequences having the given number of nucleotides added or deleted. The right panel depicts the rate of sequence misalignments at each position of the PCR fragment amplified from the TCRα locus of cells treated with either the TCRα-targeting gRNA (green) or a non-Specific gRNA (black) D. Quantification of B and C. E-F. Enrichment in the number of genes with no detected expression among cells identified as having a chromosome 14 loss (E) or gain (F) in Fig. 1F. The x-axis represents the fold-change in the number of genes with no detected expression between cells with or without a chromosome 14 loss, based on the InferCNV analysis (Fig. 1F). The dark gray lines represent the empirical values obtained for each chromosome, except for chromosome 14. The orange line is the empirical value for chromosome 14. The black bars are the results of 10,000 permutations. G. Number of differentially expressed genes in each chromosome, as compared between cells with or without a chromosome 14 loss (see Fig. 1F). H. Number of differentially expressed genes in each chromosome, as compared between cells with or without a chromosome 14 gain (see Fig. 1F).
Extended Data Fig. 2
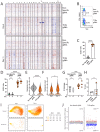
A. Schematic depiction of human chromosome 14 (Chr14). The target locus is indicated in orange. The zoomed in box indicates more specifically, the different target sites of each gRNA/crRNA used in this study. ddPCR and FISH probe sets are indicated below as colored yellow/blue or green/red boxes, respectively. Numbers above indicate distances, in base pairs (bp), between the targets. B. Flow cytometry example of TCR ablation in primary human T cells, 4 days following CRISPR-Cas12a RNP electroporation. Cells were electroporated with Cas12a alone or with Cas12a and the relevant crRNA. C. Quantification of B. Each dot represents an independent experiment. Mean value, standard deviation and individual experiments are indicated. n=3, ****, p<0.0001, two-sided unpaired Wilcoxon test. D. Flow cytometry example of TCR ablation in primary human T cells following CRISPR-Cas9 RNP electroporation. Cells were electroporated with Cas9 and either a non-specific gRNA or the TCRα-targeting gRNA in exon3 (TCRαexon3) as in A. E. Quantification of B. Each dot represents an independent experiment. Mean value, standard deviation and individual experiments are indicated. n=3, ****, p<0.0001, two-sided unpaired Wilcoxon test. F-G ddPCR dislinkage analysis 4 days following CRISPR-Cas12a electroporation (F) or CRISPR-Cas9 electroporation with the TCRαexon3 gRNA (G). Each color represents a different human donor. Each dot represents a technical replication. H. FISH analysis of cells treated with either Cas12a only, Cas12a + TCRαCas12a crRNA or Cas9 + a TCRαexon3-targeting gRNA. In the pictures are examples of all signal patterns found among analyzed cells. The frequency of each signal pattern among the electroporated cells is presented below the pictures. n = 338, n = 357 and n = 427 for cells electroporated with Cas12a only, Cas12a + TCRαCas12a crRNA or Cas9 + a TCRαexon3-targeting gRNA, respectively and n=358 and n=388 for cells electroporated with Cas9 + non-specific gRNA or Cas9 + TCRα targeting gRNA (as in Fig. 1A), respectively. **, p=0.0012 for Fisher’s exact test comparing loss of distal signal between cells transfected with Cas12a only and cells transfected with Cas12a + TCRαCas12a crRNA. ##, p=0.0015 for Fisher’s exact test comparing loss of either both signals or only the distal signal between cells transfected with Cas12a only and cells transfected with Cas12a + TCRαCas12a crRNA. ####, p<0.0001 for Fisher’s exact test comparing loss of distal signal between cells transfected with TCRαexon3 gRNA and cells transfected with a non-specific gRNA and for Fisher’s exact test comparing loss of distal signal between cells transfected with TCRα gRNA and cells transfected with a non-specific gRNA. n.s., p>0.05 for Fisher’s exact test. comparing loss of distal signal between cells transfected with TCRαexon3 gRNA and cells transfected with TCRα gRNA. **, p=0.0069 for Fisher’s exact test comparing loss of only the distal signal between cells transfected with TCRαexon3 gRNA and cells transfected with a non-specific gRNA. **, p=0.0031 for Fisher’s exact test comparing loss of only the distal signal between cells transfected with the TCRα gRNA to cells transfected with a non-specific gRNA.
Extended Data Fig. 3
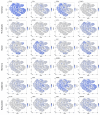
Extended Data Fig. 3. Selected gene expression patterns across the cells.
Each t-SNE plot represents all the cells in the experiment (Fig. 3A-C). Each plot represents the expression pattern of a different gene, indicated on the top left, among the clusters. A darker shade of blue corresponds to higher RNA expression. For each row, a title for the type of markers is indicated on the left.
Extended Data Fig. 4
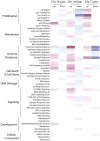
Extended Data Fig. 4. A gene set enrichment analysis between cells that have lost a copy of chromosome 14 (Fig. 1F), to cells without these chromosomal aberrations.
The 50 ‘Hallmark’ MSigDB gene sets are shown. Gene sets enriched in up-regulated genes are depicted in red and those enriched in down-regulated genes are depicted in blue. Values are scaled to -log(FDR) of the enrichments. The full enrichment scores are shown in Supplementary Table 1.
Extended Data Fig. 5
A. Heat map depicting gene copy numbers inferred from scRNAseq analysis following treatment with the TCRα-targeting gRNA 4 days (above) or 11 days (below) after CRISPR-Cas9 electroporation, as presented in Fig. 3H. The expression levels in cells treated with a non-specific gRNA 4 days after CRISPR-Cas9 electroporation served as a reference in both analyses. Each line represents an individual cell. The Chromosomes are ordered in columns and the color coding indicates an increase (red) or decrease (blue) in copy number of genes along the chromosomes (x-axis). B. Flow cytometry example of TCR ablation in primary human T cells, measured by CD3 staining, 11 days following CRISPR-Cas9 RNP electroporation. Cells were electroporated with Cas9 and either a non-specific gRNA or a TCRα-targeting gRNA. C. Quantification of B. Each dot represents an independent experiment. Mean value, standard deviation and individual experiments are indicated. n=3, ****, p<0.0001, two-sided unpaired t-test. D. CD3 expression from flow cytometry data at either 4 days or 11 days following CRISPR-Cas9 electroporation. n=5-12, ****, p<0.0001 for Two-Way ANOVA. #, p=0.0410 and ns, p>0.05 Tukey’s multiple comparison. This plot includes data presented in Fig. 1C. E. A reduction in TCRα expression is evident in the scRNAseq, 4 days following CRISPR-Cas9 electroporation. The violin plots correspond to the TCRα expression level in cells treated with either a non-specific gRNA or the TCRα-targeting gRNA. Upper and lower boundaries as well as median and quartiles are indicated. ****, p<0.0001, two-sided unpaired Wilcoxson test. F. A reduction of TCRα expression is stable in the scRNAseq, 11 days following CRISPR-Cas9 electroporation. The violin plots correspond to TCRα expression level in cells treated with the TCRα-targeting gRNA at either 4 days or 11 days following treatment. Upper and lower boundaries as well as median and quartiles are indicated. n.s., p>0.05, two-sided unpaired Wilcoxson test. G. ddPCR dislinkage at either 4 days or 11 days following CRISPR-Cas9 electroporation. n=3-7. Each dot represents the mean of replicates from an independent experiment, ***, p=0.0003 and ns, p>0.05 for Two-Way ANOVA and Tukey’s multiple comparison, respectively. This plot includes the means of data presented in Fig. 2E. H. Quantification of FISH signals, from three independent experiments of T cells 11 days following CRISPR-Cas9 electroporation. Signal loss designates loss of either both signals or only the distal signal. Mean and Standard Deviations are indicated. n=2-3, ns, non-significant two-sided unpaired t-test. I. Principal component (PC) analysis of cell cycle phase among cells treated with a TCRα-targeting gRNAs and characterized, as in Fig. 3H, as having a chromosome 14 loss (bottom) or not (normal, up) for cells 4 days following treatment (left) or 11 days following treatment (right). Legend and fraction of cells in each cell cycle phase is indicated on the right. J. Each dot represents the mean inferred copy number of genes coded on chromosome 14 in each cell treated with a non-specific gRNA (left) or a TCRα-targeting gRNA (right). Cells are marked with dots spread along the x-axis. The dots are colored red and blue when corresponding to cells with a chromosome 14 gain or loss respectively, at day 4 following treatment, if their mean inferred gene copy number is >2 standard deviations (blue and red), from the population’s mean. ****, p<0.0001 for Fisher’s exact test comparing chromosome 14 gain or loss between cells treated with the TCRα gRNA and cells treated with a nonspecific gRNA. Data with inferred gene copy number >3 standard deviations (blue and red), from the population’s mean is presented in Fig. 3H.
Extended Data Fig. 6
Extended Data Fig. 6. A gene set enrichment analysis between cells that have lost or gained a copy of chromosome 14, 4 or 11 days following treatment, compared to cells without these chromosomal aberrations.
The 50 ‘Hallmark’ MSigDB gene sets are shown. Gene sets enriched in up-regulated genes are depicted in red and those enriched in down-regulated genes are depicted in blue. Values are scaled to -log(FDR) of the enrichments. The full enrichment scores are shown in Supplementary Table 1.
Extended Data Fig. 7
Extended Data Fig. 7. Quantification of InDels produced by CRISPR-Cas9 activity at the TCRα, TCRβ and PDCD1 loci indicates efficient cleavage.
A. RNA expression of PDCD1 in cells treated with either a non-specific gRNA or a combination of TCRα, TCRβs and PDCD1- targeting gRNAs. ****, p<0.0001, twosided unpaired Wilcoxon test. RNA expression presented as violin can be found in Fig. 4B. B. T7E1 assay for the 4 genomic target loci. Cells treated with a non-Specific gRNA (4 left lanes) are compared to cells treated with the combination of the TCRα, TCRβ and PDCD1- targeting gRNAs (4 right lanes). In each lane, a different locus is analyzed. Calculated efficiency is indicated below. Loading Ladder and relative sizes are indicated in the middle. Unprocessed scan can be found in Supplementary Data 1. C. TIDE Analysis for the same experiments as in A. The rows represent (in this order, from top to bottom) the TCRα, TCRβ1, TCRβ2 and PDCD1 loci. In the left panels, the height of each bar corresponds to the rate of sequences having the given number of nucleotides added or deleted. The right panels depict the rate of sequence misalignments at each position of the PCR fragment amplified from the target locus of cells treated with either a non-specific gRNA (black) or a combination of the TCRα, TCRβ and PDCD1- targeting gRNAs (green).
Extended Data Fig. 8
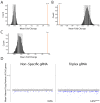
Enrichment in the number of genes with no detected expression among cells identified as having a chromosome 14 loss (A), a chromosome 14 gain (B) or a chromosome 7 truncation (C) (Fig.4D). The x-axis represents the fold-change in the number of genes with no detected expression between cells with or without a chromosome 14 loss or gain or a chromosome 7 truncation, based on the InferCNV analysis (Fig. 4D). The dark gray lines represent the empirical values obtained for each chromosome, except for chromosome 14 or 7 in the respective plots. The orange line is the empirical value for chromosome 14 or chromosome 7. The black bars are the results of 10,000 permutations. D. Differential gene expression analysis for chromosome 2. Each dot represents the mean inferred copy number of genes coded on chromosome 2 in each cell treated with a non-specific gRNA (left) or a combination of the TCRα, TCRβ and PDCD1- targeting gRNAs (right). Cells are marked with dots spread along the x-axis. The dots are colored blue when corresponding to cells with a chromosome 2 loss, if their mean inferred gene copy number is >2 standard deviations from the population’s mean. n=8619 and 6326 for cells treated with a non-specific gRNA (left) or a combination of the TCRα, TCRβ and PDCD1- targeting gRNAs (right), respectively. ****, p<0.0001 for Fisher’s exact test comparing chromosome 2 loss between cells treated with the PDCD1 gRNA and cells treated with a non-specific gRNA.
Extended Data Fig. 9
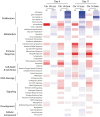
Extended Data Fig. 9. A gene set enrichment analysis between cells that have lost a copy of chromosome 14, or a segment of chromosome 7, to cells without these chromosomal aberrations.
The 50 ‘Hallmark’ MSigDB gene sets are shown. Gene sets enriched in up-regulated genes are depicted in red and those enriched in down-regulated genes are depicted in blue. Values are scaled to -log(FDR) of the enrichments. The full enrichment scores are shown in Supplementary Table 1.
Extended Data Fig. 10
Extended Data Fig. 10. Using the T cell surface markers CD70 and CD52 to sort out aberrant cells.
A. The violin plots show gene expression of CD70 (left) and CD52(right), for cells treated with the combination of the TCRα, TCRβ and PDCD1- targeting gRNAs and having a normal gene expression (grey) or a gene expression pattern indicating a chromosome 14 loss(blue). **** p<0.0001, unpaired two-tailed Wilcoxon test. B. Flow Cytometry of cells at day 4 following treatment with Cas9 and the TCRα targeting gRNA of cells sorted a day earlier for CD70- and CD52low or CD70+ CD52high. Plots marked as “parental” include cells that went through the sorter, but were not sorted for a specific expression of the CD70 or CD52. C. Each dot represents the mean inferred copy number of genes coded on chromosome 14 in each cell treated with a non-specific gRNA (left) or the TCRα-targeting gRNA (right). InferCNV analysis performed 4 days following electroporation. Cells are marked with dots spread along the x-axis. The dots are colored red and blue when corresponding to cells with a chromosome 14 gain or loss respectively, if their mean inferred gene copy number is >2 standard deviations (blue and red), from the population’s mean. n=8642 and 8970 for “parental” cells after treatment with a non-specific gRNA (left) or the TCRα-targeting gRNA(right), respectively. n=8642 and 7598 for sorted cells after treatment with a non-specific gRNA (left) or TCRα-targeting gRNA (Right), respectively. The same dataset was used as a reference in both the InferCNV analyses (non-specific gRNA, Unsorted). ****, p<0.0001 for Fisher’s exact test comparing chromosome 14 gain or loss between cells treated with the TCRα gRNA and cells treated with a non-specific gRNA (unsorted). #, p=0.0257 for Fisher’s exact test comparing chromosome 14 loss between the parental cells treated with the TCRα gRNA and sorted cells treated with the TCRα gRNA. D. Heat map depicting gene copy numbers inferred from scRNAseq analysis following sorting of TCRα-targeted cells for either alive (“Parental”, above) or CD70- CD52low expression (Sorted, below). Each line represents an individual cell. The Chromosomes are ordered in columns and the color coding indicates an increase (red) or decrease (blue) in copy number of genes along the chromosomes (x-axis). The same dataset was used as a reference in both the InferCNV analyses (non-specific gRNA, Unsorted).
Figure 1
Figure 1. Targeting the TCRα locus using CRISPR-Cas9 leads to chromosome 14 aneuploidy.
A. Schematic depiction of human chromosome 14 (Chr14). The target locus is indicated in orange. B. Flow-cytometry example of TCR ablation in primary human T cells 4-days following CRISPR-Cas9 RNP electroporation. Cells were electroporated with Cas9 and either a non-specific gRNA or a TCRα-targeting gRNA. C. Quantification of B. Each dot represents an independent experiment. Mean value, standard-deviation and individual experiments are indicated. n=12, ****, p<0.0001, two-sided unpaired Wilcoxon-test. D. A reduction in TCRα expression is evident in the scRNAseq. The violin plots correspond to TCRα expression level in cells treated with either a non-specific gRNA or the TCRα-targeting gRNA. Upper and lower boundaries, median and quartiles are indicated. ****, p<0.0001, two-sided unpaired Wilcoxson-test. E. A heatmap depicting gene copy numbers inferred from scRNAseq analysis following treatment with either a non-specific or TCRα-targeting gRNAs. Each line represents an individual cell. The color coding indicates an increase (red) or decrease (blue) in copy number of genes along the chromosomes, ordered in columns. Arrows indicate gain (red) or loss (blue) of chromosome 14. F. Each dot represents the mean inferred copy number of genes coded on chromosome 14 in each cell treated with a non-specific gRNA (left) or a TCRα-targeting gRNA (right). Cells are marked with dots spread along the x-axis. The dots are colored red and blue when corresponding to cells with a chromosome 14 gain or loss respectively, if their mean inferred gene copy number is >2 standard-deviations (blue and red), or 3 standard-deviations (dark red), from the population’s mean. n=6055 and 7700 for non-specific (left) or TCRα-targeting (right) gRNA treated cells, respectively. *, p=0.0148 and ****, p<0.0001 for Fisher’s exact test comparing chromosome 14 gain or loss, respectively, between cells treated with the TCRα gRNA and cells treated with a non-specific gRNA, with a cutoff of 2 standard-deviations. ****, p<0.0001 for Fisher’s exact test comparing chromosome 14 gain between cells treated with the TCRα gRNA and cells treated with a non-specific gRNA, with a cutoff of 3 standard-deviations, for which the frequency of cells is indicated in parentheses.
Figure 2
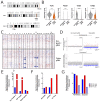
Figure 2. FISH and ddPCR analyses of Chromosome 14 aberrations.
A. FISH analysis of cells treated with either a non-specific or a TCRα-targeting gRNA. In the pictures are examples of all signal patterns found among analyzed cells. The frequency of each signal pattern, among cells electroporated with the TCRα-targeting gRNA or a non-specific gRNA, is presented below the pictures. In a first experiment (top), n = 273 and n = 506 for cells electroporated with a non-specific and TCRα-targeting gRNA, respectively; *, p=0.0129 Fisher’s exact test for loss of distal signal comparison and #, p=0.0486 for Fisher’s exact test for loss of either both signals or only the distal signal. In a second experiment (bottom), n = 313 and n = 360 for cells electroporated with a non-specific and TCRα-targeting gRNA, respectively; #, p= 0.0115 Fisher’s exact test for loss of either both signals or the distal signal and ** p =0.0048 for either single or dual Signal Separation for the second experiment. B. Quantification of A. from 3 independent experiments, 4 days following electroporation. Signal loss designates loss of either both signals or only the distal signal. Mean and Standard Deviations are indicated. **, p=0.0093 two-sided unpaired t-test. C. Schematic depiction of the ddPCR experiment. Genomic DNA is sheared using the HindIII restriction enzyme. The two sets of primers and probe are on the same restriction fragment and are separated only upon CRISPR-Cas9 cleavage. D. Dislinkage, calculated based on the rate of single and dual color droplets (see methods, is analyzed at different time points following CRISPR-Cas9 electroporation with either a TCRα-targeting gRNA (orange) or a non-specific (gray) gRNA from a single experiment. Mean and standard deviation for technical replicates are indicated. E. Dislinkage at either 3 hours (left), 4 days (middle) or 11 days (right) following CRISPR-Cas9 electroporation. Each color represents a different human donor. Each dot represents a technical replication. n=3-7, ****, p<0.0001 and *, p=0.0085, *, p=0.0474 two-sided unpaired t-test.
Figure 3
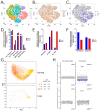
Figure 3. Global gene expression analysis following genome editing.
A. scRNAseq data from primary human T cells showing 13,755 cells as individual dots. Data is displayed by tSNE with each cluster colored differently. B. Distribution of cells electroporated with a non-specific (gray) or TCRα-targeting (orange) gRNA among the clusters. C. Distribution of cells with a chromosome 14 loss (blue) or gain (red) among the clusters. D-F. Gene set enrichment analysis for ‘Hallmark’ gene sets associated with cell cycle (D), metabolism (E), p53 expression and apoptosis (F) in cells with chromosome 14 loss (blue) and or gain (red). G. Principal component (PC) analysis of cell cycle phase among cells treated with a TCRα-targeting gRNAs and characterized, as in Fig. 1F, as having a chromosome 14 loss (bottom) or not (normal, up). Legend and fraction of cells in each cell cycle phase is indicated on the right. ****, p<0.0001 Fisher’s exact test for G1 phase compared to S/G2M phases. n = 7289 and n = 411 for cells without or with a chromosome 14 loss, respectively. H. Each dot represents the mean inferred copy number of genes coded on chromosome 14 in each cell treated with a non-specific gRNA (left) or a TCRα-targeting gRNA (right). Cells are marked with dots spread along the x-axis. The dots are colored red and blue when corresponding to cells with a chromosome 14 gain or loss respectively, if their mean inferred gene copy number is >3 standard deviations (dark blue and dark red), from the population’s mean. For Day 4, n=8642 and 6592 for cells transfected with a non-specific (left) or TCRα-targeting (right) gRNA, respectively. For Day 11, n=8642 and 9197 for cells transfected with a non-specific (left) or TCRα-targeting (right) gRNA, respectively. The expression levels in cells treated with a non-specific gRNA 4 days after CRISPR-Cas9 electroporation served as a reference in both analyses. ****, p<0.0001 for Fisher’s exact test comparing chromosome 14 gain or loss between cells treated with the TCRα gRNA and cells treated with a non-specific gRNA.
Figure 4
Figure 4. Targeting different loci concomitantly with several gRNAs aggravates chromosomal aberrations.
A. Schematic depiction of human chromosomes 2, 7 and 14. Target loci are shown in orange. A single gRNA targets both TCRβ1 and TCRβ2. B. RNA expression of TCRα, PDCD1, TCRβ1 and TCRβ2 in cells treated with either a non-specific gRNA or a combination of TCRα, TCRβs and PDCD1- targeting gRNAs. ****, p<0.0001, two-sided unpaired Wilcoxon test. C. A heat map depicting gene copy numbers inferred from scRNAseq analysis following treatment with either a non-specific gRNA or a combination of TCRα, TCRβs and PDCD1- targeting gRNAs. Each line represents an individual cell. The chromosomes are ordered in columns and the color coding indicates an increase (red) or decrease (blue) in copy number. Blue arrows indicate loss of chromosome 14 or chromosome 7 segments. D. Each dot represents the mean inferred copy number of genes coded on the relevant chromosome in each cell treated with a non-specific gRNA (left) the combination of TCRα, TCRβs and PDCD1- targeting gRNAs (right). For chromosome 7, the mean inferred copy number of genes coded distal to the TCRβ1&2 is analyzed. Cells are marked with dots spread along the x-axis. The dots are colored red and blue when corresponding to cells with a chromosome 14 gain or loss respectively, if their mean inferred gene copy number is >2 standard deviations away from the population’s mean. n=8619 and 6326 for cells treated with a non-specific gRNA (left) or a combination of TCRα, TCRβs and PDCD1- targeting gRNAs (right), respectively. ****, p<0.0001 for Fisher’s exact test comparing chromosome gain or loss between cells treated with the TCRα/β gRNA and cells treated with a non-specific gRNA. E-G. Gene set enrichment analysis of ‘Hallmark’ gene sets associated with cell cycle (E), metabolism (F), p53 expression and apoptosis (G) in cells with chromosome 14 loss (blue) and in cells with chromosome 14 gain (red).

References

    1. Weber EW, Maus MV, Mackall CL. The Emerging Landscape of Immune Cell Therapies. Cell. 2020;181:46–62. - PMC - PubMed
    1. MacLeod DT, et al. Integration of a CD19 CAR into the TCR Alpha Chain Locus Streamlines Production of Allogeneic Gene-Edited CAR T Cells. Mol Ther. 2017;25:949–961. - PMC - PubMed
    1. Philip LPB, et al. Multiplex genome-edited T-cell manufacturing platform for ‘off-the-shelf’ adoptive T-cell immunotherapies. Cancer Res. 2015;75:3853–3864. - PubMed
    1. Qasim W, et al. Molecular remission of infant B-ALL after infusion of universal TALEN gene-edited CAR T cells. Sci Transl Med. 2017;9:1–10. - PubMed
    1. Osborn MJ, et al. Evaluation of TCR Gene Editing Achieved by TALENs, CRISPR / Cas9, and megaTAL Nucleases. Mol Ther. 2016;24:570–581. - PMC - PubMed

Publication types

Substances