. 2022 Jul;54(7):963-975.
doi: 10.1038/s41588-022-01100-4. Epub 2022 Jun 30.

Single-cell and bulk transcriptome sequencing identifies two epithelial tumor cell states and refines the consensus molecular classification of colorectal cancer

Affiliations

Single-cell and bulk transcriptome sequencing identifies two epithelial tumor cell states and refines the consensus molecular classification of colorectal cancer

Ignasius Joanito et al. Nat Genet. 2022 Jul.

Abstract

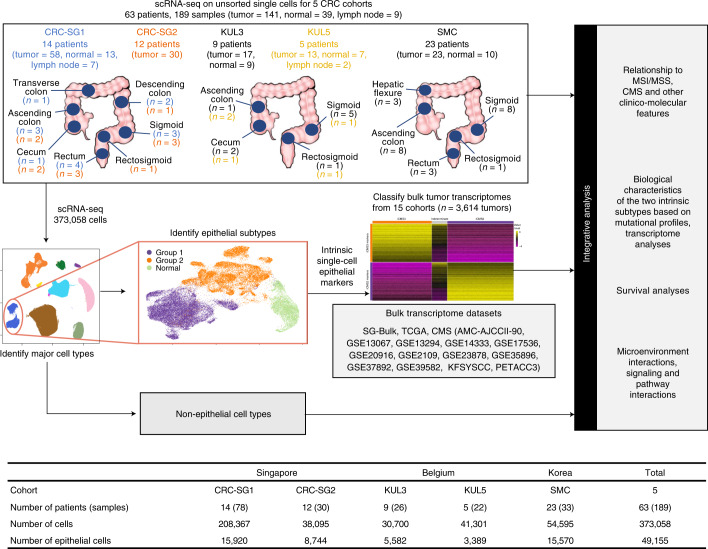
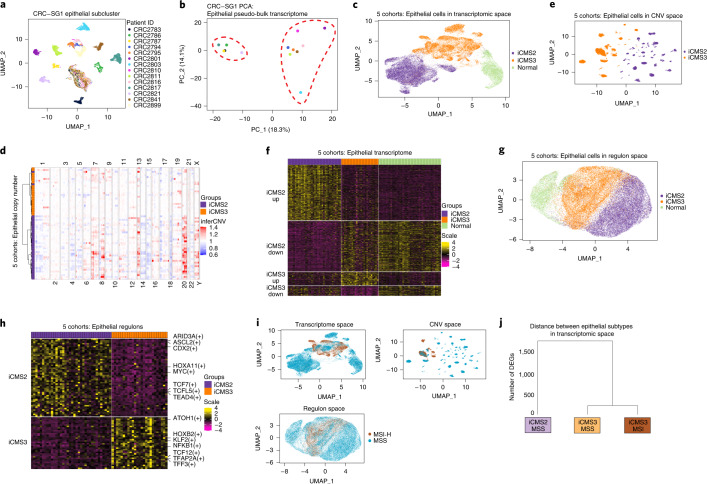
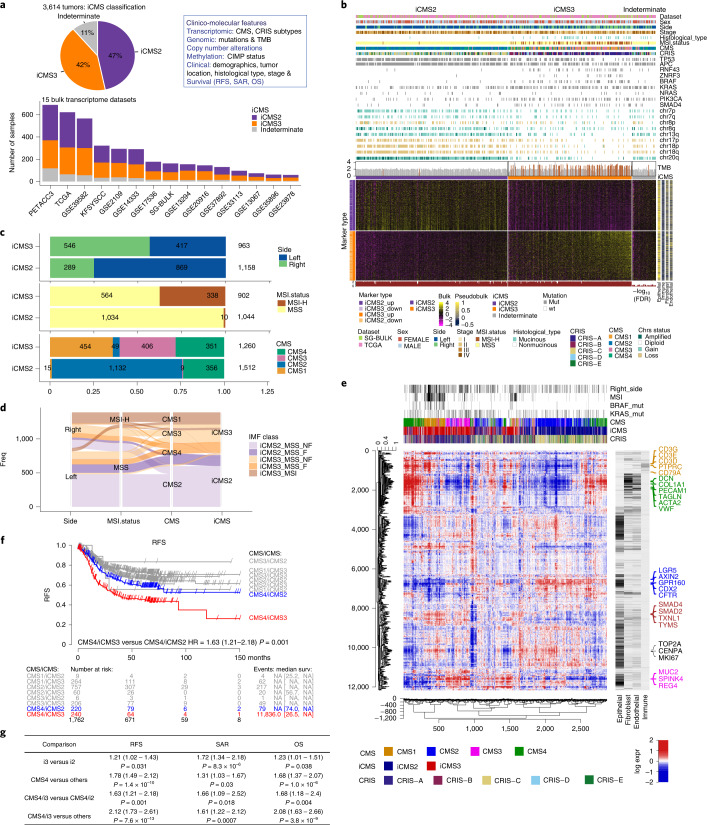
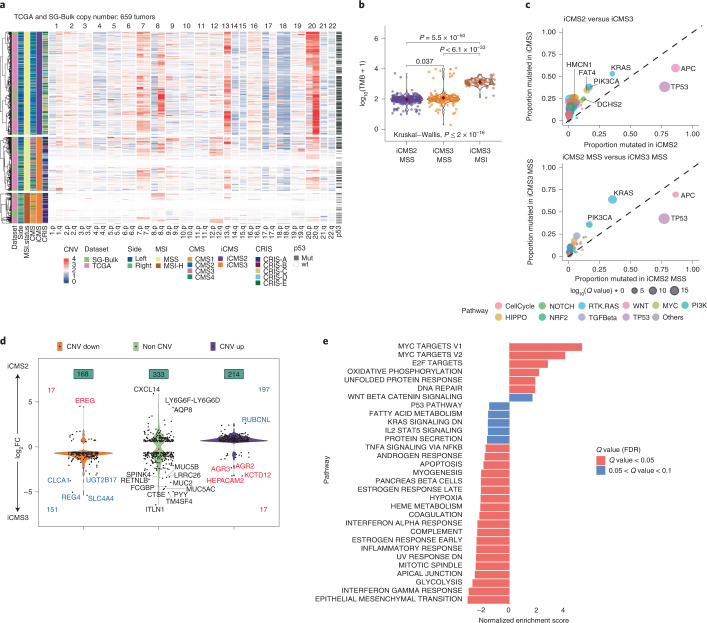
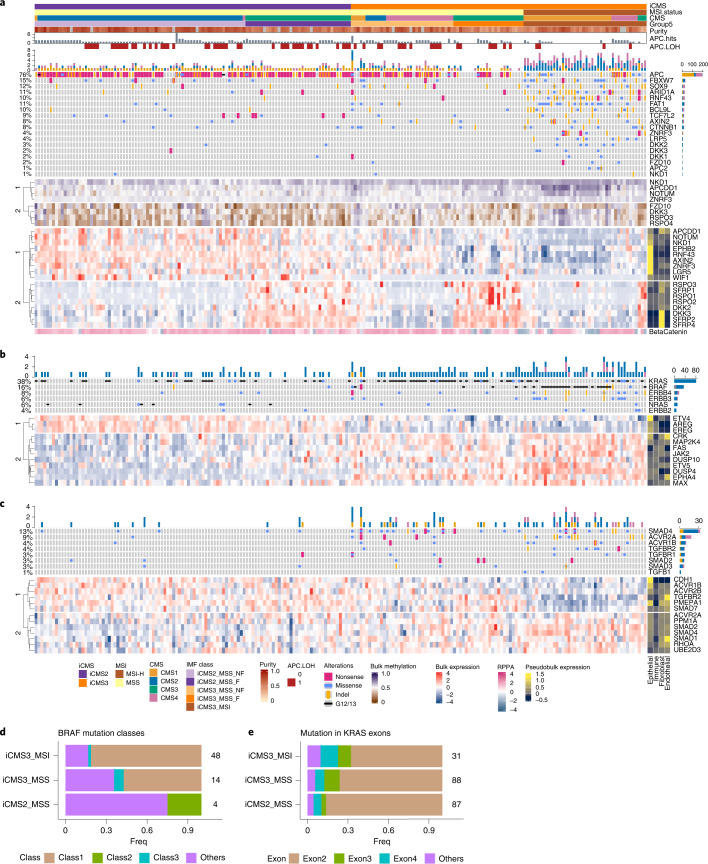
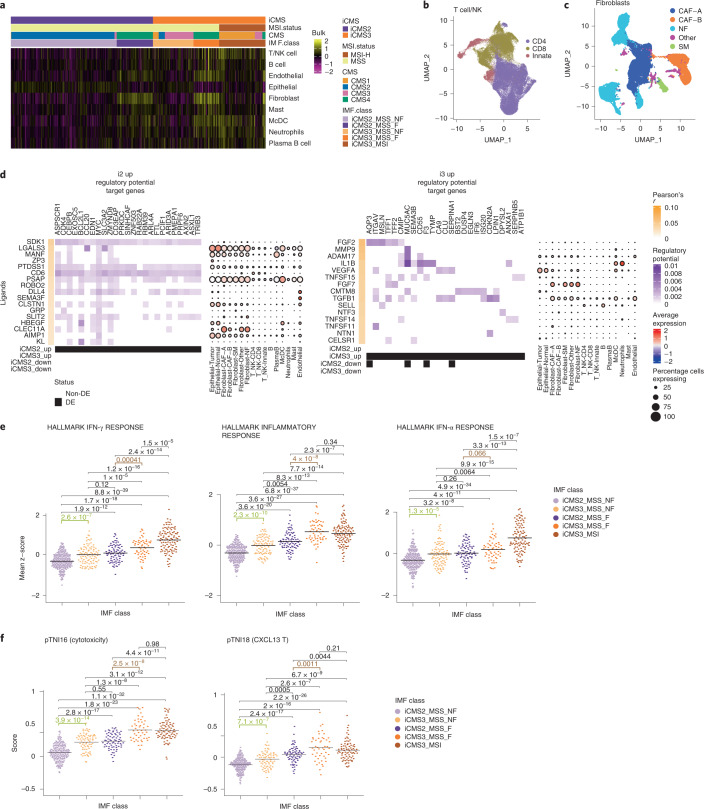
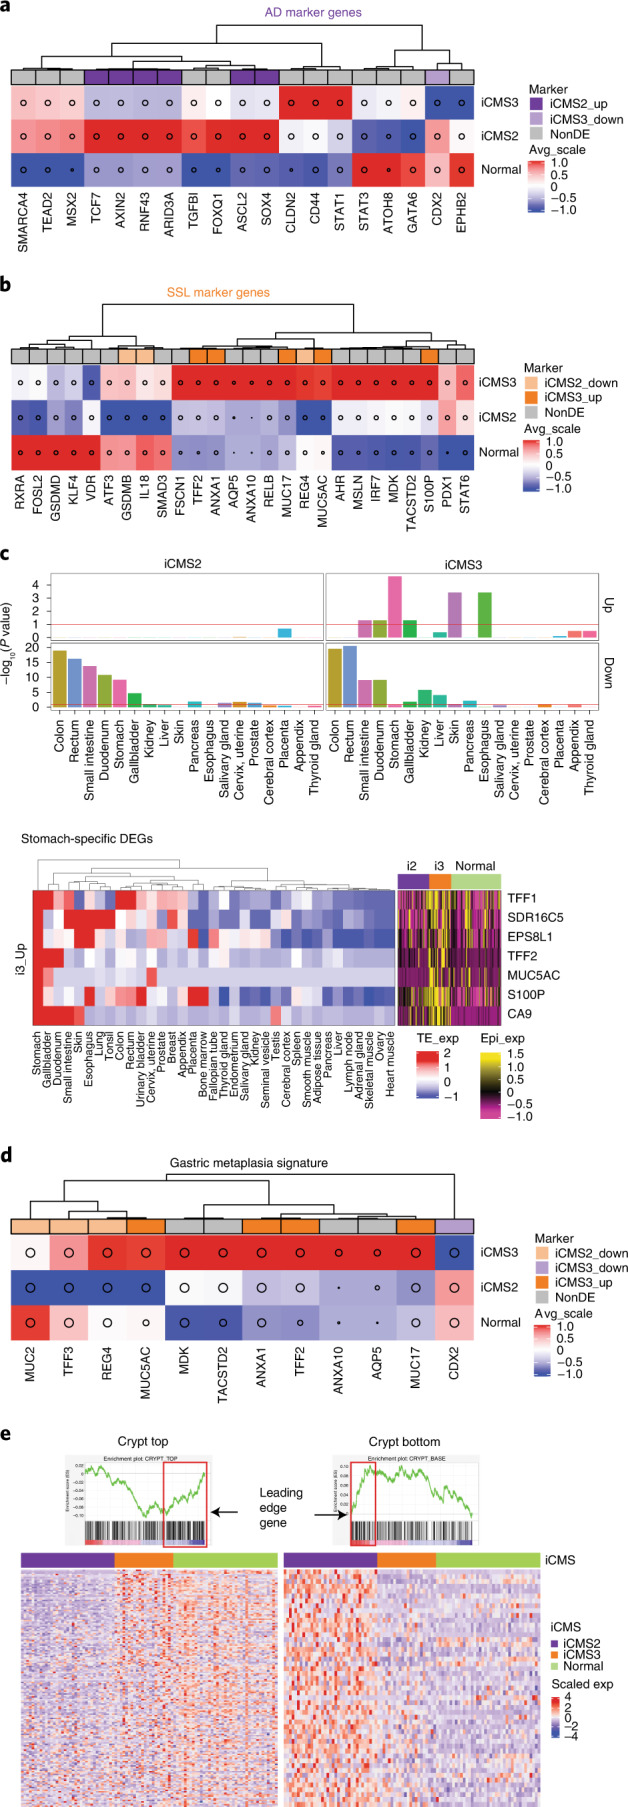
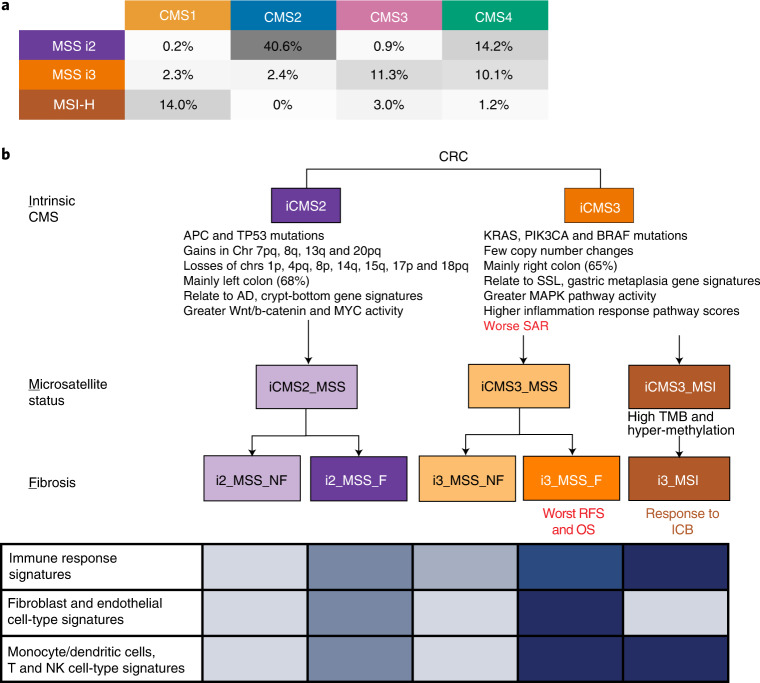
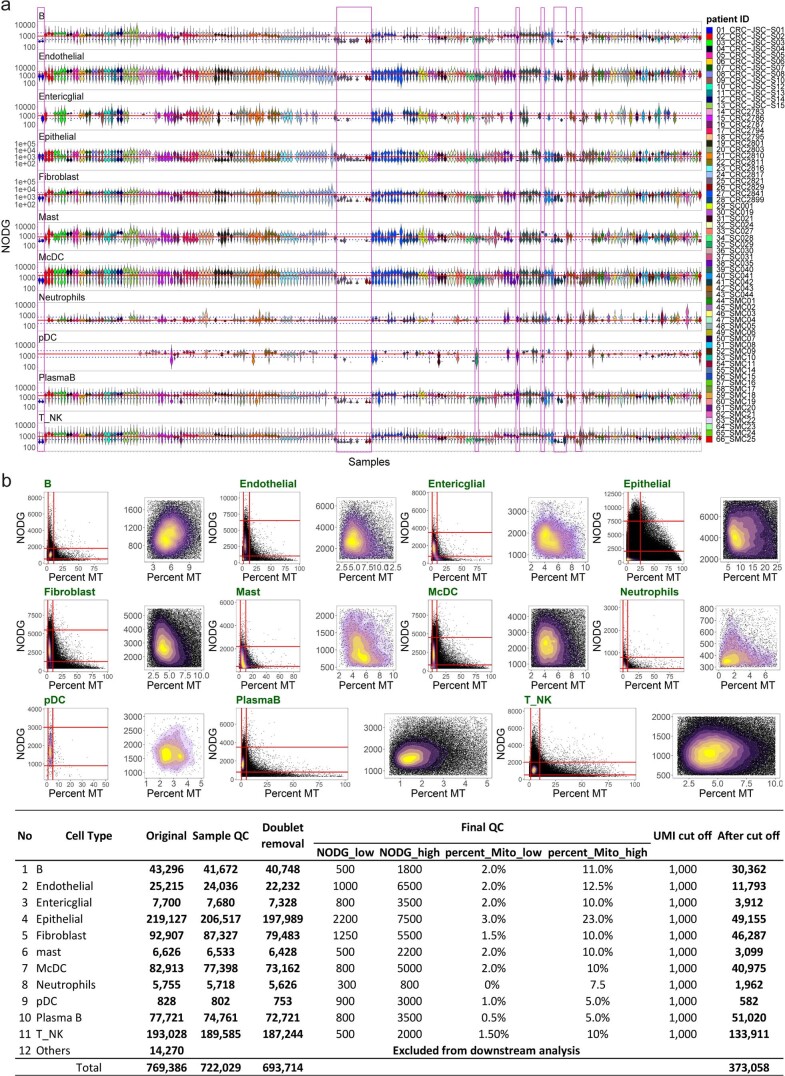
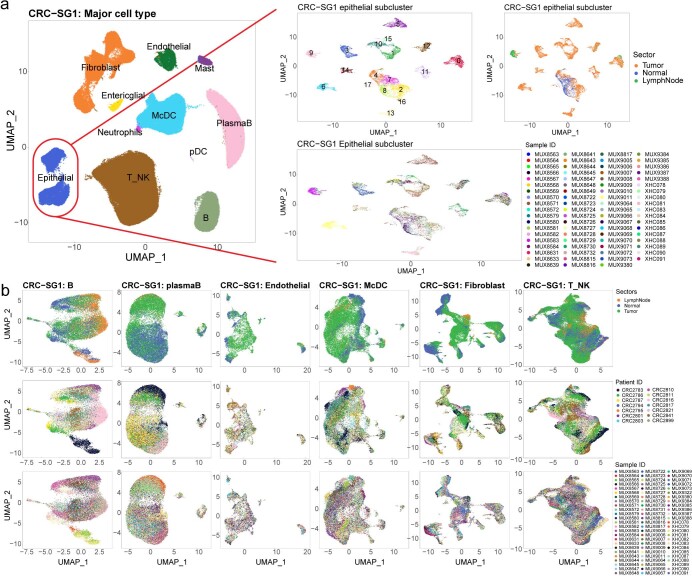
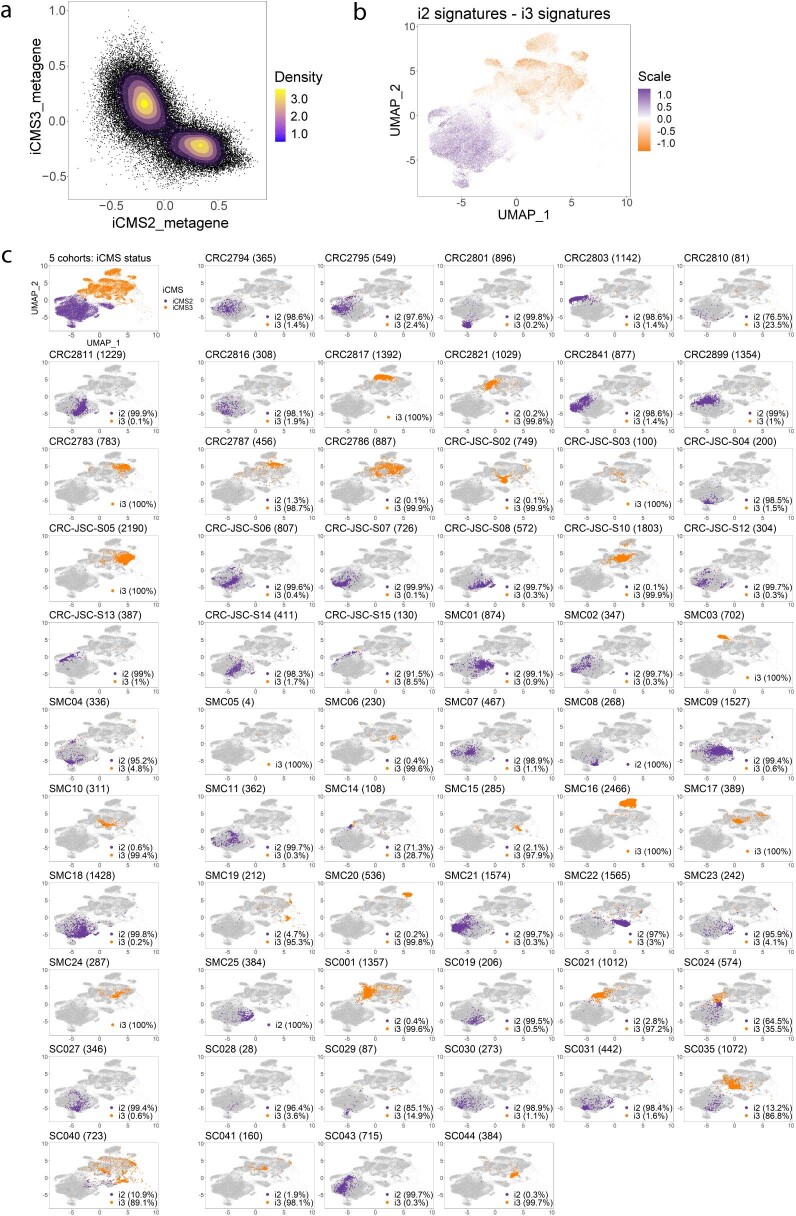
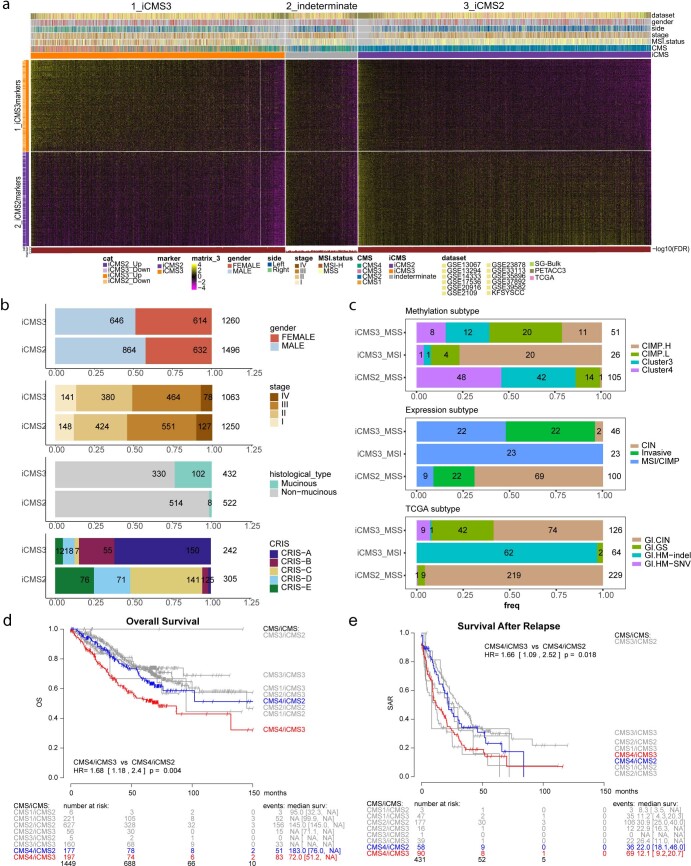
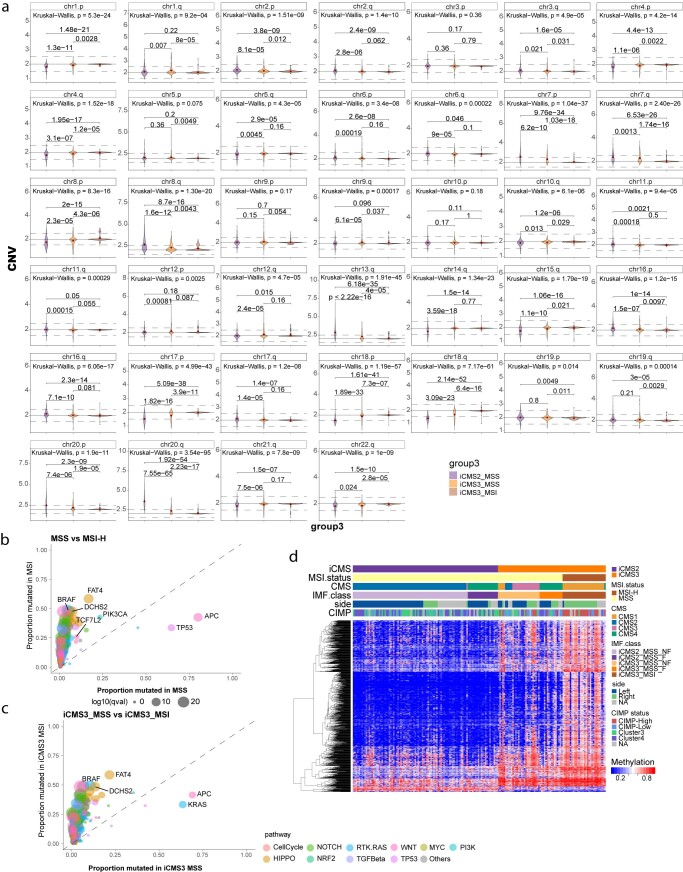
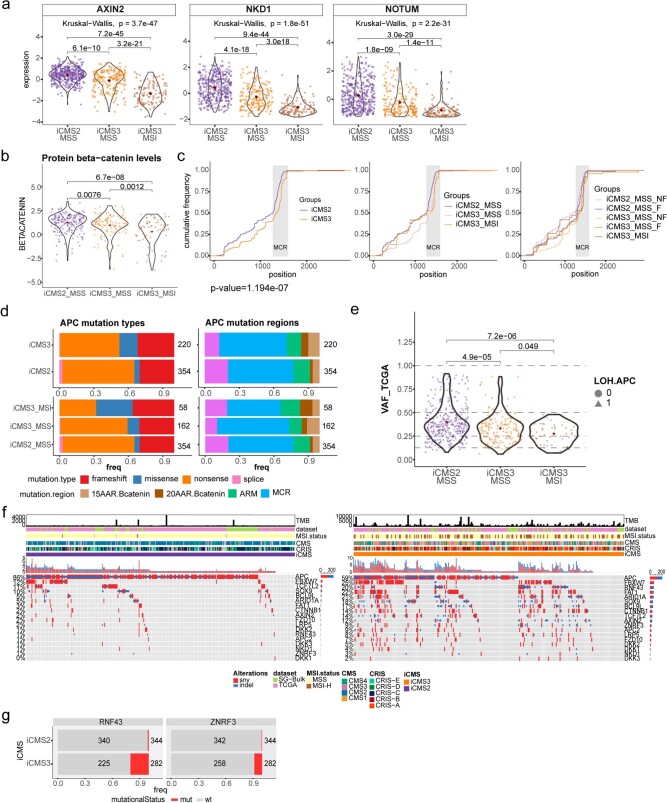
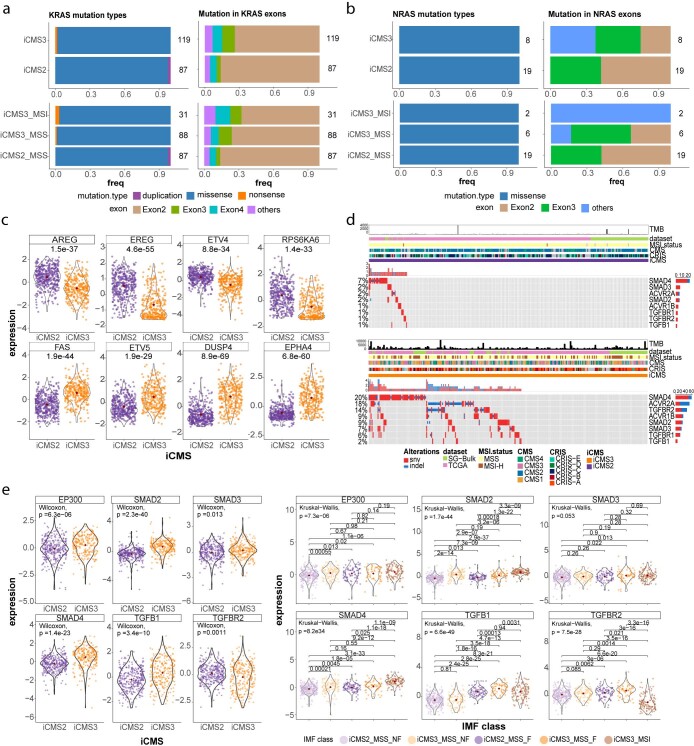
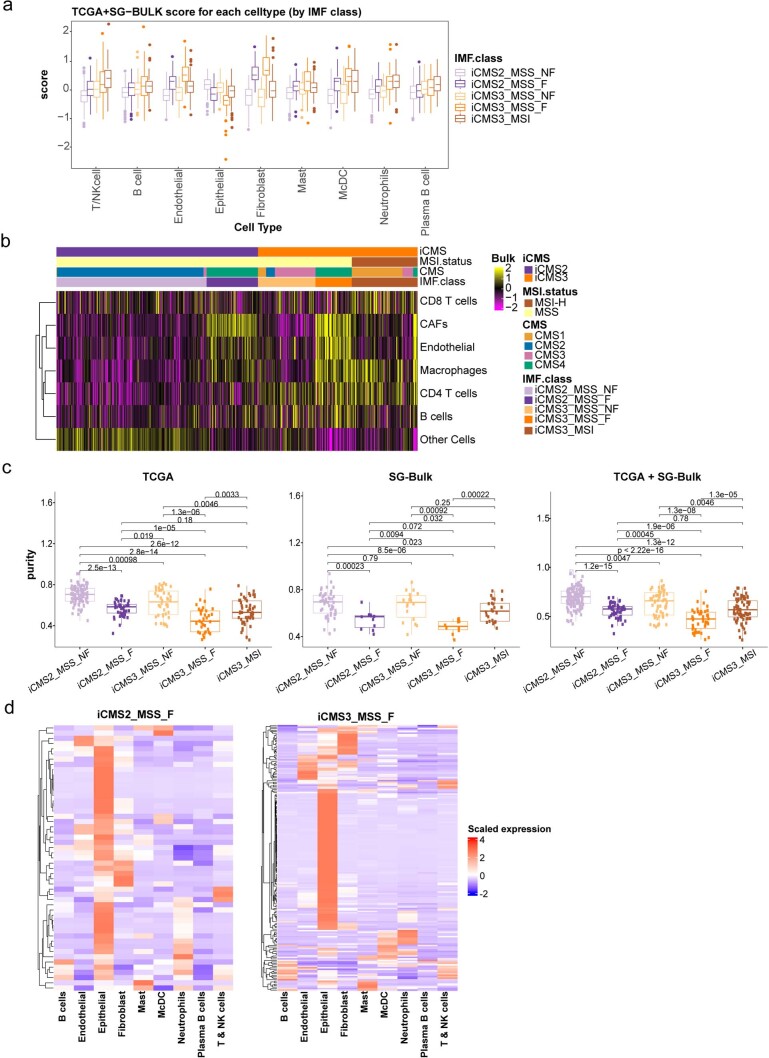
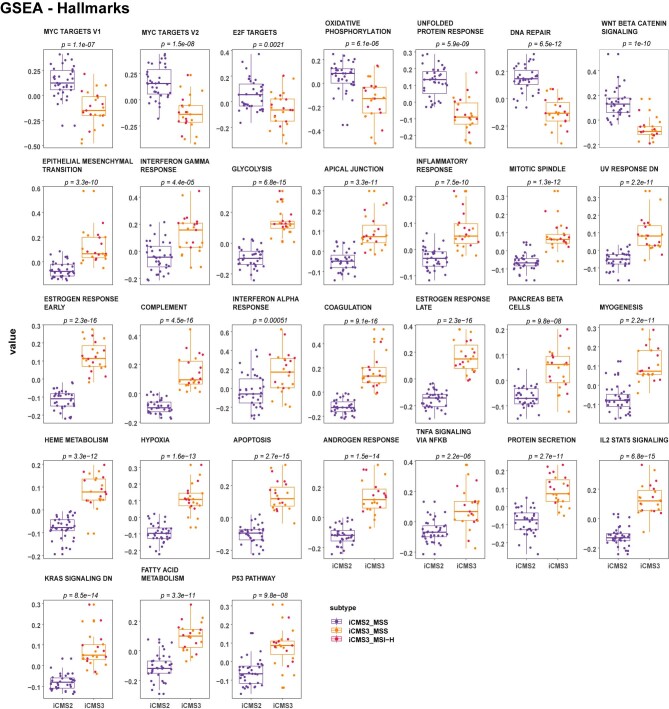
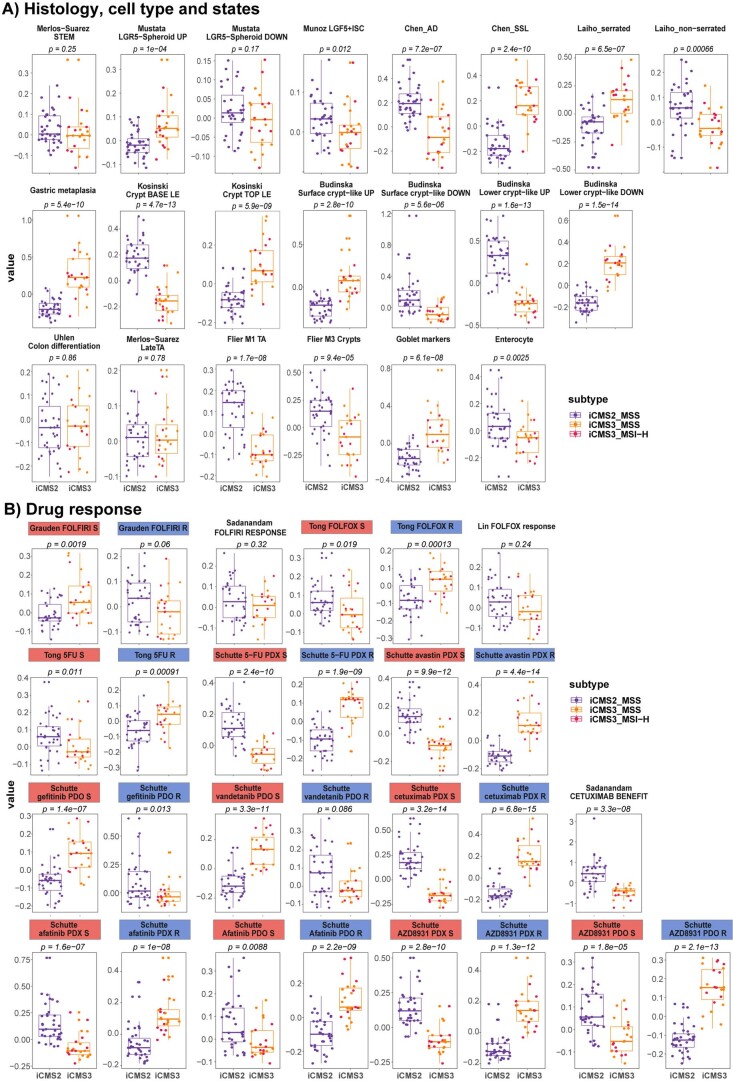
The consensus molecular subtype (CMS) classification of colorectal cancer is based on bulk transcriptomics. The underlying epithelial cell diversity remains unclear. We analyzed 373,058 single-cell transcriptomes from 63 patients, focusing on 49,155 epithelial cells. We identified a pervasive genetic and transcriptomic dichotomy of malignant cells, based on distinct gene expression, DNA copy number and gene regulatory network. We recapitulated these subtypes in bulk transcriptomes from 3,614 patients. The two intrinsic subtypes, iCMS2 and iCMS3, refine CMS. iCMS3 comprises microsatellite unstable (MSI-H) cancers and one-third of microsatellite-stable (MSS) tumors. iCMS3 MSS cancers are transcriptomically more similar to MSI-H cancers than to other MSS cancers. CMS4 cancers had either iCMS2 or iCMS3 epithelium; the latter had the worst prognosis. We defined the intrinsic epithelial axis of colorectal cancer and propose a refined 'IMF' classification with five subtypes, combining intrinsic epithelial subtype (I), microsatellite instability status (M) and fibrosis (F).


Conflict of interest statement

L.Z.H., R.N., H.L.J.O. and M.T.W. are employees of MSD International GmbH (Singapore Branch). A.N. and J.G. are employees of NantOmics. The remaining authors declare no competing interests.

Figures

Fig. 1
Fig. 1. Study schema.
For each of the five cohorts, the number of patients, anatomical locations and the number of samples profiled using scRNA-seq are indicated at the top. The major stages of data analysis are indicated below and to the right. For each cohort, the total number of profiled cells and the number of epithelial cells are indicated at the bottom. Single-cell transcriptomes from the SMC cohort and six patients from KUL3 (75,332 cells in all after QC) have been previously reported.
Fig. 2
Fig. 2. The discovery of iCMS subtype in scRNA-seq.
a, Reduced-dimensionality (UMAP) visualization of epithelial single cells (n = 15,920) in transcriptome space: 14 patients from CRC-SG1, colored by patient ID. b, Same dataset, PCA visualization of 14 patient-specific epithelial pseudo-bulk transcriptomes. c, UMAP visualization of 49,155 epithelial cells from five cohorts in transcriptomic space colored by iCMS subtype. d, Heatmap of 63 patient-specific pseudo-bulk-inferred CNV scores. Columns were sorted based on their chromosomal position while rows were clustered using hierarchical clustering. e, UMAP visualization of 49,155 epithelial cells from five cohorts in CNV space with each cell represented by its vector of inferred copy number scores in genomic bins. f, Heatmap of expression of 715 DEGs in patient-specific pseudo-bulk transcriptomes. Only the 61 patients with consistent iCMS classification were used. Each gene is zero-centered and scaled to unit variance. g, UMAP visualization of 46,006 epithelial cells from 61 patients in regulon space (SCENIC analysis). h, Patient-specific pseudo-bulk heatmap of 90 differentially expressed regulons: 61 patients, colored by scaled regulon activity score (AUC score). i, UMAP plot of epithelial cells in transcriptomic, copy number and regulon space, colored by MSI status. j, Dendrogram showing the distance between epithelial subtypes in transcriptomic space. The number of DEGs was defined as the pairwise distance and the matrix of pairwise distances was used for tree construction. AUC, Area Under Curve; UMAP, Uniform Manifold Approximation and Projection.
Fig. 3
Fig. 3. iCMS classification of bulk transcriptomes.
a, Proportion of 3,614 patients classified as iCMS2, iCMS3 or indeterminate based on their bulk tumor transcriptome. The box on the right lists the parameters that will be correlated with iCMS, including: CMS, CRIS, CIMP, TMB and copy number variation, overall survival (OS), survival after relapse (SAR) and RFS. b, Heatmap of 715 iCMS marker genes used to classify the 455 TCGA and SG-Bulk tumor transcriptomes. Gene expression values were log-transformed, zero-centered and scaled to unit variance. Upper annotation bars show clinical, mutational and copy number gain/loss categorized as amplified (≥4 copies), gain (2.5–4 copies), diploid (1.5–2.5 copies) and loss (<1.5 copies), as well as TMB (MSI-H patients highlighted in brown). Right annotation bar shows the average scaled expression of each gene across four major cell types, based on scRNA-seq data from the CRC-SG1 cohort. Lower annotation track: FDR Q value of iCMS classification. c, Breakdown of iCMS2 and iCMS3 samples by anatomical side (top), MSI status (middle) and CMS (bottom). Statistics are based on all bulk tumor datasets, including only those for which the relevant annotations are available. d, Bulk tumor datasets: alluvial plot demonstrating the relationship between IMF classification and anatomical side, MSI status, CMS subtype and iCMS. e, Heatmap showing the coexpression pattern of 2,873 bulk tumor transcriptomes from 14 clinical cohorts. Rows are genes; columns are patients; ordering is by unsupervised hierarchical clustering. Gene expression values are normalized as in b. CMS, iCMS and CRIS labels are indicated above the map, together with selected clinical parameters. Annotation bars for four major tumor cell types are as in b. f, Kaplan–Meier plot of RFS of patients classified by CMS and iCMS. The table below the graph indicates the number of patients at risk for all groups at various time points, followed by the number of events and median survival (in months) with their confidence intervals. g, Summary table of survival analysis conducted in this study. P values are Cox proportional hazard models (as implemented by R survival package). FDR, False Discovery Rate.
Fig. 4
Fig. 4. Relationship of iCMS to genomic features.
a, Copy number variation by chromosome arm in 659 patients from TCGA and SG-Bulk cohorts. Samples are ordered as i2_MSS, i3_MSS, i3_MSI. p53 mutation status is shown on the right for each sample. b, TMB in iCMS2_MSS (n = 389), iCMS3_MSS (n = 195) and iCMS3_MSI (n = 116) samples from TCGA and SG-Bulk data. Pairwise P values: two-sided Wilcoxon rank-sum test; overall P value: Kruskal–Wallis test. c, Scatterplot of proportion of TCGA and SG-Bulk samples with mutations in 333 CRC-associated genes, in iCMS2 (n = 344) versus iCMS3 (n = 281) (top) and iCMS2_MSS (n = 338) versus iCMS3_MSS (n = 181) (bottom). Dot size corresponds to Q value by two-sided Fisher’s exact test with Benjamini–Hochberg correction. Only genes with Q value < 0.05 and proportion mutated > 0.2 are labeled. d, Violin plot showing the expression fold-change of 715 iCMS marker genes in i2 relative to i3, categorized by copy number status. CNV Up, DEGs on chromosomal arms with frequent increase in copy number in i2; CNV Down, DEGs on arms with frequent loss of copy number in i2; red font, DEGs whose expression fold-change is discordant with the copy number change; blue font, concordant. e, GSEA results of MSigDB hallmark pathways in iCMS2 versus iCMS3. X axis, normalized enrichment score in iCMS2 relative to iCMS3. FC, fold-change.
Fig. 5
Fig. 5. Relationship of iCMS and IMF to common cancer pathways.
ac, Heatmaps of mutation landscape (top), methylation (middle; a only) and bulk expression (bottom) of selected genes in the WNT (a), MAPK (b) and TGF-beta (c) pathways, across TCGA samples (n = 209). In the mutation Oncoprint, colors depict the type of mutation; a barplot of the cumulative frequency of each mutation is shown to the right, and the total frequency of mutations in each gene is shown to the left. The methylation heatmap is colored by beta-value, the gene expression heatmap is colored by scaled expression and the right annotation bar shows the average scaled expression of each gene across four major cell types (epithelial, immune, fibroblast, endothelial) from CRC-SG1 scRNA-seq data. In a, beta-catenin protein expression by reverse-phase protein arrays (RPPA) is displayed below the gene expression heatmap. d, Proportion of BRAF mutation classes in iCMS3_MSI (n = 48), iCMS3_MSS (n = 14) and iCMS2_MSS (n = 4) samples with BRAF mutations, in TCGA and SG-Bulk. e, Proportion of mutations in KRAS exons in iCMS3_MSI (n = 31), iCMS3_MSS (n = 88) and iCMS2_MSS (n = 87) samples with KRAS mutations, in TCGA and SG-Bulk. Number of samples in each group is labeled.
Fig. 6
Fig. 6. Epithelial cell interactions with microenvironment.
a, Heatmap of the average scaled gene expression of cell-type-specific signatures of the nine major cell types in 577 bulk samples from TCGA and SG-Bulk datasets. b,c, UMAP of T cells (b) (n = 76,812 cells) and fibroblasts (c) (n = 31,451 cells) from 14 patients in CRC-SG1 dataset, colored by subtypes, used in signaling analyses. d, NicheNet analysis using i2 up gene set (left) and i3 up gene set (right). The heatmap depicts the regulatory potential scores (purple) for the top 200 target genes of each of the top 20 ligands ranked by Pearson correlation (orange) after filtering at a quantile cutoff of 0.33 for the regulatory potential score. The dotplot on the right depicts the average scaled patient-wise pseudo-bulk expression of each of the top-ranked ligands in each cell type across patients in the CRC-SG1 cohort. Dot size corresponds to the percentage of cells expressing the ligand in each cell type. e, Metascores for top three inflammation-related pathways identified by GSEA, in 577 bulk samples from TCGA and SG-Bulk, split by IMF: i2_MSS (n = 240), i2_fibrotic (n = 82), i3_MSS (n = 92), i3_fibrotic (n = 58), i3_MSI (n = 105). f, CXCL13 and cytotoxicity gene program scores (from Pelka et al. ) in 462 bulk samples from TCGA, split by IMF: i2_MSS (n = 189), i2_fibrotic (n = 71), i3_MSS (n = 74), i3_fibrotic (n = 48), i3_MSI (n = 80). In e and f, P values are by two-sided Wilcoxon rank-sum test without adjustment of multiple comparison. DE, Differentially expressed; SM, Smooth Muscle.
Fig. 7
Fig. 7. Association of iCMS markers with polyp subtypes and normal tissues.
a,b, Heatmaps of tubular adenoma (AD) (a) and SSL (b) marker genes obtained from Chen et al. , colored by the average of scaled (z-transformed) expression values of epithelial single cells from five-cohort scRNA-seq data (patients = 61). c, Barplots quantify enrichment of tissue-specific genes in each of the four DEG sets, calculated using the TissueEnrich package (iCMS2 Up: 308; iCMS2 Down: 279; iCMS3 Up: 74; iCMS3 down: 54; total: 715). Red line, P = 0.1. The heatmaps show expression levels of the seven iCMS3-Up DEGs defined as stomach-specific in the TissueEnrich database. Left, scaled expression in diverse tissues. Right, scaled epithelial pseudo-bulk expression in 61 patients. d, Heatmap of gastric metaplasia signature genes, similar to a and b. e, Heatmap of GSEA leading edge genes within crypt top and crypt bottom gene sets, showing scaled epithelial pseudo-bulk expression levels across 61 patients from five scRNA-seq cohorts.
Fig. 8
Fig. 8. The proposed IMF classification of CRC.
a, Percentage of samples (n = 577) from TCGA/SG-Bulk/CMS cohorts with complete CMS/iCMS/MSI calls broken down by epithelial traits as rows (intrinsic epithelial subtype, microsatellite instability status) and bulk tumor CMS classification as columns. The five most frequent combinations, which account for 520 of 577 samples (~90%), are indicated as shaded and defined as IMF subtypes in b. b, Schematic model of IMF classification comprising a sequential layered classification based on intrinsic CMS subtypes, MSI status and fibrosis (as represented by CMS4), key clinico-molecular features, immune response signatures and single-cell-derived cell-type-specific signatures. Color intensity in table: expression rank in Fig. 6e,f (immune response), Fig. 6a and Extended Data Fig. 8 (fibroblast, endothelial, McDc, T and NK), with the darkest color denoting strongest expression. ICB, immune checkpoint blockade.
Extended Data Fig. 1
Extended Data Fig. 1. QC cut off for all cells in 5 cohorts.
Violin plot showing number of detected genes (NODG) distribution of each sample in their respective cell types. Solid red lines indicate median NODG across 211 samples in each respective cell type, while dashed blue lines indicate 2 or 0.5 times the red line. Magenta box highlight samples with median NODG consistently higher or lower than the dashed blue lines in more than half of the cell types, which were discarded from this study (22 samples from 9 patients). b. Density plot and numeric table for all cell types in 5 cohorts before and after quality control (QC). Red lines in the density plots indicate the QC parameter that was used. The 11 major cell types are: B cells (B), Endothelial cells, Epithelial cells, Fibroblast cells, Granulocyte cells, monocyte conventional dendritic cell (McDC), Plasma-B cells, T and NK cells (T_NK).
Extended Data Fig. 2
Extended Data Fig. 2. Sub-clustering of all major cell type in CRC-SG1 cohorts.
a. (Left) UMAP visualization of clusters representing major cell types in CRC-SG1 (n = 208,367), (Right) Epithelial sub-cluster colored by cluster ID, tumor sectors, and sample ID (n = 15,920). b. UMAP visualization of B (n = 19,088 cells), Plasma-B (n = 26,710 cells), Endothelial (n = 6,875 cells), monocyte conventional dendritic cell (McDC) (n = 26,127 cells), Fibroblast (n = 31,415 cells), and T and NK (T_NK) (n = 76,812 cells) subclusters from 14 patients in CRC-SG1 dataset, colored by tumor sectors (upper panel), patient ID (middle panel), and sample ID (lower panel).
Extended Data Fig. 3
Extended Data Fig. 3. The bimodality of iCMS subtypes.
a. Density plot of 42,010 tumor epithelial cells from 5 cohorts in iCMS metagene space. The mode at the bottom right of the scatterplot corresponds to iCMS2 cells, while the opposite mode corresponds to iCMS3. b. UMAP visualization of 42,010 tumor epithelial cells from 5 cohorts in transcriptomic space colored by iCMS score for each individual cell, defined as (iCMS2 metagene expression score) - (iCMS3 metagene expression score). c. UMAP visualization of tumor epithelial cells from 5 cohorts in transcriptomic space, grouped by patients, and colored by iCMS label. The numbers next to patient ID in each plot indicates the total number of tumor epithelial cells for that particular patient. The percentage on the bottom right of the UMAP indicates the number of cells that were clustered in i2 clusters (purple color) or i3 clusters (orange color).
Extended Data Fig. 4
Extended Data Fig. 4. iCMS classification in 15 bulk datasets.
a. Heatmap of 715 iCMS genes used to classify 3,614 samples across 15 datasets by NTP, colored by scaled gene expression, arranged by sum of expression of signature genes. Top annotation bars show clinical information for each sample (dataset, gender, side, stage, MSI status, CMS, iCMS). Bottom annotation shows the FDR of NTP classification. b. Proportions of gender, stage, histological type and CRIS subgroup from 15 bulk datasets; number of samples in each group is labelled. For each analysis, only samples with information available were used. c. Proportions of methylation subtype (n = 182, top, as defined in the original paper), expression subtype (n = 169, middle) and TCGA subtype (n = 419, bottom) in iCMS2_MSS, iCMS3_MSS and iCMS3_MSI from TCGA; number of samples in each group is labelled. (d,e) Kaplan-Meier plot of overall survival (d) and survival after relapse (e) for all patients classified by CMS and iCMS.
Extended Data Fig. 5
Extended Data Fig. 5. Genomic features in iCMS, MSI, and CIMP status.
a. Log2 copy-number ratios for each chromosome arm in iCMS2_MSS (n = 363), iCMS3_MSS (n = 189) and iCMS3_MSI (n = 107) from TCGA and SG-Bulk datasets. P-values for pairwise comparisons are by two-sided Wilcoxon rank-sum test; overall p-value is by Kruskal-Wallis test. Scatterplot of proportion of TCGA and SG-Bulk samples with mutations in 333 CRC-associated genes, in b. MSS (n = 519) vs MSI (n = 101) and c. iCMS3_MSS (n = 181) vs iCMS3_MSI (n = 99) (right). Dot size corresponds to q-value by Fisher’s exact test with Benjamini-Hochberg correction. Only genes with q-value <0.05 and proportion mutated > 0.5 are labelled. (d) Heatmap of differentially methylated CpG sites (n = 978) between iCMS2 and iCMS3 subtypes in 176 TCGA samples.
Extended Data Fig. 6
Extended Data Fig. 6. Wnt pathway alterations in iCMS.
a. Scaled gene expression of selected Wnt pathway genes in iCMS2_MSS (n = 389), iCMS3_MSS (n = 195) and iCMS3_MSI (n = 116), from TCGA and SG-Bulk datasets. b. Beta-catenin protein levels, by RPPA, in iCMS2_MSS (n = 216), iCMS3_MSS (n = 117) and iCMS3_MSI (n = 67) from TCGA data. P-values for pairwise comparisons are by two-sided Wilcoxon rank-sum test with no correction; overall p-value is by Kruskal-Wallis test. c. Cumulative frequencies of truncating (nonsense and frameshift) APC mutations by position from TCGA and SG-Bulk patients with APC mutations (n = 342), in iCMS2 and iCMS3 (left), iCMS2-MSS vs iCMS3-MSS vs iCMS3-MSI (middle), as well as IMF 5 groups (right). P-value is by two-sided Kolmogorov–Smirnov test. d. Proportion of APC mutation types (left) and regions (right) in samples with APC mutations from TCGA and SG-Bulk data (n = 574). Comparisons are between iCMS2/iCMS3 (top), and iCMS2_MSS/iCMS3_MSS/iCMS3_MSI (bottom). e. APC variant allele frequency (VAF) in iCMS2_MSS (n = 343), iCMS3_MSS (n = 172) and iCMS3_MSI (n = 46) from TCGA data. P-values are by two-sided Wilcoxon rank-sum test with no correction f. Mutational landscape of selected Wnt pathway genes in iCMS2 (left, n = 344) and iCMS3 (right, n = 281) samples in TCGA and SG-Bulk datasets. g. Proportion of samples in TCGA and SG-Bulk datasets (n = 626) with wild type (wt) or mutations (mut) in RNF43 (top) and ZNRF32 (bottom); number of samples in each group is labelled.
Extended Data Fig. 7
Extended Data Fig. 7. MAPK and TGF-beta pathways in iCMS.
Proportion of mutation types and locations in a. KRAS (n = 206) and b. NRAS (n = 27) in samples with KRAS/NRAS mutations from TCGA and SG-Bulk data; number of samples in each group is labelled. Comparisons are between iCMS2/iCMS3 (top), and iCMS2_MSS/iCMS3_MSS/iCMS3_MSI (bottom). c. Scaled gene expression of selected MAPK pathway genes in iCMS2 (n = 396) and iCMS3 (n = 312), from TCGA and SG-Bulk datasets. P-values shown are by two-sided Wilcoxon rank-sum test without correction. d. Mutational landscape of selected TGF-beta pathway genes in iCMS2 (top, n = 344) and iCMS3 (bottom, n = 281) samples in TCGA and SG-Bulk datasets. e. Scaled gene expression of selected TGF-beta pathway genes iCMS2 (n = 396) and iCMS3 (n = 312) (left) and across the IMF 5 categories: i2_MSS (n = 240), i2_fibrotic (n = 82), i3_MSS (n = 92), i3_fibrotic (n = 58), i3_MSI (n = 105) (right). P-values are calculated using two-sided Wilcoxon rank-sum test without correction.
Extended Data Fig. 8
Extended Data Fig. 8. Tumor microenvironment in IMF classes.
a. Boxplot of the average scaled gene expression of cell type-specific signatures of the 9 major cell types in 577 bulk samples from TCGA and SG-Bulk datasets, split by IMF. Center line indicate the median, and box edges indicate the 25th (Q1) and 75th (Q3) percentiles. Whiskers are plotted at 1.5xIQR and data beyond the end of the whisker are outliers. b. Heatmap of the EPIC cell fractions across the major cell types in TCGA and SG-Bulk datasets (n = 577). EPIC was performed on these datasets using the in-house cell type categories and reference panel. EPIC scores were log-transformed, zero-centered and scaled to unit variance. Columns are patients ordered by IMF, and rows are cell types ordered by unsupervised hierarchical clustering. c. Tumor purity estimate of samples from TCGA (left), SG-Bulk (middle) and TCGA + SG-Bulk (right), split by IMF. TCGA: iCMS2_MSS (n = 96), iCMS2_fibrotic (n = 44), iCMS3_MSS (n = 42), iCMS3_fibrotic (n = 33), iCMS3_MSI (n = 49). SG-Bulk: iCMS2_MSS (n = 51), iCMS2_fibrotic (n = 11), iCMS3_MSS (n = 18), iCMS3_fibrotic (n = 10), iCMS3_MSI (n = 25). TCGA + SG-Bulk: iCMS2_MSS (n = 147), iCMS2_fibrotic (n = 55), iCMS3_MSS (n = 60), iCMS3_fibrotic (n = 43), iCMS3_MSI (n = 74). P-values are by two-sided Wilcoxon rank-sum test without correction. Center line indicate the median, and box edges indicate the 25th (Q1) and 75th (Q3) percentiles. Whiskers are plotted at 1.5xIQR and data beyond the end of the whisker are outliers. d. Mapping of differentially expressed genes between iCMS2_MSS_F and iCMS3_MSS_F onto CRC-SG1 pseudobulk expression matrix by cell type. The heatmap on the left shows genes upregulated in iCMS2_MSS_F compared to iCMS3_MSS_F, while the heatmap on the right shows genes upregulated in iCMS3_MSS_F compared to iCMS2_MSS_F.
Extended Data Fig. 9
Extended Data Fig. 9. Comparison of metagene signature of selected GSEA-Hallmark pathway in single cell epithelial cells across iCMS classes.
Box plots of metagene scores comparing iCMS2 (n = 35) versus iCMS3 (n = 23) in patient-specific pseudo-bulk. Within the iCMS3 group, i3-MSI (n = 10) samples are labelled by red jitter points and i3-MSS samples are labelled by orange jitter points. The metagene scores for each patient pseudo-bulk was calculated by averaging the scaled expressions of all genes in the geneset in the given patient. P-values were calculated by two-sided Wilcoxon rank-sum test. Center line indicate the median, and box edges indicate the 25th (Q1) and 75th (Q3) percentiles. Whiskers are plotted at 1.5xIQR and data beyond the end of the whisker are outliers.
Extended Data Fig. 10
Extended Data Fig. 10. Comparison of metagene signature of selected histology, cell types & states of the colon (A) and drug response signatures (B) in single cell epithelial cells across iCMS classes.
Box plots of metagene scores comparing iCMS2 (n = 35) versus iCMS3 (n = 23) in patient-specific pseudo-bulk. Within the iCMS3 group, i3-MSI (n = 10) samples are labelled by red jitter points and i3-MSS samples are labelled by orange jitter points. The metagene scores for each patient pseudo-bulk was calculated by averaging the scaled expressions of all genes in the geneset in the given patient. P-values were calculated by two-sided Wilcoxon rank-sum test. Center line indicate the median, and box edges indicate the 25th (Q1) and 75th (Q3) percentiles. Whiskers are plotted at 1.5xIQR and data beyond the end of the whisker are outliers.

Comment in

Similar articles

Cited by

References

    1. Guinney J, et al. The consensus molecular subtypes of colorectal cancer. Nat. Med. 2015;21:1350–1356. doi: 10.1038/nm.3967. - DOI - PMC - PubMed
    1. Dienstmann R, et al. Consensus molecular subtypes and the evolution of precision medicine in colorectal cancer. Nat. Rev. Cancer. 2017;17:79–92. doi: 10.1038/nrc.2016.126. - DOI - PubMed
    1. Rodriguez-Salas N, et al. Clinical relevance of colorectal cancer molecular subtypes. Crit. Rev. Oncol. Hematol. 2017;109:9–19. doi: 10.1016/j.critrevonc.2016.11.007. - DOI - PubMed
    1. Ten Hoorn, S., de Back, T. R., Sommeijer, D. W. & Vermeulen, L. Clinical value of consensus molecular subtypes in colorectal cancer: a systematic review and meta-analysis. J. Natl Cancer Inst. 10.1093/jnci/djab106 (2021). - PMC - PubMed
    1. Bramsen JB, et al. Molecular-subtype-specific biomarkers improve prediction of prognosis in colorectal cancer. Cell Rep. 2017;19:1268–1280. doi: 10.1016/j.celrep.2017.04.045. - DOI - PubMed

Publication types

MeSH terms