. 2022 Jul;29(7):639-652.
doi: 10.1038/s41594-022-00790-y. Epub 2022 Jun 30.

Telomeric 8-oxo-guanine drives rapid premature senescence in the absence of telomere shortening

Affiliations

Telomeric 8-oxo-guanine drives rapid premature senescence in the absence of telomere shortening

Ryan P Barnes et al. Nat Struct Mol Biol. 2022 Jul.

Abstract

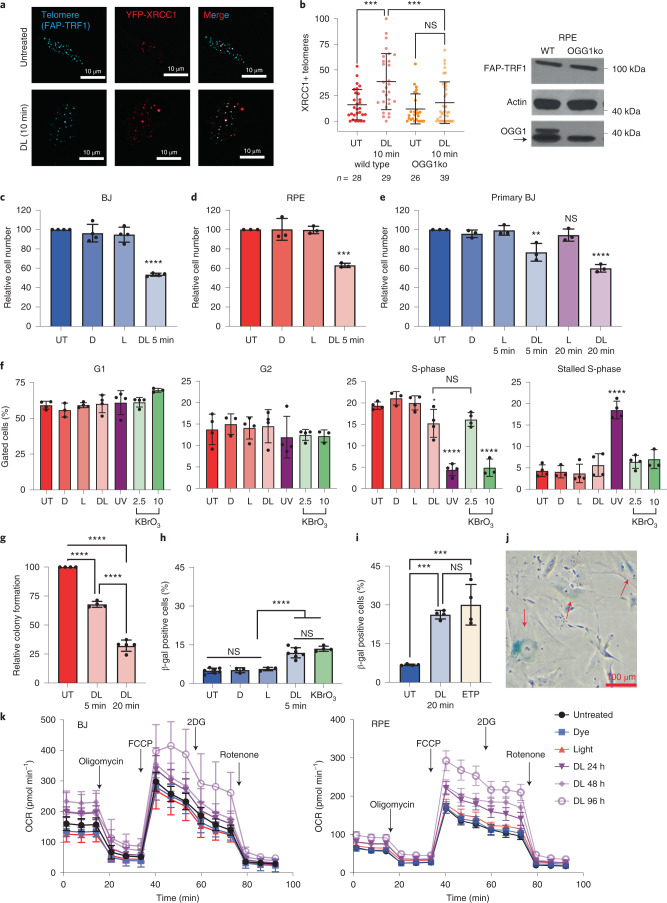
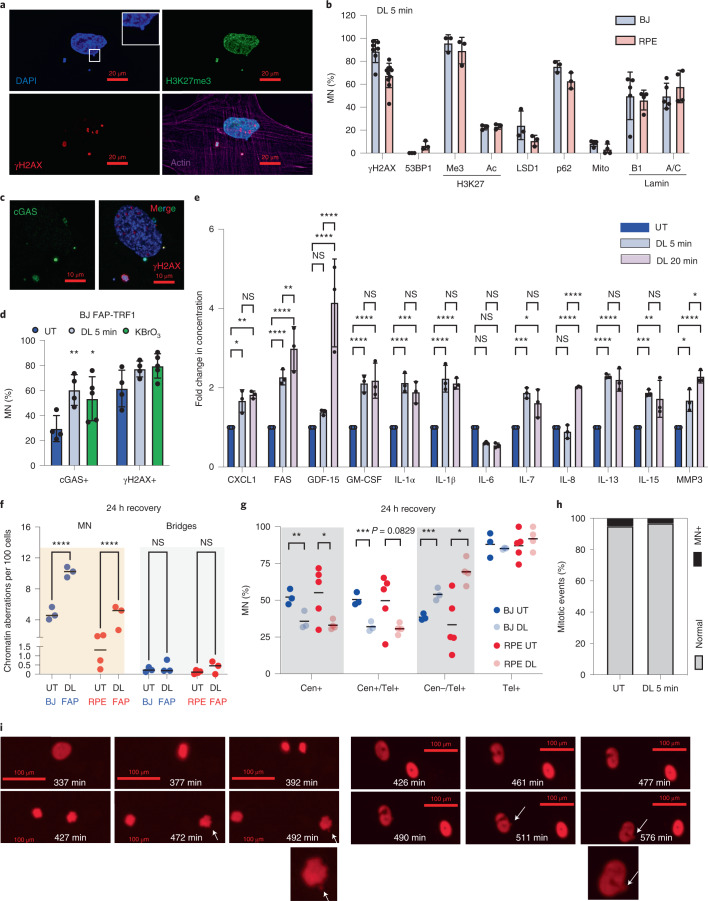
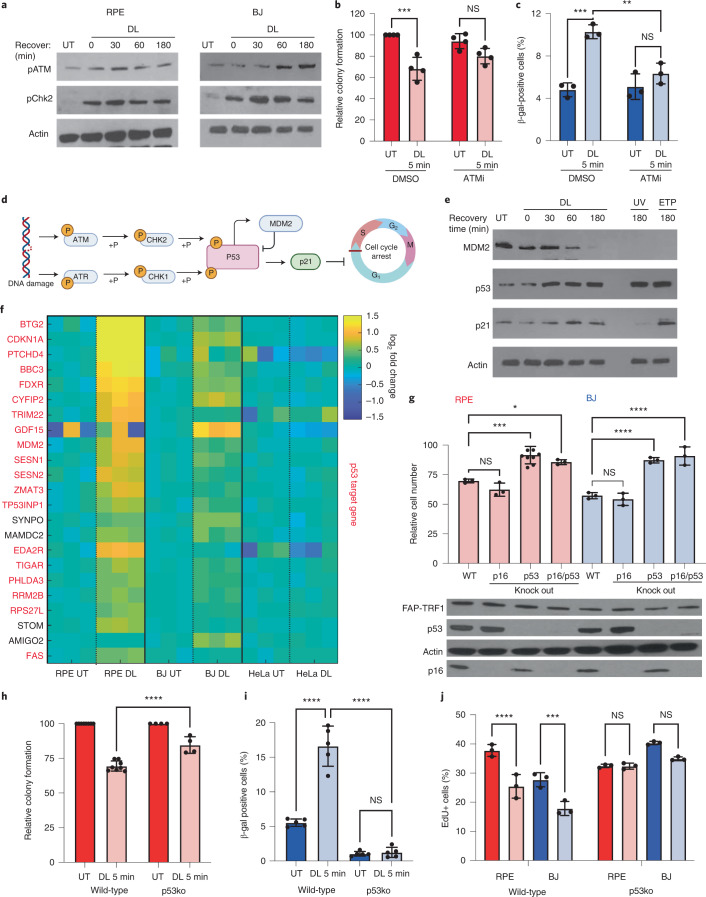
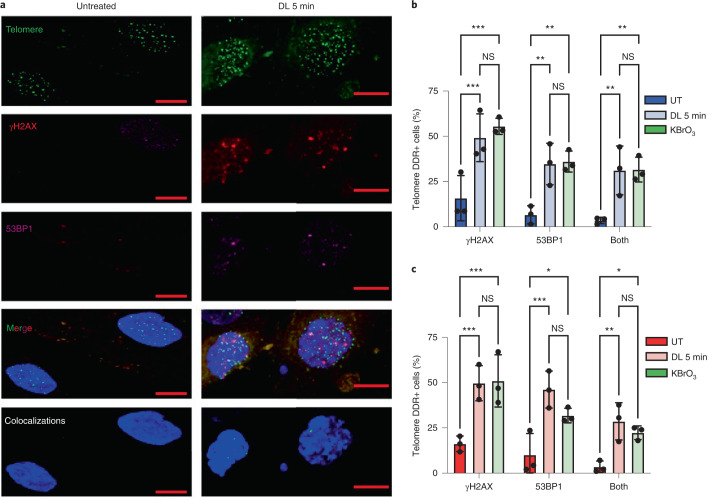
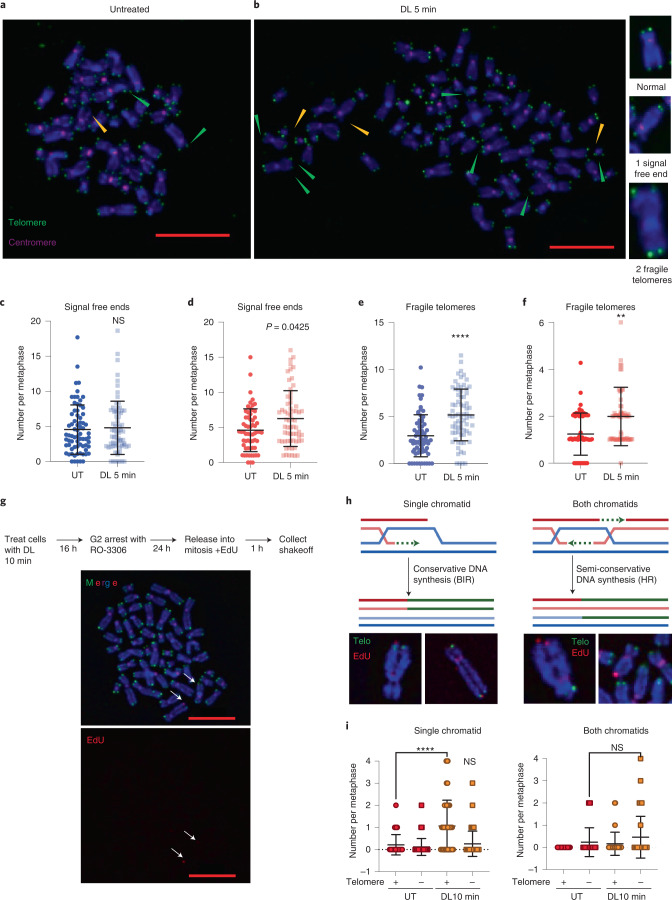
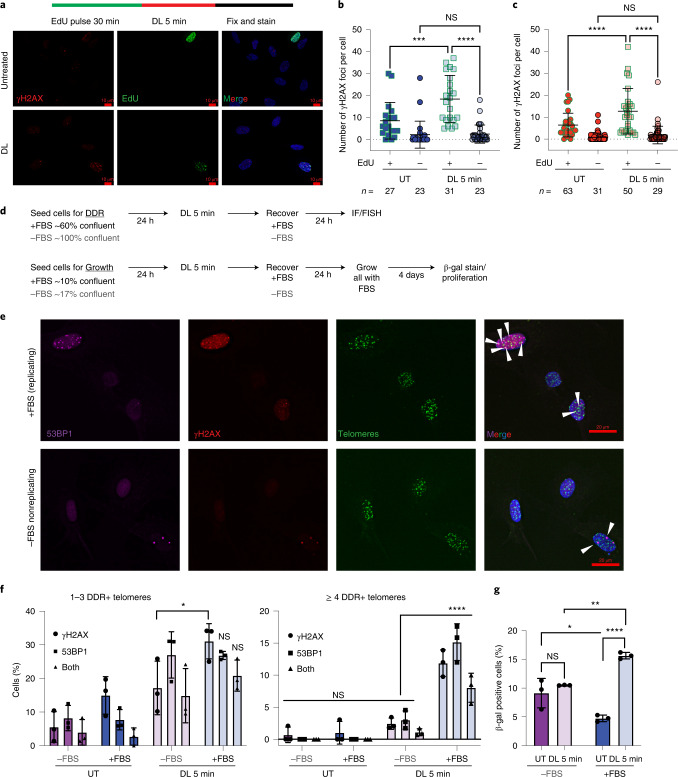
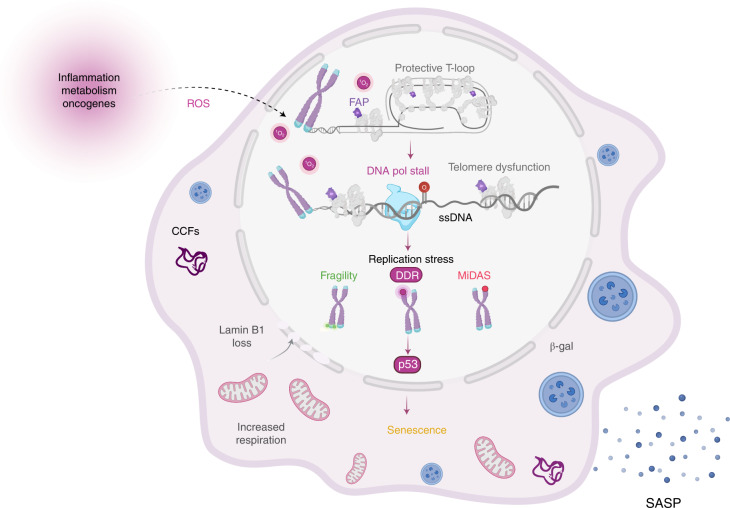
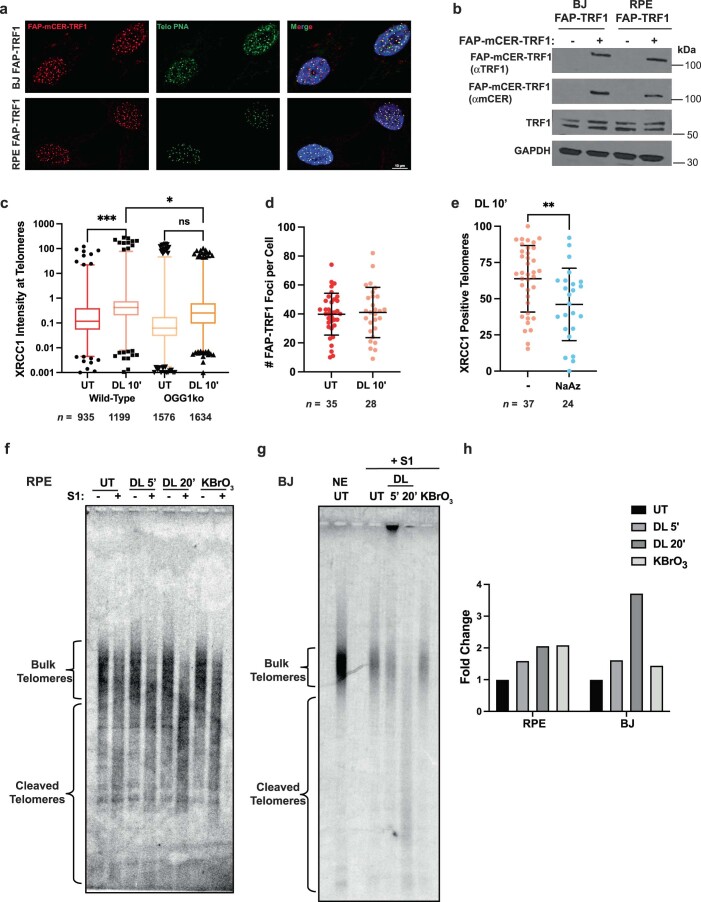
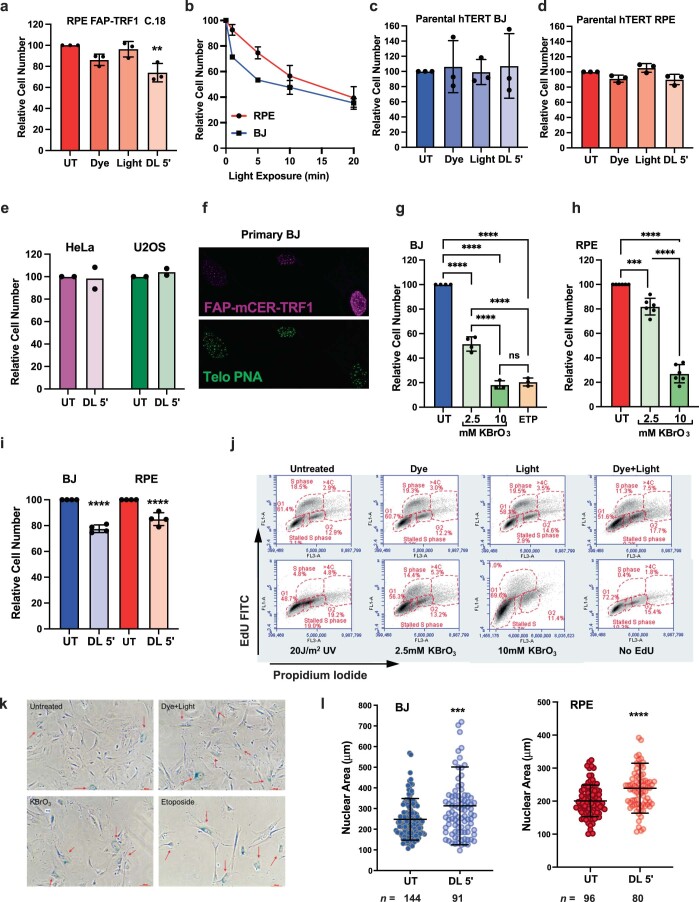
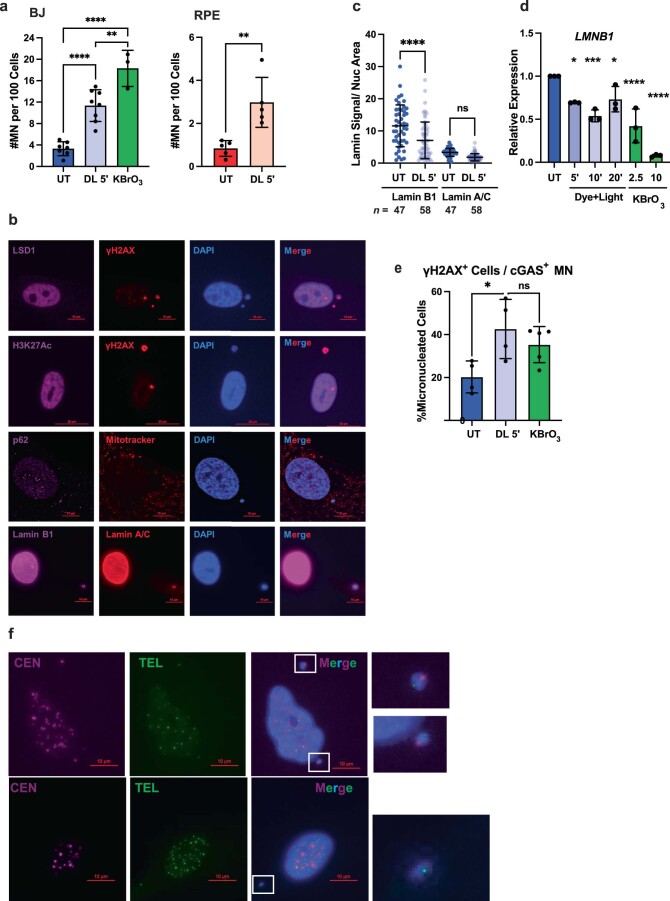
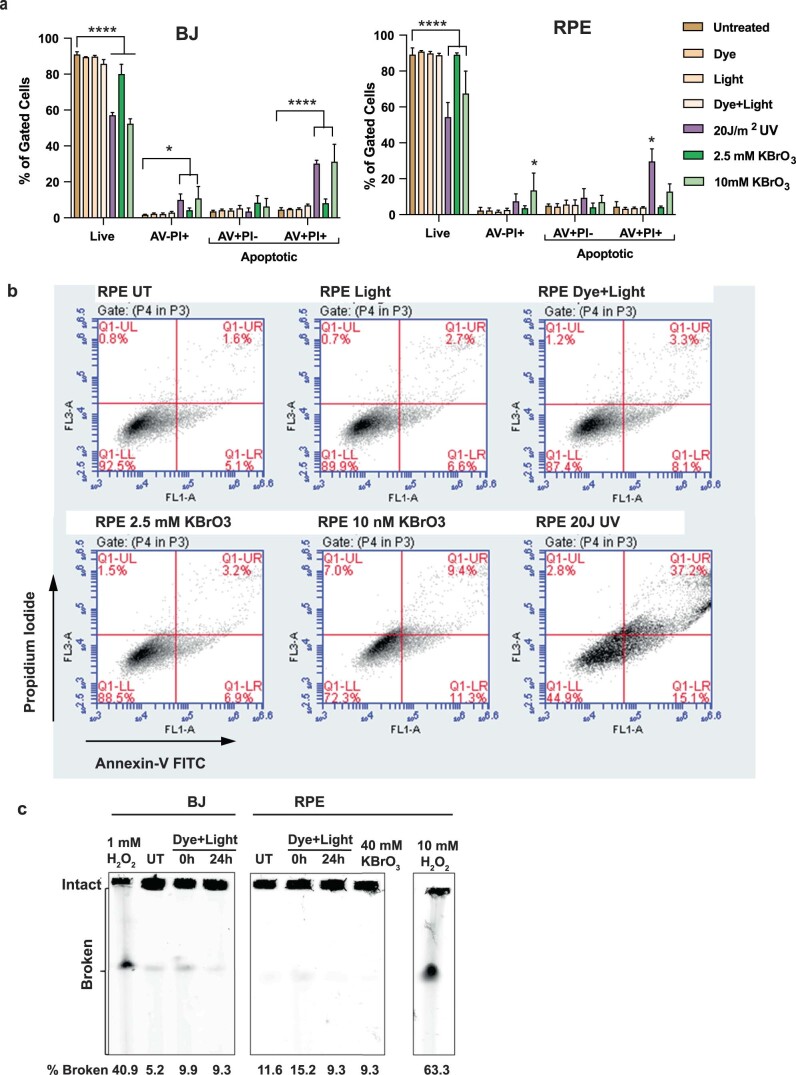
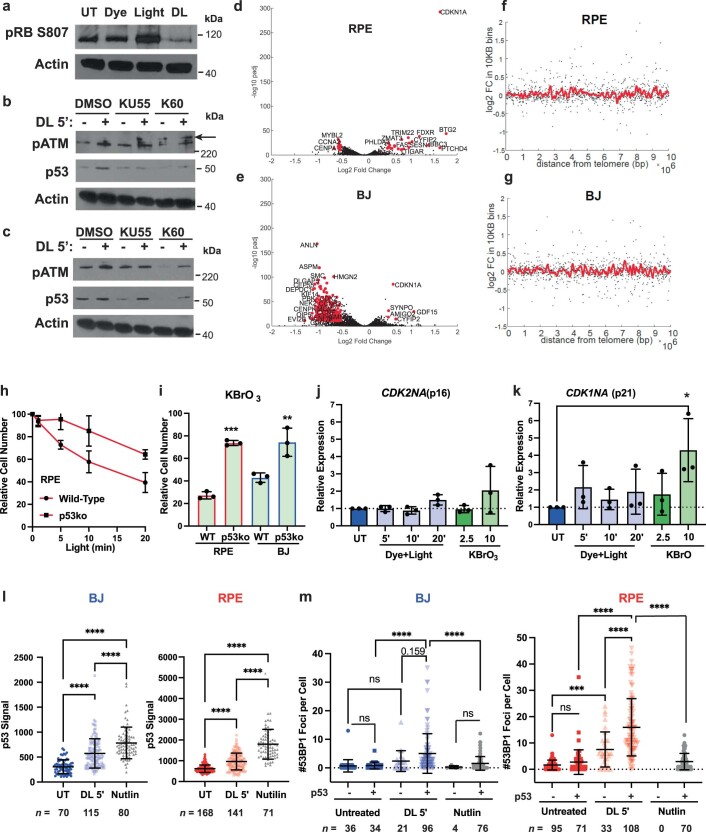
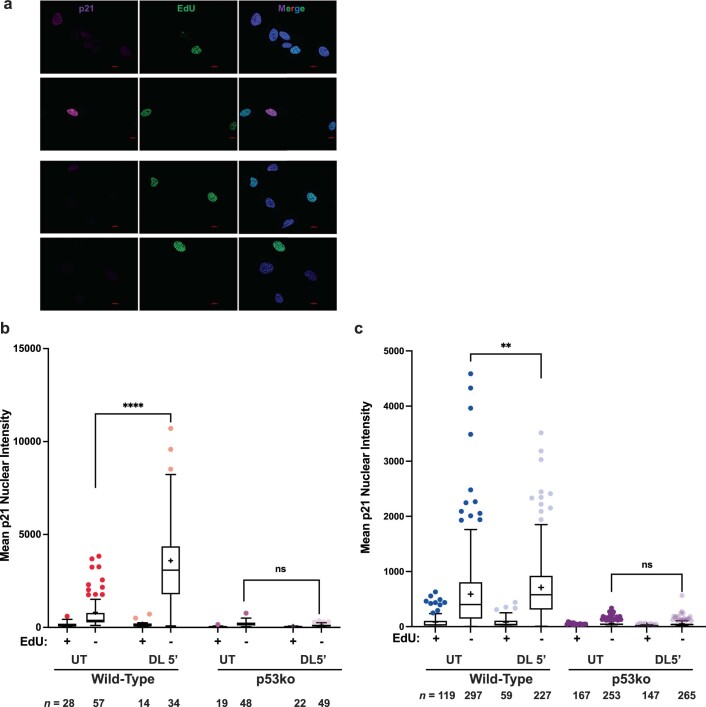
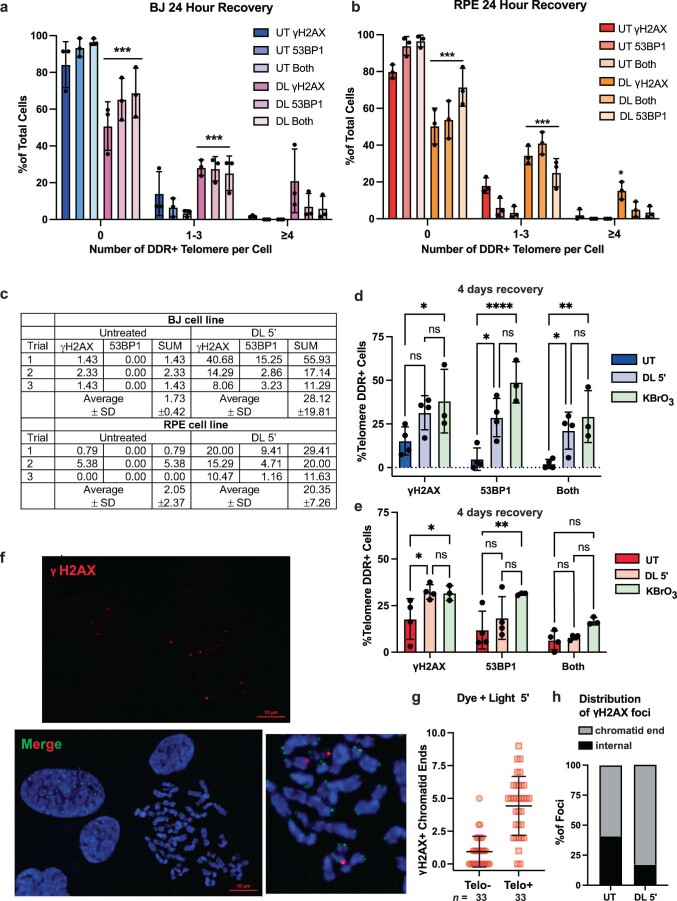
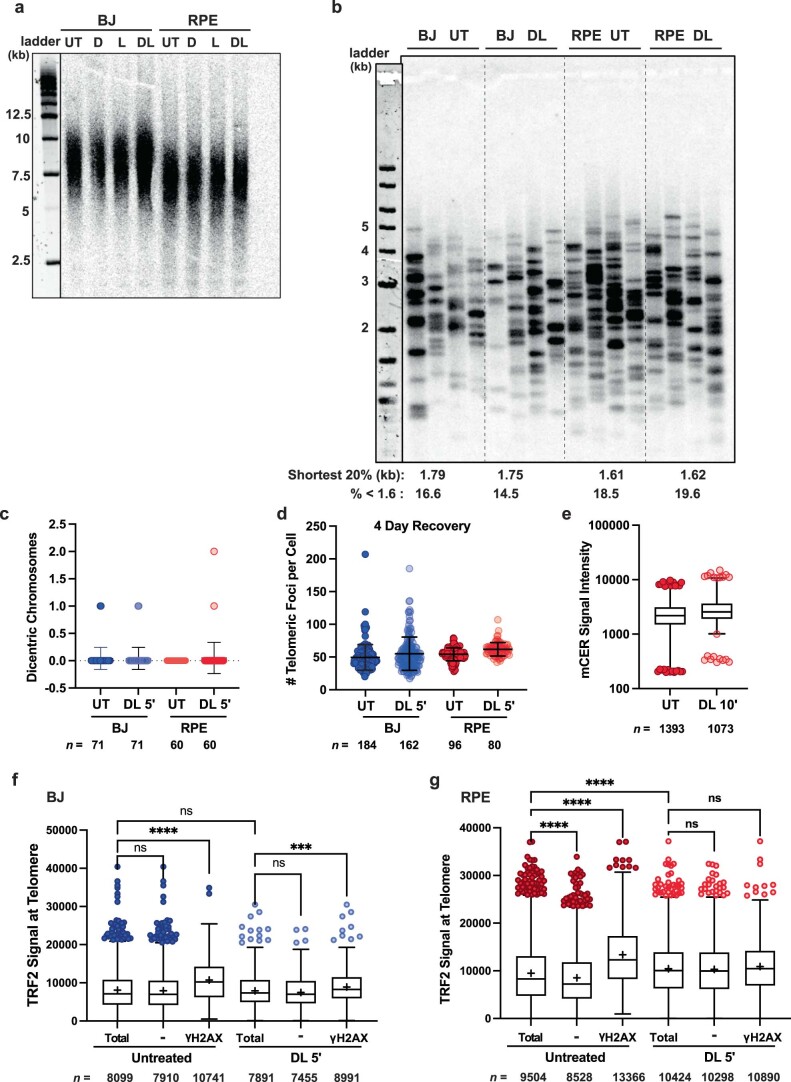
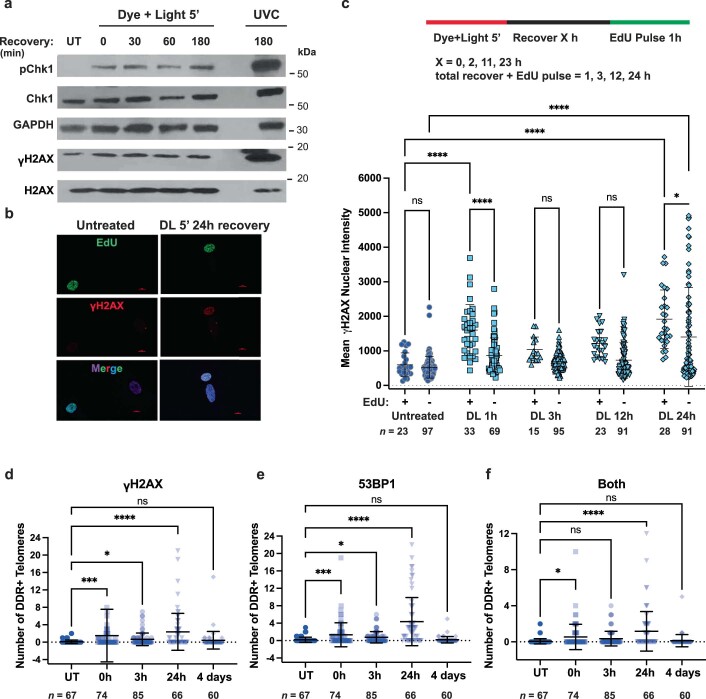
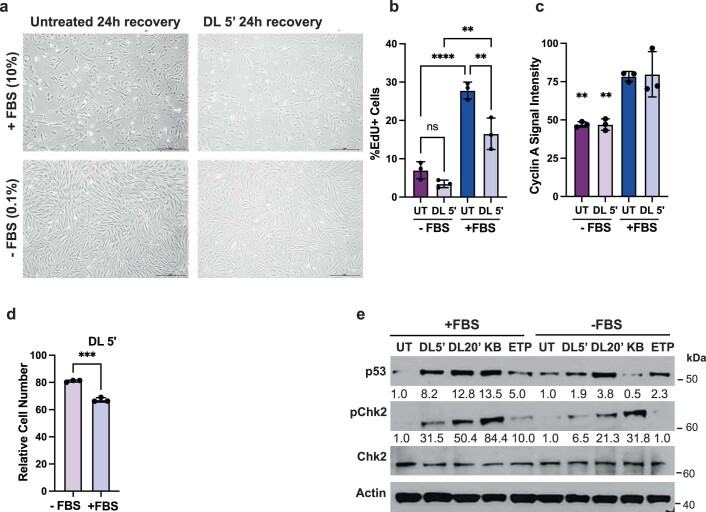
Oxidative stress is a primary cause of cellular senescence and contributes to the etiology of numerous human diseases. Oxidative damage to telomeric DNA has been proposed to cause premature senescence by accelerating telomere shortening. Here, we tested this model directly using a precision chemoptogenetic tool to produce the common lesion 8-oxo-guanine (8oxoG) exclusively at telomeres in human fibroblasts and epithelial cells. A single induction of telomeric 8oxoG is sufficient to trigger multiple hallmarks of p53-dependent senescence. Telomeric 8oxoG activates ATM and ATR signaling, and enriches for markers of telomere dysfunction in replicating, but not quiescent cells. Acute 8oxoG production fails to shorten telomeres, but rather generates fragile sites and mitotic DNA synthesis at telomeres, indicative of impaired replication. Based on our results, we propose that oxidative stress promotes rapid senescence by producing oxidative base lesions that drive replication-dependent telomere fragility and dysfunction in the absence of shortening and shelterin loss.


Conflict of interest statement

M.P.B. is a founder in Sharp Edge Labs, a company applying the FAP-fluorogen technology commercially. The remaining authors declare no competing interests.

Figures

Fig. 1
Fig. 1. Acute telomeric 8oxoG initiates rapid premature senescence.
a, YFP-XRCC1 localization to telomeres indicated by FAP-mCer-TRF1 after 10 min dye + light (DL) treatment of RPE FAP-TRF1 cells. b, Percent YFP-XRCC1 positive telomeres per nucleus after no treatment (UT) or 10 min DL in wild-type or OGG1ko RPE FAP-TRF1 cells. Error bars represent the mean ± s.d. from the indicated number n of nuclei analyzed from a representative experiment. Statistical analysis by one-way ANOVA (***P < 0.001). Immunoblot for FAP-TRF1 and OGG1 in extracts from RPE FAP-TRF1 wild-type and OGG1ko cells. Arrow indicates nonspecific band stained by anti-OGG1. ce, Cell counts of BJ (c), RPE (d) or primary BJ (e) FAP-TRF1 cells obtained 4 days after recovery from 5 or 20 min dye (D) and light (L) alone, or in combination (DL) as indicated, relative to untreated cells. f, RPE FAP-TRF1 cell cycle analysis 24 h after no treatment or 5 min D, L, DL, 20 J m–2 UVC, or 1 h with 2.5 or 10 mM KBrO3 determined by flow cytometry. g, RPE FAP-TRF1 colony formation efficiency 7–10 days after indicted treatment. h,i, Percent β-galactosidase-positive BJ FAP-TRF1 cells obtained 4 days after the indicated treatments; 2.5 mM KBrO3 and 50 μM ETP treatments were for 1 h. In ci, error bars represent the mean ± s.d. from the number of independent experiments indicated by the black circles. Statistical significance was determined by one-way ANOVA (ns, not significant; *P < 0.05; **P < 0.01; ***P < 0.001; ****P < 0.0001). j, Representative image of 5 min DL-treated BJ FAP-TRF1 β-galactosidase-positive cells. Arrows mark positive cells (turquoise). k, Mitochondrial respiration was examined 24, 48 and 96 h after 5 min D, L or DL. Data are means and error bars are ±95% CI from two independent experiments with seven to eight technical replicates each for BJ and RPE FAP-TRF1 cells. Source data
Fig. 2
Fig. 2. Telomeric 8oxoG production increases cytoplasmic DNA.
a, Image of γH2AX, H3K27me3 and actin in BJ FAP-TRF1 cells 4 days after 5 min DL. Inset, enlargement of blebbing MN. b, Percentage of MN positive for the indicated markers from BJ and RPE FAP-TRF1 cells 4 days after 5 min DL. Error bars represent the mean ± s.d. from the number of independent experiments indicated by black circles. c, BJ FAP-TRF1 cells stained for cGAS and γH2AX 4 days after 5 min DL treatment. d, Percentage of MN that are cGAS or γH2AX positive 4 days after 5 min DL or 1 h 2.5 mM KBrO3 treatment as in panel c. e, SASP analysis of BJ FAP-TRF1 cells 7 days post-treatment with 5 or 20 min DL. Concentration normalized to the final cell number in each sample. Data are presented as fold changes. Actual concentrations are in Supplementary Table 1. f, Quantification of MN and chromatin bridges 24 h after DL as visualized by DAPI. At least 500 cells were counted per experiment. g, Quantification of MN from panel f showing the percentage of MN positive for centromeric (Cen+) or telomeric (Tel+) DNA in total, and the percentage positive for both (Cen+/Tel+) or only telomeric DNA (Cen–/Tel+). At least 30 MN were analyzed for each experiment. For panels dg, error bars represent the mean ± s.d. from the number of independent experiments indicated by the black (d,e) or red and blue (f,g) circles. Statistical significance for panels df determined by two-way ANOVA, and for panel g by multiple t-tests (ns, not significant; *P < 0.05; **P < 0.01; ***P < 0.001; ****P < 0.0001). h, Percentage of mitoses resulting in a MN from live imaging of BJ FAP-TRF1 cells 24 h following 5 min DL. For UT n = 60 and DL 5 min n = 64 mitoses observed from two independent experiments. i, Stills from live-cell imaging. Left panel, a mitosis that produced a MN (arrow); right panel, an interphase cell with nuclear blebbing (arrow). Source data
Fig. 3
Fig. 3. p53 DNA damage signaling is required for 8oxoG-induced senescence.
a, Immunoblots of phosphorylated ATM (pATM) and phosphorylated Chk2 (pChk2) at the indicated recovery time following 5 min DL. b, RPE FAP-TRF1 colony formation after 7 days recovery from DL. Cells were cultured with ATMi KU60019 or DMSO only during recovery. Numbers are relative to untreated DMSO control. c, Percentage of β-gal positive BJ FAP-TRF1 cells obtained 4 days after DL. Cells were cultured with ATMi KU60019 or DMSO only during recovery. d, Schematic of canonical DNA damage-induced p53 activation by ATM and ATR kinases. Created with Biorender.com. e, Immunoblot of untreated BJ FAP-TRF1 cells, or treated with DL and recovered for the indicated times. UV = 20 J m–2 UVC. ETP = 1 h 50 μM ETP. f, Heat map of mRNASeq results from FAP-TRF1-expressing RPE, BJ and HeLa cells 24 h after no treatment (NT) or 5 min DL. Shown are the top altered genes and p53 target genes are in red. Each column is an independent replicate. g, Cell counts of wild-type, p16ko, p53ko or p16+p53 double ko of BJ (blue) or RPE (red) FAP-TRF1 cells 4 days after recovery from 5 min DL relative to respective untreated cells. Immunoblot below shows FAP-TRF1, p53, p16 expression. h, RPE FAP-TRF1 colony formation after 7 days recovery from DL. i, Percentage of β-gal positive BJ FAP-TRF1 cells obtained 4 days after treatment. j, Percent EdU-positive cells observed 24 h after 5 min DL (light red or light blue). Over 200 cells were scored per condition in each experiment. For b,c, and gj, error bars represent the mean ± s.d. from the number of independent experiments indicated by the black circles. Statistical significance in b,c and hj determined by two-way ANOVA, and for g by one-way ANOVA (ns, not significant; *P < 0.05; **P < 0.01; ***P < 0.001; ****P < 0.0001). Source data
Fig. 4
Fig. 4. Telomeric 8oxoG promotes a localized DDR.
a, Representative IF images showing γH2AX (red) and 53BP1 (purple) staining with telomeres (green) by telo-FISH for BJ FAP-TRF1 cells 24 h after no treatment or 5 min DL. Colocalizations panel shows NIS-Elements-defined intersections between 53BP1 and/or γH2AX with telomeres. Scale bars, 10 μm. b,c, Quantification of percentage of cells exhibiting telomere foci colocalized with γH2AX, 53BP1 or both for BJ (b) and for RPE (c) FAP-TRF1 cells 24 h after 5 min DL or 2.5 mM KBrO3 treatment. Error bars represent the mean ± s.d. from three independent experiments in which more than 50 nuclei were analyzed per condition for each experiment. Statistical significance determined by two-way ANOVA (ns, not significant; *P < 0.05; **P < 0.01; ***P < 0.001). Source data
Fig. 5
Fig. 5. 8oxoG directly disrupts telomere replication.
a,b, Representative images of telo-FISH staining of metaphase chromosomes from BJ FAP-TRF1 p53ko cells 24 h after no treatment (a) or 5 min DL b, Images were scored for telomeric signal-free ends (yellow arrowheads) and fragile telomeres (green arrowheads). Green foci are telomeres and pink foci are CENPB centromeres. Scale bars, 10 μm. c,d, The number of telomeric signal-free chromatid ends per metaphase in BJ (c) and RPE (d) FAP-TRF1 cells. e,f, The number fragile telomeres per metaphase in BJ (e) and RPE (f) FAP-TRF1 cells. For c–f, error bars represent mean ± s.d. from n = 71 (UT) and 72 (DL 5 min) for BJ and n = 61 (UT) and 63 (DL 5 min) for RPE, metaphases analyzed from three independent experiments, normalized to the chromosome number. Statistical analysis by two-tailed Mann–Whitney (ns, not significant; **P < 0.01; ****P < 0.0001). g, Schematic of MiDAS experiment in p53ko RPE FAP-TRF1 cells (Top) and representative metaphase spread with Telo PNA (green) and EdU staining (red). Arrows point to telomeric MiDAS. Scale bars, 10 μm. h, Schematics for EdU events at a single chromatid (BIR) and both chromatids (HR). Representative images from DL-treated RPE FAP-TRF1 cells are shown below. i, Telomere MiDAS events at a single chromatid (left) or both chromatids (right). Events are scored for chromatid ends staining positive (Telo+) or negative (Telo–) for telomeric PNA. Error bars represent the mean ± s.d. from 51 (UT) and 61 (DL 10 min) metaphases from two independent experiments. Statistical analysis by one-way ANOVA (ns, not significant; ****P < 0.0001). Source data
Fig. 6
Fig. 6. Replicating cells are more sensitive to telomeric 8oxoG.
a, Schematic shows experiment for EdU labeling of S-phase cells. Representative image of γH2AX (red) and EdU (green) staining of BJ FAP-TRF1 cells after 0 h recovery from 5 min DL. Scale bar, 10 μm. b,c, Number of γH2AX foci per EdU– and EdU+ cells for BJ (b) and RPE (c) FAP-TRF1 cells. Error bars represent the mean ± s.d. from the indicated n number of nuclei analyzed from two independent experiments. Statistical analysis by one-way ANOVA (ns, not significant; ***P < 0.001; ****P < 0.0001). d, Schematic of experiments for telomere DDR detection (top, e,f) and senescence assays (β-gal and proliferation) (bottom, g and Extended Data Fig. 10d) in replicating (cells grown with 10% FBS (+FBS)) and nonreplicating (cells grown with 0.1% FBS (–FBS)) BJ FAP-TRF1 cells. e, Representative IF/FISH images for the telomere DDR experiment. Scale bar, 20 μm. f, Percentage of cells with one to three or four or more DDR+ (γH2AX, 53BP1, or both) telomeres from e. Over 70 nuclei were analyzed per condition per experiment. g, Cells were seeded in medium with 0.1% (–) or 10% (+) FBS, treated the next day with 5 min DL and then recovered 24 h with 0.1 (–) or 10% (+) FBS. All cells were cultured in 10% FBS medium another 4 days before staining for β-gal activity. At least 300 cells were analyzed per condition per experiment. For f,g, error bars represent the mean ± s.d. from the number of independent experiments indicated by the black circles. Statistical significance determined by two-way ANOVA (ns, not significant; *P < 0.05; **P < 0.01; ****P < 0.0001). Source data
Fig. 7
Fig. 7. Model for telomere 8oxoG induced senescence.
Following induction of ROS by endogenous or exogenous stressors, telomeres are susceptible to oxidative DNA damage, including formation of the common lesion 8oxoG. When a replication fork encounters 8oxoG in the telomere, it may stall, resulting in excess ssDNA, leading to replication stress. Replication stress can lead to telomere fragility, localized DDR signaling and MiDAS repair at the telomere. Telomere DDR results in p53 activation, which promotes cellular senescence including multiple characteristic hallmarks. Imagine created with BioRender.com.
Extended Data Fig. 1
Extended Data Fig. 1. Confirmation of telomeric 8oxoG induction in FAP-TRF1 expressing cells.
(a) Representative images of FAP-mCER-TRF1 colocalization with telomeres in BJ (top panel) and RPE (bottom) clones expressing FAP-TRF1 visualized by anti-mCER staining (red) and with telo-FISH (green). Scale bar = 10 μm. (b) Immunoblot for TRF1 in whole cell extracts from hTERT BJ and RPE cells with and without FAP-mCER-TRF1 expression. TRF1 antibody detects both exogenous and endogenous TRF1 while mCER antibody detects exogenous only. (c) Quantification of YFP-XRCC1 signal intensity at telomeric foci as shown in (Fig. 1a) normalized to CFP signal. Box plots represent median and 25th to 75th percentiles, and whiskers represent the 1st to 99th percentiles. Data derived from the indicated n number of foci analyzed. Statistical analysis was by one-way ANOVA (ns = not significant, * p < 0.05, ***p < 0.001). (d) Quantification of number (#) of FAP-mCer-TRF1 foci per cell by direct mCer visualization of untreated cells (UT) or 10 min after dye + light (DL 10’). Error bars represent the mean ± s.d. from the indicated n number of nuclei analyzed. Statistical analysis by two-tailed t-test (p value was not significant). (e) Quantification of percent YFP-XRCC1 positive telomeres per nuclei after 10 min dye + light with pretreatment of 100 µM NaN3 for 15 min prior to light exposure (NaAz) or with no pretreatment (-). Error bars represent the mean ± s.d. from the indicated n number of nuclei analyzed. Statistical analysis by two-tailed t-test (**p < 0.01). (f,g) Detection of 8oxoG in telomeres. Genomic DNA isolated from RPE (f) and BJ (g) FAP-TRF1 cells following no treatment, 5 or 20 min dye + light or 40 mM KBrO3, was treated with FPG glycosylase, and then treated with S1 nuclease (+) or not (-) as indicated. Intact and cleaved telomere restriction fragments were separated by PFGE, and telomeres were detected by Southern blotting. NE = no enzyme treatment for reference from UT cells. (h) The percent of cleaved telomeres was calculated and normalized to UT samples to quantify a fold change in telomere cleavage. For RPE the difference between -S1 and +S1 was used, and normalized to UT cells. Source data
Extended Data Fig. 2
Extended Data Fig. 2. Characterization of damage-induced growth reduction and senescent phenotypes.
(a) Cell counts of an additional RPE FAP-TRF1 clone (#18) obtained 4 days after recovery from indicated treatments. (b) Cell counts of RPE FAP-TRF1 (red) and BJ FAP-TRF1 (blue) cells 4 days after recovery from dye + light treatments relative to untreated. Error bars represent the means ± s.d. from three independent experiments. (c-d) Cell counts of parental BJ-hTERT (c) or RPE-hTERT (d) cells obtained 4 days after recovery from indicated treatments. (e) Cell counts of FAP-TRF1 expressing HeLa and U2OS clones obtained 4 days after recovery from 5 min dye + light treatment relative to untreated. Black circles indicate the number of independent experiments. (f) Representative image of FAP-mCER-TRF1 protein colocalization with telomeres in bulk population primary BJ cells visualized by mCER IF (pink) with telo-FISH (green). (g-h) Cell counts of BJ (g) or RPE (h) FAP-TRF1 cells 4 days after recovery from one hour treatments with 2.5 or 10 mM KBrO3, and for BJ FAP-TRF1 with 50 μM etoposide (ETP). (i) Cell counts of BJ or RPE FAP-TRF1 cells obtained 24 hours after recovery from 5 min dye + light treatment relative to untreated. For panels a, c-d and g-i, error bars represent the mean ± s.d. from the number of independent experiments indicated by the black circles in the bar graphs. Statistical significance determined by one-way ANOVA (ns = not significant, **p < 0.01, ***p < 0.001, ****p < 0.0001). (j) Flow cytometry plots of RPE FAP-TRF1 cells showing gating based on EdU and propidium iodine staining for various cell cycle phases 24 h after no treatment or exposure to dye, light, 5’ dye + light, 20 J/m2 UVC, or one hour treatment with 2.5 or 10 mM KBrO3. (k) Representative images of β-galactosidase positive BJ FAP-TRF1 cells obtained 4 days after recovery from indicated treatments (From Fig. 1h-i). Scale bar = 100 μm. (l) Size of nuclear area (μm2) of BJ (blue) or RPE (red) FAP-TRF1 cells obtained 4 days after recovery from no treatment or 5 min dye + light. Error bars represent the mean ± s.d. from the indicated n number of nuclei analyzed. Statistical analysis by two-tailed t-test (***p < 0.001, ****p < 0.0001). Source data
Extended Data Fig. 3
Extended Data Fig. 3. Characterization of telomeric 8oxoG induced cytoplasmic DNA.
(a) Quantification of the number of MN per 100 nuclei for BJ and RPE FAP-TRF1 cell 4 days after 5 min dye + light, or for BJ after one hour 2.5 mM KBrO3. At least 300 cells scored per experiment. (b) Representative images of RPE FAP-TRF1 cells stained for the indicated markers 4 days after 5 min dye + light treatment (related to Fig. 2b). Scale bar = 10 μm for rows 1, 3-4, and 20 μm for row 2. (c) Quantification of Lamin B1 and Lamin A/C signal intensity normalized to nuclear area from Panel (b). Error bars represent the mean ± s.d. from the indicated n number of nuclei analyzed. Statistical analysis by two-way ANOVA (ns = not significant, ****p < 0.0001). (d) Quantification of LMNB1 mRNA from BJ FAP-TRF1 cells 4 days after 5, 10 or 20 min dye + light, or one hour 2.5 or 10 mM KBrO3, relative to untreated. (e) Quantification of the percent of BJ FAP-TRF1 cells with micronuclei that show overall nuclear γH2AX staining and have a cGAS positive micronucleus 4 days after 5 min dye + light or one hour 2.5 mM KBrO3 treatment. For panels a and d-e, error bars represent the mean ± s.d. from the number of independent experiments indicated by the black circles in the bar graphs. Statistical significance was determined by two-tailed t-test (panel a RPE) or one-way ANOVA (panel a BJ, and d-e). (ns = not significant, *p < 0.05, **p < 0.01, ***p < 0.001, ****p < 0.0001). (f) Representative images of RPE FAP-TRF1 cells 4 days after 5 min dye + light treatment and stained with centromeric and telomeric PNAs by FISH. White boxes zoom in on MN. Scale bar = 10 μm. Source data
Extended Data Fig. 4
Extended Data Fig. 4. Acute telomeric 8oxoG does not increase apoptosis or DNA double strand breaks.
(a) Percent of BJ or RPE FAP-TRF1 cells positive for annexin V (AV), propidium iodide (PI), or both 4 days after indicated treatments. Dye, light or dye + light was for 5 min. KBrO3 exposure was for one hour. Error bars represent the mean ± s.d. from three independent experiments. Statistical analysis was by two-way ANOVA (*p < 0.05, ****p < 0.0001). (b) Representative scatterplots of Annexin V (y-axis) and propidium iodine (x-axis) staining of cells 4 days after the indicated treatments. (c) PFGE of cells in agarose plugs and SybrGreen staining of genomic DNA from BJ and RPE FAP-TRF1 cells untreated (UT) or after 0 or 24 h recovery from 5 min dye + light treatment. Treatments for one hour with 1 or 10 mM H2O2, or 40 mM KBrO3, used as positive controls. Source data
Extended Data Fig. 5
Extended Data Fig. 5. 8oxoG induced DDR signaling and p53 activation.
(a) Immunoblot of phosphorylated RB from BJ FAP-TRF1 cells 4 days after dye, light or DL for 5 min. (b, c) Immunoblots of BJ (b) and RPE (c) FAP-TRF1 cells 3 hours after 5 min DL. Cells were pre- and post-treated with ATMi KU55933 (10 μM) or KU60019 (1 μM) or DMSO. Arrow indicates non-specific band. (d, e) Volcano plots of gene expression changes in RPE (d) and BJ (e) FAP-TRF1 cells 24 hours after dye + light. Each dot is a gene and red dots are significantly up or down-regulated. HeLa cells showed no significant changes. Analyzed with DEseq2. (f, g) Gene expression analysis in RPE (f) and BJ (g) FAP-TRF1 cells 24 hours after dye + light, as a function of chromosome position. Each dot is a 10 kb bin, and the red line = the average. (h) Counts of wild-type and p53ko RPE FAP-TRF1 cells 4 days after indicated treatment. Error bars represent the mean ± s.d. from three independent experiments. (i) Counts of wild-type and p53ko RPE and BJ FAP-TRF1 cells 4 days after treatment with 10 mM (RPE) or 2.5 mM (BJ) KBrO3. (j, k) qPCR analysis of p16 mRNA (CDK2NA) and p21 mRNA (CDK1NA) in BJ FAP-TRF1 cells, 4 days after treatment. For panels i-k, error bars represent the mean ± s.d. from the number of independent experiments indicated by the black circles. Statistical analysis by one-way ANOVA (*p < 0.05, **p < 0.01, ***p < 0.001). (l) Quantification of p53 protein signal intensity by IF in BJ and RPE FAP-TRF1 cells 3 hours after 5 min DL or 20 μM nutlin. (m) 53BP1 foci per cell analyzed by IF from cells as treated in panel (l). p53 signal intensity by IF was used to determine p53 expression (+). For panel l and m, error bars represent the mean ± s.d. from the indicated n number of nuclei analyzed from two independent experiments. Statistical analysis by one-way ANOVA (l) or two-way ANOVA (m) (ns=not significant, ***p < 0.001, ****p < 0.0001). Source data
Extended Data Fig. 6
Extended Data Fig. 6. Telomeric 8oxoG increases p53-dependent p21 expression in non-replicating cells.
(a-c) 23 hours after treatment, wild-type and p53ko RPE FAP-TRF1 (b) and BJ FAP-TRF1 (c) cells were pulsed with EdU for 1 hour, and then analyzed by microscopy for p21 and EdU staining. In each condition, cells were categorized as EdU + or – populations, and the nuclear p21 signal intensity was graphed. Representative IF images are shown in panel a, scale bar = 10 μm. The number n of cells analyzed for each condition from two independent experiments is shown. Tukey box plot shows medians (bar), means (+), 25th to 75th interquartile range (IQR), and whiskers showing 25th or 7th percentile ± 1.5x the IQR. Data analyzed by two-way ANOVA (**p < 0.01, ****p < 0.0001). Source data
Extended Data Fig. 7
Extended Data Fig. 7. Oxidative damage induced telomeric DDR visualized in interphase and metaphase chromosomes.
(a-b) Percent of cells showing 0, 1–3 or ≥ 4 telomeric foci co-localized with γH2AX, 53BP1 or both for BJ (a) and for RPE (b) FAP-TRF1 cells 24 hours after no treatment or 5 min DL. Error bars represent the mean ± s.d. from the number of independent experiments indicated by the black circles, in which more than 50 nuclei were analyzed per condition for each experiment. Statistical analysis was by two-way ANOVA (*p < 0.05, ***p < 0.001). (c) The % of cells with ≥ 4 γH2AX or 53BP1 positive telomeres from each experiment in Fig. 4 is shown, and summed. Data are the means and error bars are ± s.d. from three independent experiments. (d, e) Percent cells exhibiting telomere foci co-localized with γH2AX, 53BP1 or both for BJ (d) and for RPE (e) FAP-TRF1 cells 4 days after 5 min dye + light (DL 5’) or 2.5 mM KBrO3 treatment. Error bars represent the mean ± s.d. from the number of independent experiments indicated by the black circles, in which more than 50 nuclei were analyzed per condition for each experiment. Statistical analysis was by two-way ANOVA (*p < 0.05, **p < 0.01, ****p < 0.0001). (f) Representative image of meta-TIF chromosome spread from RPE FAP-TRF1 cell 24 hours after 5 min dye + light stained for γH2AX (red), telomere PNA (green) and DNA by DAPI (blue). Scale bar = 10 μm. (g) Quantification from meta-TIF assay of γH2AX positive chromatid ends lacking telomere staining (Telo -) or co-localized with telomeric PNA (Telo + ) by telo-FISH as shown in (f). Error bars represent the mean ± s.d. from n = 33 metaphases analyzed per condition. (h) Quantification from the meta-TIF assay of the distribution of γH2AX foci located at chromatid ends (telomere) versus internal (non-telomeric) sites by IF and telo-FISH as shown in panel (f). Source data
Extended Data Fig. 8
Extended Data Fig. 8. Acute telomere 8oxoG damage does not cause telomere shortening or shelterin loss.
(a) Southern blot for telomere restriction fragment length analysis obtained from BJ and RPE FAP-TRF1 after 4 days recovery from no treatment (UT) or 5 min dye alone (D), light alone (L), or dye + light (DL) together. (b) TeSLA obtained from BJ and RPE FAP-TRF1 after 4 days recovery from no treatment (UT) or 5 min dye + light. Each lane is an independent PCR from the same pool of genomic DNA. Averages of telomere length for the shortest 20th percentile and the percent of telomeres shorter than 1.6 kb from two independent experiments are shown below. (c) Quantification of dicentric chromosomes defined as two centromeric foci for p53ko BJ (blue) and RPE (red) FAP-TRF1 cells 24 h after 5 min dye + light. (d) Quantification of telomere foci measured by telo-FISH for BJ (blue) and RPE (red) FAP-TRF1 cells 4 days after 5 min dye + light. For panel c-d, error bars represent the mean ± s.d. from the indicated n number of metaphases (c) or foci (d) analyzed. Statistical analysis by one-way ANOVA, all p-values were non-significant. (e) Quantification of mCER signal intensity per telomere foci from FAP-mCER-TRF1 in wild-type RPE FAP-TRF1 cells after no treatment (UT) or 10 min dye + light (DL 10’). Box plot shows the median and 25th to 75th interquartile range, and whiskers showing 1st to 99th percentiles. Statistical analysis by one-way ANOVA, all p-values were non-significant. (f,g) TRF2 colocalization with telomeres analyzed by IF and telo-FISH immediately after 5 min dye + light. DDR + telomeres were identified by γH2AX co-localization. TRF2 signal intensity was quantified per telomere foci either – or + for γH2AX in BJ (f) and RPE (g) FAP-TRF1 cells. Tukey box plot shows medians (bar), means (+), 25th to 75th interquartile range (IQR), and whiskers showing 25th or 7th percentile ± 1.5x the IQR. Statistical analysis was by Kruskal-Wallis (ns=non-significant, ***p < 0.001, ****p < 0.0001). Source data
Extended Data Fig. 9
Extended Data Fig. 9. Time course of telomeric 8oxoG induced DDR.
(a) Immunoblot of phosphorylated Chk1 (S317) and H2AX (γH2AX) from untreated (UT) BJ FAP-TRF1 and cells treated with 5 min dye + light and recovered for the indicated times. UV = 20 J/m2 UVC. (b) Representative IF image of γH2AX (red) and EdU (green) for total of 24 h recovery (23 h fresh media + 1 h EdU media). Scale bar = 10 μm. (c) (Top) Schematic shows experiment for EdU labeling of S-phase BJ FAP-TRF1 cells after 5 min dye + light and total recovery time. One hour before harvest after recovery time indicated by X h, cells were pulsed with EdU. (Bottom) Total nuclear γH2AX intensity as shown in (b) for EdU+ and EdU- cells for various total recovery time points. Error bars represent the mean ± s.d. from the indicated number n of nuclei examined. Statistical analysis by one-way ANOVA (ns=not significant, *p < 0.05, ****p < 0.0001). (d-f) Number of telomeres per nuclei co-localized with γH2AX, 53BP1 or both (DDR + ) in BJ FAP-TRF1 cells untreated or after 5 min dye + light and 0 h, 3 h, 24 h or 4 days recovery. Error bars represent the mean ± s.d. from the indicated number n of nuclei examined. Statistical analysis by Kruskal-Wallis (ns=not significant, *p < 0.05, ***p < 0.001, ****p < 0.0001). Source data
Extended Data Fig. 10
Extended Data Fig. 10. Suppression of replication and p53 activation in cells cultured in FBS deficient media.
(a) Representative brightfield images of BJ FAP-TRF1 cells grown with the indicated FBS concentration and after the indicated treatment. Scale bar = 100 μm. (b,c) Quantification of EdU-positive cells (b) and Cyclin A nuclear signal (c) in BJ FAP-TRF1 cells 24 hours after the indicated treatments and recovery in 10% FBS ( + ) or 0.1% FBS (-), as in main Fig. 6d upper panel. Error bars represent the mean ± s.d. from number of independent experiments indicated by the black circles. Statistical analysis by one-way ANOVA (**p < 0.01, ****p < 0.0001). In panel (c) significance is shown for -FBS cells relative to +FBS cells. (d) Cells were treated as described in main Fig. 6d lower panel, and counted 4 days after changing all cell culture media to 10% FBS media. Data are cell counts relative to the respective untreated control. Error bars represent the mean ± s.d. from number of independent experiments indicated by the black circles. Statistical analysis by two-tailed t-test (***p < 0.001). (e) Cells were cultured in 10% FBS ( + ) or 0.1% FBS (-) as in main Fig. 6d, upper panel, but harvested for immunoblot 3 h after treatment. KBrO3 (KB, 2.5 mM) and etoposide (50 μM) were 1 h treatments with 3 h recovery. Numbers below p53 and pChk2 blots represent normalized protein expression. Source data

Similar articles

Cited by

References

    1. de Lange T. Shelterin-mediated telomere protection. Annu. Rev. Genet. 2018;52:223–247. doi: 10.1146/annurev-genet-032918-021921. - DOI - PubMed
    1. Hayflick L, Moorhead PS. The serial cultivation of human diploid cell strains. Exp. Cell. Res. 1961;25:585–621. doi: 10.1016/0014-4827(61)90192-6. - DOI - PubMed
    1. Bodnar AG, et al. Extension of life-span by introduction of telomerase into normal human cells. Science. 1998;279:349–352. doi: 10.1126/science.279.5349.349. - DOI - PubMed
    1. Greenberg RA, et al. Short dysfunctional telomeres impair tumorigenesis in the INK4a(delta2/3) cancer-prone mouse. Cell. 1999;97:515–525. doi: 10.1016/S0092-8674(00)80761-8. - DOI - PubMed
    1. Hernandez-Segura A, Nehme J, Demaria M. Hallmarks of cellular senescence. Trends Cell Biol. 2018;28:436–453. doi: 10.1016/j.tcb.2018.02.001. - DOI - PubMed

Publication types