. 2022 Jul;41(30):3804-3820.
doi: 10.1038/s41388-022-02389-5. Epub 2022 Jul 1.

Disassembly of α6β4-mediated hemidesmosomal adhesions promotes tumorigenesis in PTEN-negative prostate cancer by targeting plectin to focal adhesions

Affiliations

Disassembly of α6β4-mediated hemidesmosomal adhesions promotes tumorigenesis in PTEN-negative prostate cancer by targeting plectin to focal adhesions

Tomasz Wenta et al. Oncogene. 2022 Jul.

Abstract

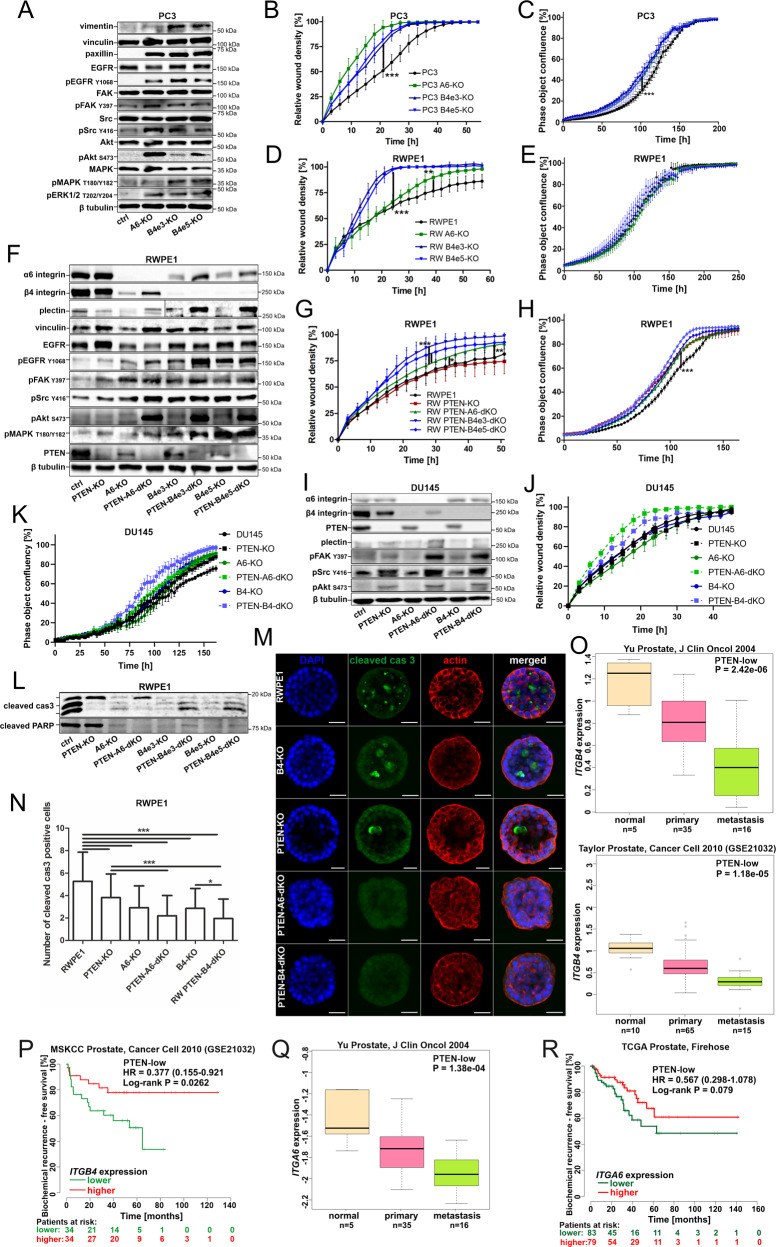
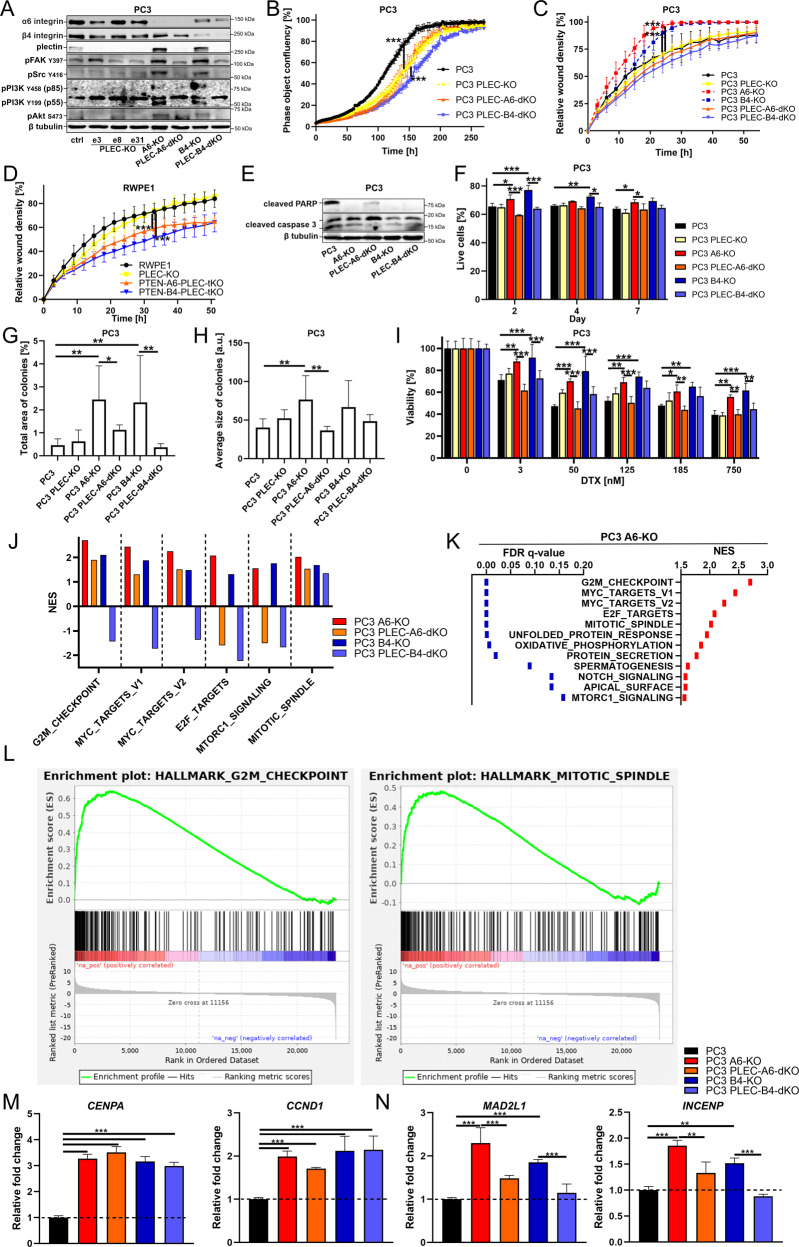
Loss of α6β4-dependent hemidesmosomal adhesions has been observed during prostate cancer progression. However, the significance and underlying mechanisms by which aberrant hemidesmosome assembly may modulate tumorigenesis remain elusive. Using an extensive CRISPR/Cas9-mediated genetic engineering approaches in different prostate cancer cell lines combined with in vivo tumorigenesis studies in mice, bone marrow-on-chip assays and bioinformatics, as well as histological analysis of prostate cancer patient cohorts, we demonstrated that simultaneous loss of PTEN and hemidesmosomal adhesions induced several tumorigenic properties including proliferation, migration, resistance to anoikis, apoptosis, and drug treatment in vitro, and increased metastatic capacity in vivo. These effects were plectin-depended and plectin was associated with actin-rich adhesions upon hemidesmosome disruption in PTEN-negative prostate cancer cells leading to activation of EGFR/PI3K/Akt- and FAK/Src-pathways. These results suggest that analysis of PTEN and hemidesmosomal proteins may have diagnostic value helping to stratify prostate cancer patients with high risk for development of aggressive disease and highlight actin-associated plectin as a potential therapeutic target specifically in PTEN/hemidesmosome dual-negative prostate cancer.


Conflict of interest statement

The authors declare no competing interests.

Figures

Fig. 1
Fig. 1. HD organization is altered in PCa cell lines.
A Protein expression levels of HD-associated α6- and β4-integrins in normal (RWPE1) and PCa (DU145, PC3, LNCap, LNCaP 1F5, VCaP, V16A, 22Rv1) epithelial cells. The data is representative of three independent analyses. B Immunofluorescence analysis of the subcellular localization of integrin α6- (cyan) and β4-subunits (magenta) in normal (RWPE1) and PCa (DU145, PC3) cells. See also Fig. S1A for larger field-of-view images. C Pearson correlation coefficient (PCC) analysis to measure the colocalization of α6-integrin with the indicated HD or FA components. The colocalization data are presented as mean ± SD. At least 20 images from random places were analyzed per each sample for examples see Fig. S3. Asterisks indicate significance (p-value: *<0.05; **<0.01; ***<0.001).
Fig. 2
Fig. 2. Heterodimerization is required for the stabilization of α6- and β4-subunits in benign prostate cells but not in prostate cancer cells.
A Western blot analysis of the expression levels of α6- and β4-integrin subunits in normal (RWPE1) and cancer (PC3) prostate epithelial cells. The data is representative of three independent analyses. B Immunofluorescence analysis of plectin, CD151, β1-integrin, and actin in RWPE1, RWPE1-α6-KO, and RWPE1-β4-KO cells. For a bigger field-of-view and merge with α6- or β4-integrins see Fig. S2. C Plectin expression levels in control and α6- or β4-integrin-depleted RWPE1 and PC3 cells. A representative blot from three independent experiments is shown. D Immunofluorescence analysis of plectin, CD151, β1-integrin, and actin in PC3, PC3-α6-KO, and PC3-β4-KO cells. For a bigger field-of-view and merge with α6- or β4-integrins see Fig. S4. E Immunofluorescence analysis showing merged plectin (green), actin (red), and paxillin (blue) in PC3, PC3-α6-KO, and PC3-β4-KO. For individual channels see Fig. S5A. F Merged intensity histograms of plectin, actin, and paxillin in PC3, PC3-α6-KO, and PC3-β4-KO cells showing partial overlap with these markers. See Fig. S5D for colocalization analysis.
Fig. 3
Fig. 3. Loss of HDs promotes cell migration and stimulates FA-mediated integrin signaling and cell proliferation in PTEN-negative cancer cells.
A Western blot analysis of the indicated proteins was performed in PC3, PC3-α6-KO, and PC3-β4-KO cells. B Wound-closure and C cell proliferation analyses were done for PC3, PC3-α6-KO and PC3-β4-KO cells using IncuCyte S3 as described in materials and methods. D Wound-closure and E cell proliferation analyses were done for RWPE1, RWPE1-α6-KO, and RWPE1-β4-KO cells using IncuCyte S3. F Western blot analysis of the indicated proteins was performed in RWPE1, RWPE1-PTEN-KO, RWPE1-α6-KO, RWPE1-PTEN-α6-dKO, RWPE1-β4-KO, and RWPE1-PTEN-β4-dKO cell lines. G Wound-closure and H proliferation analyses were performed for RWPE1, RWPE1-PTEN-KO, RWPE1-PTEN-α6-dKO, RWPE1-PTEN-β4-dKO cell lines as described above. I Western blot analysis of the indicated proteins was performed in DU145, DU145-PTEN-KO, DU145-α6-KO, DU145-PTEN-α6-dKO, DU145-β4-KO and DU145-PTEN-β4-dKO cell lines. J Wound-closure and K proliferation analysis of the indicated DU145 cell lines was performed using IncuCyte S3. L Western blot analysis of apoptosis markers cleaved caspase-3 and cleaved PARP in the indicated RWPE1 cell lines. M Immunofluorescence analysis of cleaved caspase-3 in the indicated 3D Matrigel-cultured RWPE1 variant cell lines. N Quantitative analysis cleaved caspase-3-positive luminal cells in the 3D cultures. At least 80 cysts were analyzed per each sample. O ITGB4 downregulation is significantly associated with disease progression and P biochemical recurrence in PCa patients with tumors expressing low levels of PTEN. Q ITGA6 downregulation is significantly associated with disease progression in PTEN-low PCa patients. R Correlation of ITGA6 expression levels with a biochemical reoccurrence in PCa patients stratified for low PTEN levels. All the western blot data in this figure are representative of at least three independent experiments. IncuCyte S3 analyses show a representative experiment out of 3 independent repeats all performed with at least 5 replicates per sample. All IncuCyte data are presented as mean ± SD. Asterisks indicate significance (p-value: *<0.05; **<0.01; ***<0.001).
Fig. 4
Fig. 4. Plectin is required for the tumorigenic properties induced by dual loss of HDs and PTEN.
A Western blot analysis of the indicated signaling proteins in PC3, PC3-PLEC-KO, PC3-α6-KO, PC3-PLEC-α6-dKO, PC3-β4-KO, and PC3-PLEC-β4-dKO cell lines. B Cell proliferation and C wound-closure analysis of PC3, PC3-PLEC-KO, PC3-PLEC-α6-dKO, and PC3-PLEC-β4-dKO cells using IncuCyte S3. The data shown is a representative experiment of three independent repeats showing the mean ± SD from a minimum of 4 replicates per sample. D Wound-closure analysis was performed for RWPE1, RWPE1-PLEC-KO, RWPE1-PTEN-α6-PLEC-tKO and RWPE1-PTEN-β4-PLEC-tKO cells as described in C. E Western blot analysis of apoptosis markers cleaved caspase-3 and cleaved PARP in PC3, PC3-α6-KO, PC3-PLEC-α6-dKO, PC3-β4-KO and PC3-PLEC-β4-dKO. F The indicated PC3 cell variants grown for 2, 4 or 7 days on polyHEMA-coated plates were harvested and subjected to analysis of anoikis resistance using the Annexin V/propidium iodide. The data shows the mean ± SD from three independent experiments. The different PC3 cell variants were grown for 21 days in soft agar followed by the determination of G the total area of colonies and H the average size of individual colonies. The data shows the mean ± SD from three independent experiments. I PC3, PC3-PLEC, PC3-α6-dKO, PC3-PLEC-α6-dKO, PC3-β4-KO, and PC3-PLEC-β4-dKO cells were grown for 72 h in the presence of the indicated concentrations of docetaxel followed by the analysis of cell viability using an MTT-assay. The data shows the mean ± SD from three independent experiments. J Comparison of the most enriched pathways in the indicated PC3 cell variants revealed by the RNA-Seq analysis. K The list of top-enriched pathways upregulated in PC3-α6-KO cells when compared with the parental PC3 cells. L Enrichment plots of the 1st- and 5th- ranked pathways in PC3-α6-KO cells. M Quantitative PCR analysis in the different PC3 cell variants to validate upregulation of selected plectin-independent and N plectin-dependent target genes of the G2M checkpoint pathway. The analysis was performed in triplicate and is presented as mean ± SD. All the western blot data in this figure are representative of at least three independent experiments. Asterisks indicate significance (p-value: *<0.05; **<0.01; ***<0.001).
Fig. 5
Fig. 5. Loss of HDs promotes metastasis of PTEN-negative cells in vivo in a plectin-dependent manner.
A One million PC3, PC3-α6-KO or PC3-PLEC-α6-dKO cells expressing luciferase and GFP were injected into the tail-vein of SCID mice. Seven days later bioluminescence was measured using the IVIS in vivo imaging system. B Four weeks post-injection lungs were removed, and metastasis was quantitated with IVIS measurement. C Hematoxylin-eosin histological staining of the lungs of SCID mice with metastases formed by the indicated PC3 cell variants. D Immunofluorescence analysis of a metastatic lung lesion using a human-specific antibody recognizing human phosphokeratin-8. E Quantitation of tdTomato-positive MC3T3 osteoblasts and GFP-positive PC3 or PC3-α6-KO cells in co-cultures grown in bone marrow chips for the indicated time and in the presence or absence of docetaxel (DTX). The data shown represent mean ± SD from three independent chip chambers per sample. F Representative images of untreated and DTX-treated MC3T3 osteoblasts (red) co-cultured with PC3 or G PC3-α6-KO cancer cells (green). For better visualization, osteoblasts were surface-rendered using IMARIS software. See also Supplementary Videos S1–S6.
Fig. 6
Fig. 6. Dual loss of HDs and PTEN transforms nonmalignant RWPE1 cells into tumorigenic cells capable of in vivo metastasis into mouse lungs.
A Hematoxylin-eosin histological staining of lungs of SCID mice injected with RWPE1, RWPE1-β4-KO, RWPE1-PTEN-KO, RWPE1-PTEN-α6-dKO or RWPE1-PTEN-β4-dKO cells. B Immunofluorescence staining of the metastatic foci in lungs using a human-specific antibody for phospho-keratin-8. C FACS-analysis of the circulating GFP-positive RWPE1 cell variants (CSCs) in the blood of SCID mice. The scatter plot shows the number CSCs recovered from each mouse injected with the indicated cell type and the mean of CSC counts per sample type ± SD. D Western blot analysis of the indicated CSCs recovered from the blood of SCID-mice (denoted by ms) compared with the analysis of the respective original populations (denoted by ctrl). The blot is representative of three independent blots with similar results. E IncuCyte-based wound-closure assay of the RWPE1-CSC variants isolated from the SCID mice compared with the respective original cell populations. The data shows mean ± SD of two independent experiments, each performed with 8 replicates. F Quantitative analysis of the invasion of indicated RWPE1-CSC variants (ms) and their corresponding pre-injection counterparts (ctrl). The data shows mean ± SD of two independent experiments done in triplicate. G The different RWPE1-CSC variants (ms) were grown for 7 days in 3D Matrigel followed by staining for actin (red) and nucleus (blue). The size bar indicates 50 µm. Representative images are shown.
Fig. 7
Fig. 7. Upregulation of PLEC expression correlates with tumor aggressiveness in PCa patients with low PTEN expression and PTEN loss/deletion.
A Correlation analysis of PLEC-PTEN mRNA expression levels in PCa patients. B, C Comparison of PLEC expression levels in PCa groups with high or low expression of PTEN. D Higher PLEC levels are associated with shorter overall survival. E PLEC expression levels are upregulated upon disease progression, F higher Gleason score and G elevated PSA levels in PCa patients. H PLEC levels are upregulated during disease progression in stratified PCa patients expressing low levels of PTEN and ITGA6 and I correlate with increased Gleason scores in patients stratified for low levels of PTEN and ITGB4. J Comparison of PLEC expression levels in PCa patients with PTEN loss/deletion and PTEN normal (wt) patient groups. K PLEC is upregulated in metastasis samples and L PLEC upregulation correlates with advanced tumor stage only in PCa patients with PTEN loss. M High PLEC expression levels in PCa patients with PTEN loss and low expression levels of ITGA6 or ITGB4 correlate with advanced tumor stage, N elevated PSA level, O higher Gleason score, P lymph node metastasis, and Q metastasis.
Fig. 8
Fig. 8. Immunohistochemistry analysis of TMA of PCa patient cohort consisting of 232 patients for plectin, α6β4-integrin and PTEN expression.
A Typical staining patterns of plectin, α6β4-integrins and PTEN in morphologically normal glands and prostate carcinoma lesions. Note the intense basal and very weak luminal staining for plectin and α6β4-integrins in normal tissue and depletion of basal cells in cancer lesions and prominent plectin, weak α6-integrin and absent β4-integrin staining in luminal-like cancer cells. B Scoring of plectin, α6-integrin, β4-integrin, and PTEN staining intensities in correlation with tumor stage. The graphs represent matched pairs of normal and cancer lesions from the same patients. Analysis was performed using RM One-way Anova followed by Šídák’s comparison test. The comparison of staining intensity within one group (normal or cancer) was performed using Ordinary One-way Anova followed by Tukey’s comparison test. Asterisks indicate significance (p-value: *<0.05; **<0.01; ***<0.001).

References

    1. Ferlay J, Soerjomataram I, Dikshit R, Eser S, Mathers C, Rebelo M, et al. Cancer incidence and mortality worldwide: sources, methods and major patterns in GLOBOCAN 2012. Int J Cancer. 2015;136:E359–386. - PubMed
    1. Armenia J, Wankowicz SAM, Liu D, Gao J, Kundra R, Reznik E, et al. The long tail of oncogenic drivers in prostate cancer. Nat Genet. 2018;50:645–51. doi: 10.1038/s41588-018-0078-z. - DOI - PMC - PubMed
    1. Baca SC, Prandi D, Lawrence MS, Mosquera JM, Romanel A, Drier Y, et al. Punctuated evolution of prostate cancer genomes. Cell. 2013;153:666–77. doi: 10.1016/j.cell.2013.03.021. - DOI - PMC - PubMed
    1. Fraser M, Sabelnykova VY, Yamaguchi TN, Heisler LE, Livingstone J, Huang V, et al. Genomic hallmarks of localized, non-indolent prostate cancer. Nature. 2017;541:359–64. doi: 10.1038/nature20788. - DOI - PubMed
    1. Whitington T, Gao P, Song W, Ross-Adams H, Lamb AD, Yang Y, et al. Gene regulatory mechanisms underpinning prostate cancer susceptibility. Nat Genet. 2016;48:387–97. doi: 10.1038/ng.3523. - DOI - PubMed

Publication types