

Incomplete recovery of bone strength and trabecular microarchitecture at the distal tibia 1 year after return from long duration spaceflight
- PMID: 35773442
- PMCID: PMC9247070
- DOI: 10.1038/s41598-022-13461-1
Incomplete recovery of bone strength and trabecular microarchitecture at the distal tibia 1 year after return from long duration spaceflight
Abstract
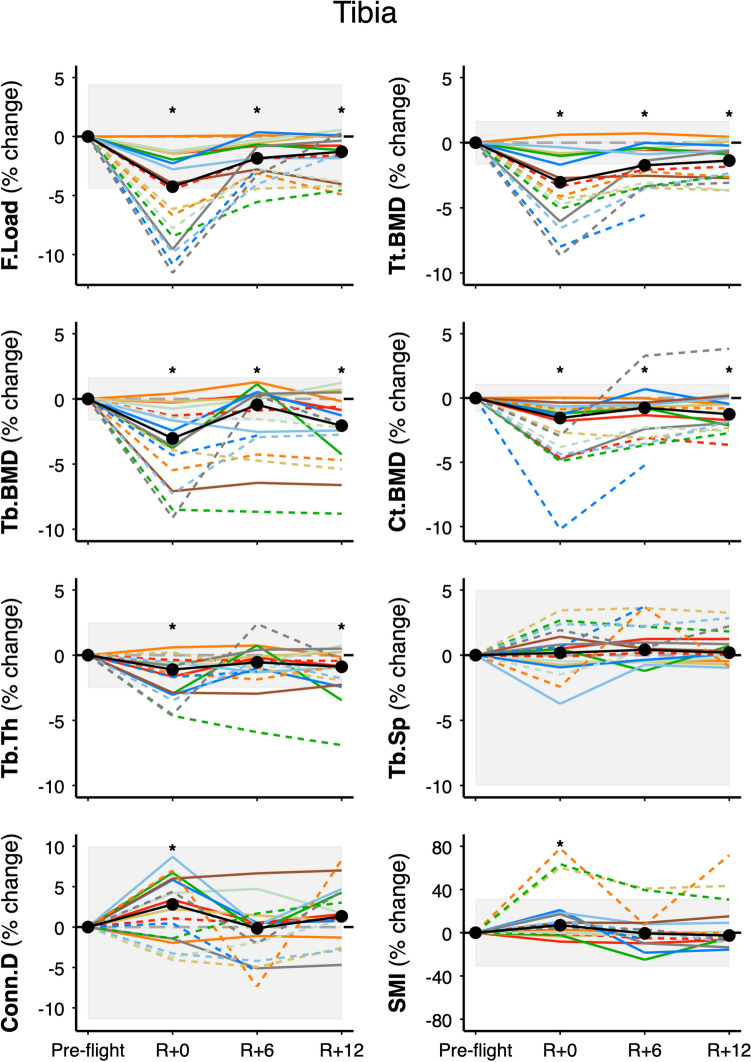
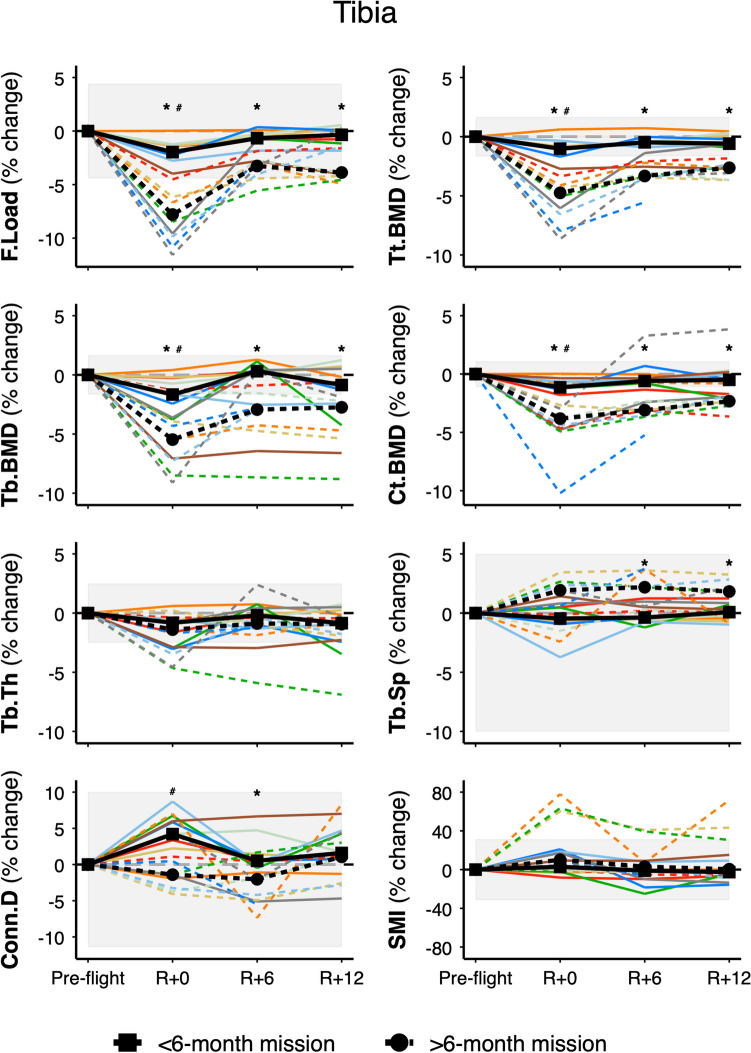
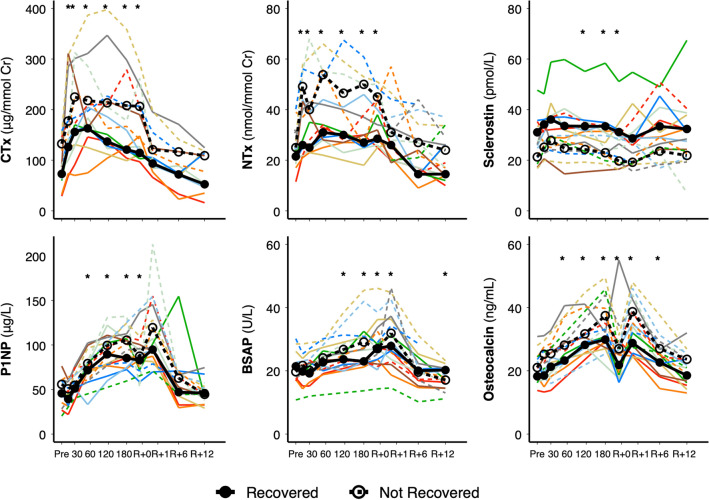
Determining the extent of bone recovery after prolonged spaceflight is important for understanding risks to astronaut long-term skeletal health. We examined bone strength, density, and microarchitecture in seventeen astronauts (14 males; mean 47 years) using high-resolution peripheral quantitative computed tomography (HR-pQCT; 61 μm). We imaged the tibia and radius before spaceflight, at return to Earth, and after 6- and 12-months recovery and assessed biomarkers of bone turnover and exercise. Twelve months after flight, group median tibia bone strength (F.Load), total, cortical, and trabecular bone mineral density (BMD), trabecular bone volume fraction and thickness remained - 0.9% to - 2.1% reduced compared with pre-flight (p ≤ 0.001). Astronauts on longer missions (> 6-months) had poorer bone recovery. For example, F.Load recovered by 12-months post-flight in astronauts on shorter (< 6-months; - 0.4% median deficit) but not longer (- 3.9%) missions. Similar disparities were noted for total, trabecular, and cortical BMD. Altogether, nine of 17 astronauts did not fully recover tibia total BMD after 12-months. Astronauts with incomplete recovery had higher biomarkers of bone turnover compared with astronauts whose bone recovered. Study findings suggest incomplete recovery of bone strength, density, and trabecular microarchitecture at the weight-bearing tibia, commensurate with a decade or more of terrestrial age-related bone loss.
© 2022. The Author(s).
Conflict of interest statement
The authors declare no competing interests.
Figures
Similar articles
-
Pre-flight exercise and bone metabolism predict unloading-induced bone loss due to spaceflight.Br J Sports Med. 2022 Feb;56(4):196-203. doi: 10.1136/bjsports-2020-103602. Epub 2021 Feb 17. Br J Sports Med. 2022. PMID: 33597120 Free PMC article.
-
Cortical and Trabecular Bone Microstructure Did Not Recover at Weight-Bearing Skeletal Sites and Progressively Deteriorated at Non-Weight-Bearing Sites During the Year Following International Space Station Missions.J Bone Miner Res. 2017 Oct;32(10):2010-2021. doi: 10.1002/jbmr.3188. Epub 2017 Jun 28. J Bone Miner Res. 2017. PMID: 28574653
-
Use of Quantitative Computed Tomography to Assess for Clinically-relevant Skeletal Effects of Prolonged Spaceflight on Astronaut Hips.J Clin Densitom. 2020 Apr-Jun;23(2):155-164. doi: 10.1016/j.jocd.2019.08.005. Epub 2019 Aug 26. J Clin Densitom. 2020. PMID: 31558405
-
The Case for Bisphosphonate Use in Astronauts Flying Long-Duration Missions.Cells. 2024 Aug 13;13(16):1337. doi: 10.3390/cells13161337. Cells. 2024. PMID: 39195227 Free PMC article. Review.
-
Impact of Exercise-Induced Strains and Nutrition on Bone Mineral Density in Spaceflight and on the Ground.Aerosp Med Hum Perform. 2023 Dec 1;94(12):923-933. doi: 10.3357/AMHP.6255.2023. Aerosp Med Hum Perform. 2023. PMID: 38176031 Review.
Cited by
-
First private spacewalk a success! What the SpaceX mission means for science.Nature. 2024 Sep;633(8030):504-505. doi: 10.1038/d41586-024-02855-y. Nature. 2024. PMID: 39266737 No abstract available.
-
37-Day microgravity exposure in 16-Week female C57BL/6J mice is associated with bone loss specific to weight-bearing skeletal sites.PLoS One. 2025 Mar 26;20(3):e0317307. doi: 10.1371/journal.pone.0317307. eCollection 2025. PLoS One. 2025. PMID: 40138271 Free PMC article.
-
Protective alleles and precision healthcare in crewed spaceflight.Nat Commun. 2024 Jul 22;15(1):6158. doi: 10.1038/s41467-024-49423-6. Nat Commun. 2024. PMID: 39039045 Free PMC article. Review.
-
Tracking of spaceflight-induced bone remodeling reveals a limited time frame for recovery of resorption sites in humans.Sci Adv. 2024 Dec 20;10(51):eadq3632. doi: 10.1126/sciadv.adq3632. Epub 2024 Dec 20. Sci Adv. 2024. PMID: 39705358 Free PMC article.
-
Physiological Alterations in Relation to Space Flight: The Role of Nutrition.Nutrients. 2022 Nov 19;14(22):4896. doi: 10.3390/nu14224896. Nutrients. 2022. PMID: 36432580 Free PMC article. Review.
References
-
- Vico L, et al. Cortical and trabecular bone microstructure did not recover at weight-bearing skeletal sites and progressively deteriorated at non-weight-bearing sites during the year following international space station missions. J. Bone Miner. Res. 2017;32:2010–2021. doi: 10.1002/jbmr.3188. - DOI - PubMed
Publication types
MeSH terms
Substances
LinkOut - more resources
Full Text Sources
