. 2022 Jun 30;12(1):11025.
doi: 10.1038/s41598-022-15208-4.

Sexual dimorphism in the relationship between brain complexity, volume and general intelligence (g): a cross-cohort study

Affiliations

Sexual dimorphism in the relationship between brain complexity, volume and general intelligence (g): a cross-cohort study

Anca-Larisa Sandu et al. Sci Rep. .

Abstract

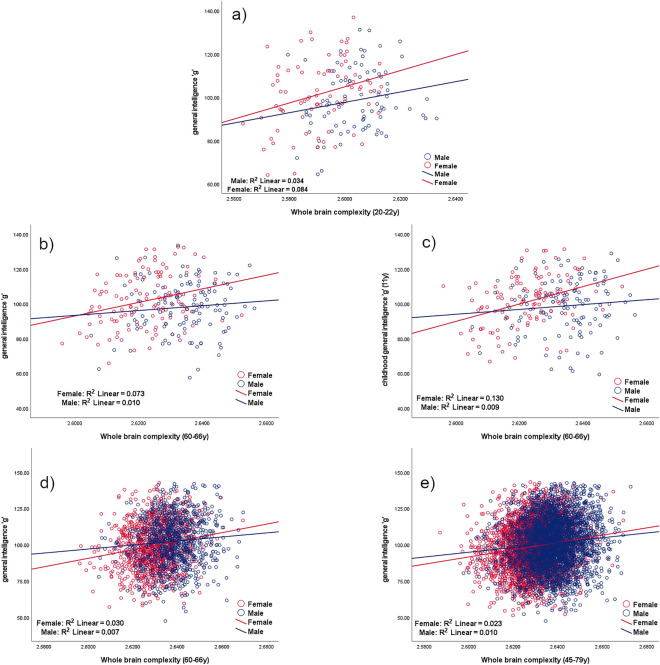
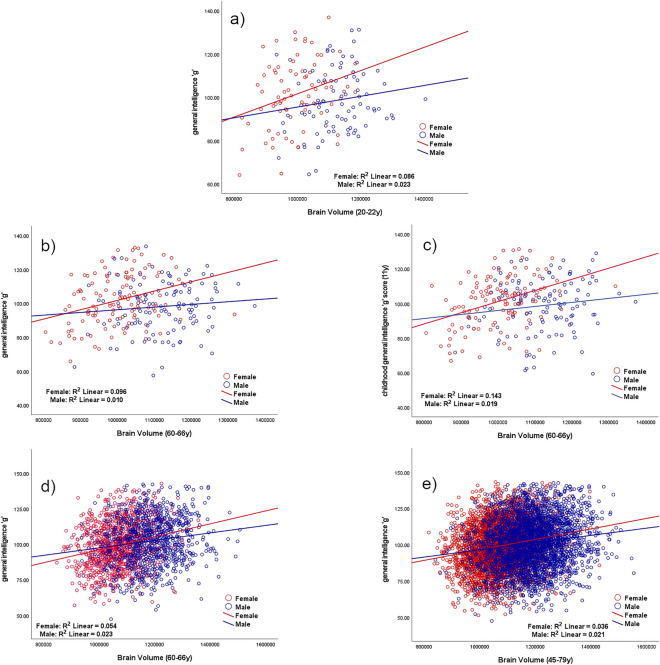
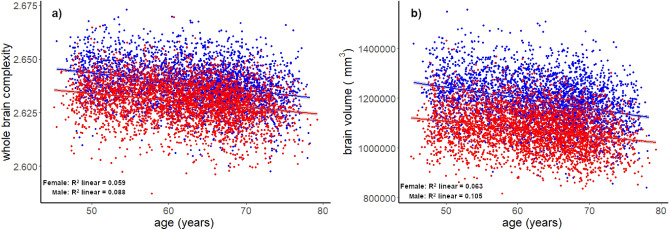
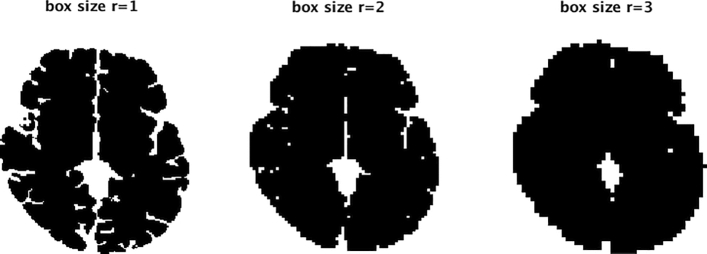
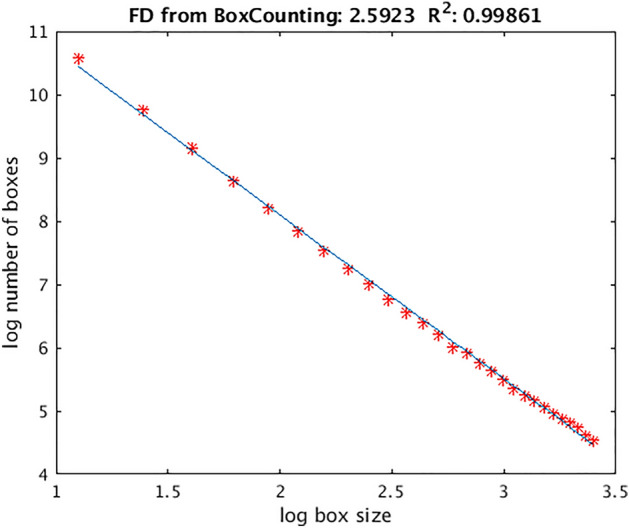
Changes in brain morphology have been reported during development, ageing and in relation to different pathologies. Brain morphology described by the shape complexity of gyri and sulci can be captured and quantified using fractal dimension (FD). This measure of brain structural complexity, as well as brain volume, are associated with intelligence, but less is known about the sexual dimorphism of these relationships. In this paper, sex differences in the relationship between brain structural complexity and general intelligence (g) in two diverse geographic and cultural populations (UK and Indian) are investigated. 3D T1-weighted magnetic resonance imaging (MRI) data and a battery of cognitive tests were acquired from participants belonging to three different cohorts: Mysore Parthenon Cohort (MPC); Aberdeen Children of the 1950s (ACONF) and UK Biobank. We computed MRI derived structural brain complexity and g estimated from a battery of cognitive tests for each group. Brain complexity and volume were both positively corelated with intelligence, with the correlations being significant in women but not always in men. This relationship is seen across populations of differing ages and geographical locations and improves understanding of neurobiological sex-differences.


Conflict of interest statement

AMM has received speakers’ fees from Illumina and Janssen, and research support from the Sackler Trust. These are not connected to the current investigation. Remaining authors report no conflicts of interest.

Figures

Figure 1
Figure 1
Correlations between whole brain complexity and general intelligence g according to sex. (a) Mysore Parthenon Cohort (MPC)—correlation between whole brain complexity and general intelligence g for women (red) and men (blue) at age 20–22. (b,c) ACONF cohort—correlation between whole brain complexity and general intelligence g at age 60–66 (b) and at age 11 (c) for women (red) and men (blue). (d,e) UK Biobank—correlation between whole brain complexity and general intelligence g at age 60–66 (d) and at age 45–79 (e) for women (red) and men (blue).
Figure 2
Figure 2
Correlations between brain volume (mm3) and general intelligence g according to sex. (a) Mysore Parthenon Cohort (MPC)—correlation between brain volume (mm3) and general intelligence g for women (red) and men (blue) at age 20–22. (b,c) ACONF cohort—correlation between brain volume (mm3) and general intelligence g at age 60–66 (b) and at age 11 (c) for women (red) and men (blue). (d,e) UK Biobank—correlation between brain volume (mm3) and general intelligence g at age 60–66 years (d) and at age 45–79 years (e) for women (red) and men (blue).
Figure 3
Figure 3
UK Biobank—correlation between whole brain complexity (a), volume mm3 (b) and age (45–79 y) for women (red) and men (blue).
Figure 4
Figure 4
A two-dimensional illustration of the box-counting method for a trans axial slice, which is covered with boxes of increasing size. The section is extracted after the construction of boxes on three-dimensional brain mask.
Figure 5
Figure 5
Logarithmic plot of the number of boxes containing the brain mask versus box size. The fractal dimension given by the slope is 2.5923, R2 = 0.99861.

Similar articles

Cited by

References

    1. Blanton RE, et al. Mapping cortical asymmetry and complexity patterns in normal children. Psychiatry Res. 2001;107:29–43. doi: 10.1016/S0925-4927(01)00091-9. - DOI - PubMed
    1. Llinares-Benadero C, Borrell V. Deconstructing cortical folding: genetic, cellular and mechanical determinants. Nat. Rev. Neurosci. 2019;20:161–176. doi: 10.1038/s41583-018-0112-2. - DOI - PubMed
    1. Mandelbrot, B. in Fractals: form, change and dimension. (Freeman, W.H. and co, San Francisco, 1977).
    1. Kiselev VG, Hahn KR, Auer DP. Is the brain cortex a fractal? Neuroimage. 2003;20:1765–1774. doi: 10.1016/S1053-8119(03)00380-X. - DOI - PubMed
    1. Di Ieva A. The Fractal Geometry of the Brain. Springer; 2016.

Publication types