. 2022 Jul;19(7):845-853.
doi: 10.1038/s41592-022-01520-4. Epub 2022 Jun 30.

Emu: species-level microbial community profiling of full-length 16S rRNA Oxford Nanopore sequencing data

Affiliations

Emu: species-level microbial community profiling of full-length 16S rRNA Oxford Nanopore sequencing data

Kristen D Curry et al. Nat Methods. 2022 Jul.

Abstract

16S ribosomal RNA-based analysis is the established standard for elucidating the composition of microbial communities. While short-read 16S rRNA analyses are largely confined to genus-level resolution at best, given that only a portion of the gene is sequenced, full-length 16S rRNA gene amplicon sequences have the potential to provide species-level accuracy. However, existing taxonomic identification algorithms are not optimized for the increased read length and error rate often observed in long-read data. Here we present Emu, an approach that uses an expectation-maximization algorithm to generate taxonomic abundance profiles from full-length 16S rRNA reads. Results produced from simulated datasets and mock communities show that Emu is capable of accurate microbial community profiling while obtaining fewer false positives and false negatives than alternative methods. Additionally, we illustrate a real-world application of Emu by comparing clinical sample composition estimates generated by an established whole-genome shotgun sequencing workflow with those returned by full-length 16S rRNA gene sequences processed with Emu.


Conflict of interest statement

Competing Interests Statement

The authors declare no competing interests.

Figures
Extended Data Fig. 1
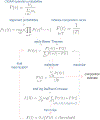
Follow the grey-arrowed path until expectation-maximization (EM) iterations are complete, then pink arrows are followed to the final composition estimate. The method starts by establishing probabilities for each alignment type C=[mismatch (X), insertion (I), deletion (D), softclip (S)] through occurrence counts in the primary alignments. Next, alignment probability P(r|t) is calculated for each read, taxonomy pair (r,t) by assuming the maximum alignment probability between r and t. Meanwhile, an evenly distributed composition vector F is initialized. The EM phase is entered by determining P(t|r), the probability that r emanated from t, for all P(r|t). F is updated accordingly, and the total log likelihood of the estimate is calculated. If the total log likelihood is a significant increase over the previous iteration (>.01), then EM iterations continue. Otherwise, the loop is exited, and F is trimmed to remove all entries less than the set threshold. Now following the pink arrows, one final round of estimation is completed with the trimmed F to produce the final sample composition estimate.
Extended Data Fig. 2
The theoretical values are taken from ZymoBIOMICS standard report of relative abundance estimates based on 16S gene copy numbers (https://files.zymoresearch.com/protocols/_d6305_d6306_zymobiomics_microbial_community_dna_standard.pdf). Truth_ONT and truth_illumina represent the ground truth relative abundances calculated for our ONT and Illumina datasets respectively, as described in the Establishing Ground Truth subsection under Methods.
Extended Data Fig. 3
Heatmap of species-level error between calculated ground truth and estimated relative abundances, where darker blue denotes an underestimate by the software, darker red denotes an overestimate, and white represents no error. All Oxford Nanopore Technologies (ONT) errors are measured in relation to the ground truth of the ONT dataset, while Illumina errors are measured in relation to the ground truth for the Illumina dataset. Color scheme is capped at ±10, resulting in error greater than ±10% observing the maximum error colors. Displayed are the 20 species claiming the largest abundance in any of the ONT or Illumina sample results. “ther” represents the sum of all species not shown in figure for the respective column. Species-level L1-norm, L2-norm, precision, recall, and F-score are also plotted for the methods evaluated.
Extended Data Fig. 4
Heatmap of family-level error between ground truth and estimated relative abundances for both the Emu and RDP incomplete databases (missing 35 of the 345 CAMI2 simulated species) with our CAMI2 dataset. Here, darker blue denotes an underestimate by the software, darker red denotes an overestimate, and white represents no error. Color scheme is capped at ±3, resulting in error greater than ±3% observing the maximum error colors. Displayed are the families of the 35 species that were removed from each of the databases.
Extended Data Fig. 5
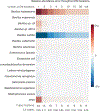
Species with estimated abundance of over 1% in at least one sample with either Emu or Bracken are shown. Data is grouped by condition: healthy control or vaginosis.
Figure 1.
Figure 1.. Pictorial representation of Emu algorithm.
The Emu algorithm begins by generating alignments between input reads (R) and database sequences (S). The probability of each non-matching character alignment type [mismatch (X), insertion (I), deletion (D), softclip (S)] is calculated based on the number of occurrences of each character alignment type within all primary alignments from the read mapping. The probability of each alignment in the read mapping is then generated as P(r|t) from the counts of each character alignment type and their corresponding established probabilities. The expectation-maximation (EM) phase is then entered, where each read is broken down into the likelihood it is derived from each possible species in the database P(t|r) and the overall composition estimate F(t) is deduced. This cycle repeats as the composition estimate influences read-taxonomy probabilities to give more weight to taxa with higher abundances, then the composition estimate is updated accordingly. Once minimal changes are detected between cycle iterations, the EM loop is exited. The composition estimate is then trimmed based on the specified minimum abundance probability threshold to complete one final EM iteration and output a final composition estimate.
Figure 2.
Figure 2.. Performance on simulated ONT reads.
(a) Quantitative result statistics for our MBARC-26 simulated dataset. Heatmap of species-level error between expected and inferred relative abundances, where darker blue denotes an underestimate by the software, darker red denotes an overestimate, and white represents no error. Color scheme is capped at ±10, resulting in error greater than ±10% observing the maximum error colors. Displayed are the 20 species claiming the largest abundance in any of the included results. “Other” represents the sum of all species not shown in figure for the respective column. Species-level L1-norm, L2-norm, precision, recall, and F-score are also plotted for the methods evaluated. (b) The same statistics shown in (a) catered to our CAMI2 simulated dataset.
Figure 3.
Figure 3.. Performance on our ZymoBIOMICS community standard dataset.
Heatmap of species-level error between calculated ground truth and estimated relative abundances, where darker blue denotes an underestimate by the software, darker red denotes an overestimate, and white represents no error. All Oxford Nanopore Technologies (ONT) errors are measured in relation to the ground truth of the ONT dataset, while Illumina errors are measured in relation to the ground truth for the Illumina dataset. Color scheme is capped at ±10, resulting in error greater than ±10% observing the maximum error colors. Displayed are the 20 species claiming the largest abundance in any of the ONT or Illumina results. “Other” represents the sum of all species not shown in figure for the respective column. Species-level L1-norm, L2-norm, precision, recall, and F-score are also plotted for the methods evaluated. True and false positive counts used to calculate precision, recall, and F-score are restricted to species with relative abundance ≥0.01% to align with guidance from ZymoBIOMICS on maximum levels of contamination.
Figure 4.
Figure 4.. Relative error after consecutive expectation-maximization (EM) iterations within Emu on ZymoBIOMICS ONT reads.
Relative error of the Emu algorithm after 1, 2, 3, 4, 5, 10, 15, and 20 EM iterations as well as the final Emu output (out) on our ZymoBIOMICS sample sequenced by an ONT device. The 20 most abundant species in the computational estimate are displayed. X-axis denotes the number of completed EM iterations for the results portrayed in the respective column. “Out” represents the final Emu output, which includes threshold trimming and final re-estimation after 22 EM iterations. Darker blue represents an underestimate by the method, while darker red represents an overestimate. Color scheme is capped at ±5, resulting in error greater than ±5% observing the maximum error color. False positive count and L1-norm are reported for each iteration with the ZymoBIOMICS guaranteed minimum abundance threshold of 0.01% applied.

References

    1. Woese CR & Fox GE Phylogenetic structure of the prokaryotic domain: the primary kingdoms. Proc. Natl. Acad. Sci. 74, 5088–90, DOI: 10.1073/PNAS.74.11.5088 (1977). - DOI - PMC - PubMed
    1. Martínez-Porchas M, Villalpando-Canchola E & Vargas-Albores F Significant loss of sensitivity and specificity in the taxonomic classification occurs when short 16S rRNA gene sequences are used. Heliyon 2, e00170, DOI: 10.1016/j.heliyon.2016.e00170 (2016). - DOI - PMC - PubMed
    1. Callahan BJ, Grinevich D, Thakur S, Balamotis MA & Yehezkel TB Ultra-accurate microbial amplicon sequencing with synthetic long reads. Microbiome 9, 130, DOI: 10.1186/s40168-021-01072-3 (2021). - DOI - PMC - PubMed
    1. Workman RE et al. Nanopore native RNA sequencing of a human poly(A) transcriptome. Nat. Methods 16, 1297–1305, DOI: 10.1038/s41592-019-0617-2 (2019). - DOI - PMC - PubMed
    1. Karst SM et al. High-accuracy long-read amplicon sequences using unique molecular identifiers with Nanopore or PacBio sequencing. Nat. Methods 18, 165–169, DOI: 10.1038/s41592-020-01041-y (2021). - DOI - PubMed

Publication types

Substances