. 2022 Jun 30;23(1):41.
doi: 10.1186/s12868-022-00723-x.

Chronic, acute and protocol-dependent effects of exercise on psycho-physiological health during long-term isolation and confinement

Affiliations

Chronic, acute and protocol-dependent effects of exercise on psycho-physiological health during long-term isolation and confinement

V Abeln et al. BMC Neurosci. .

Abstract

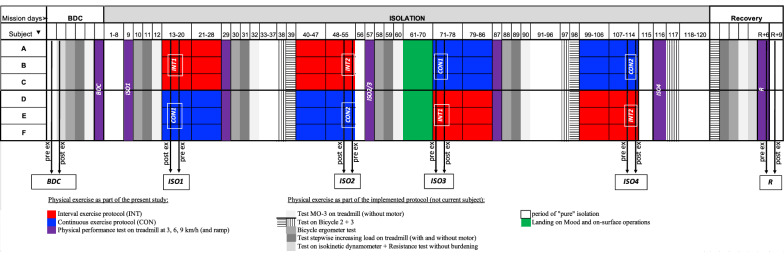
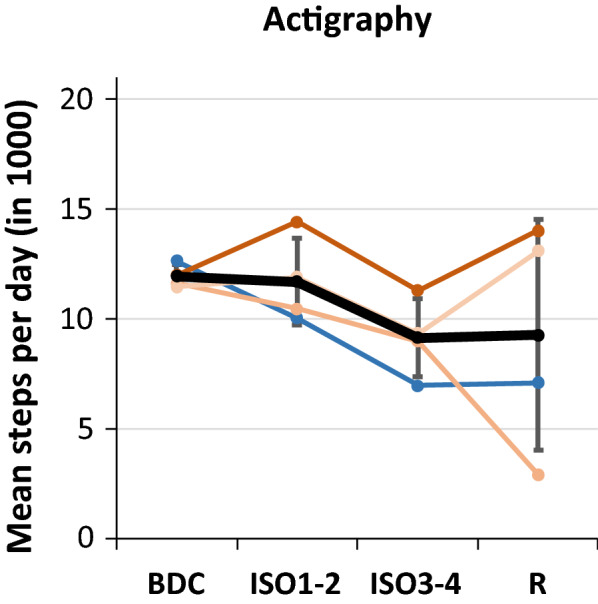
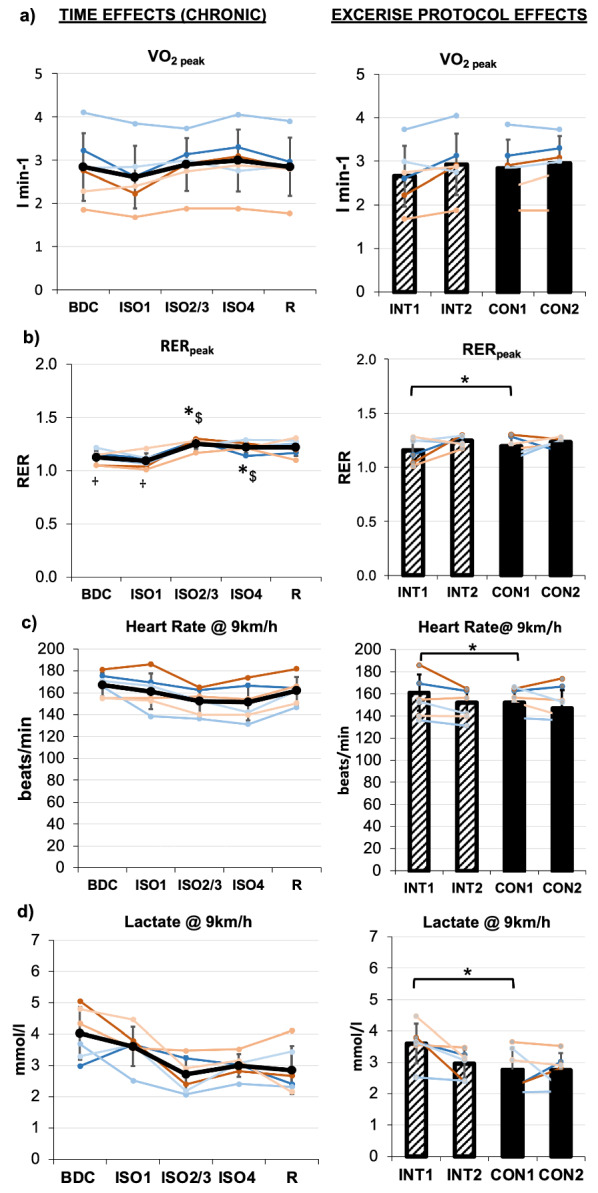
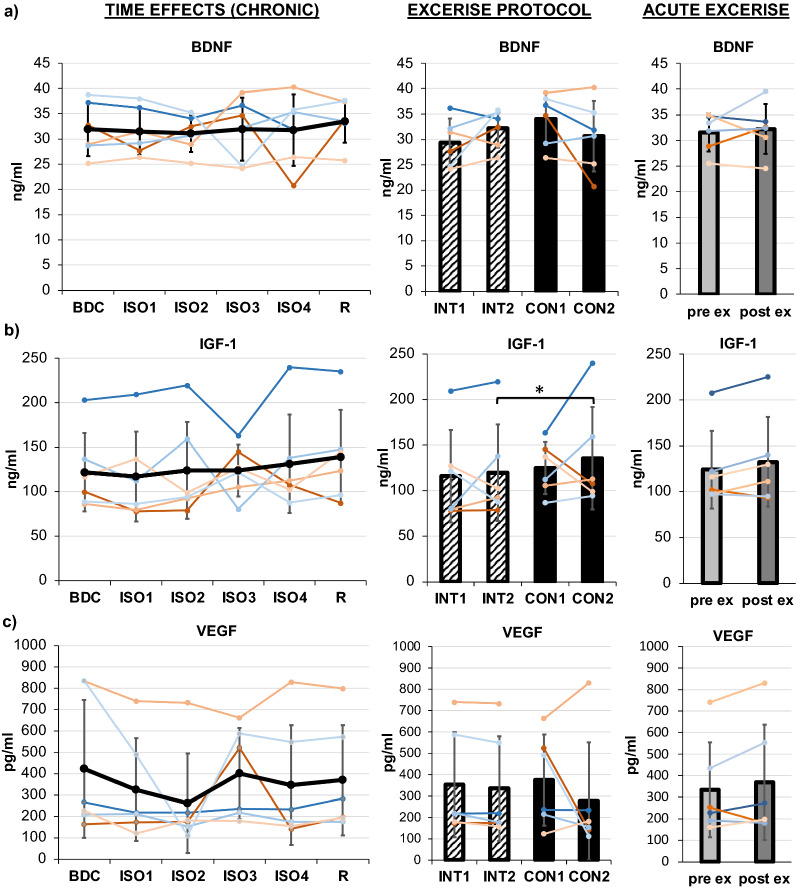
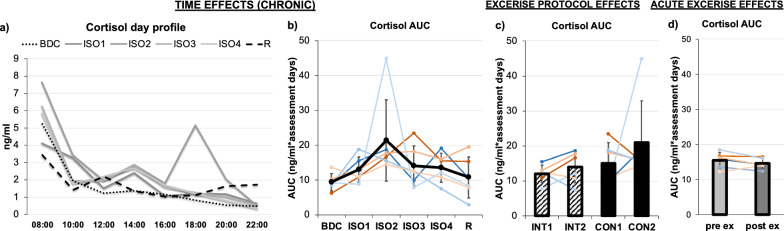
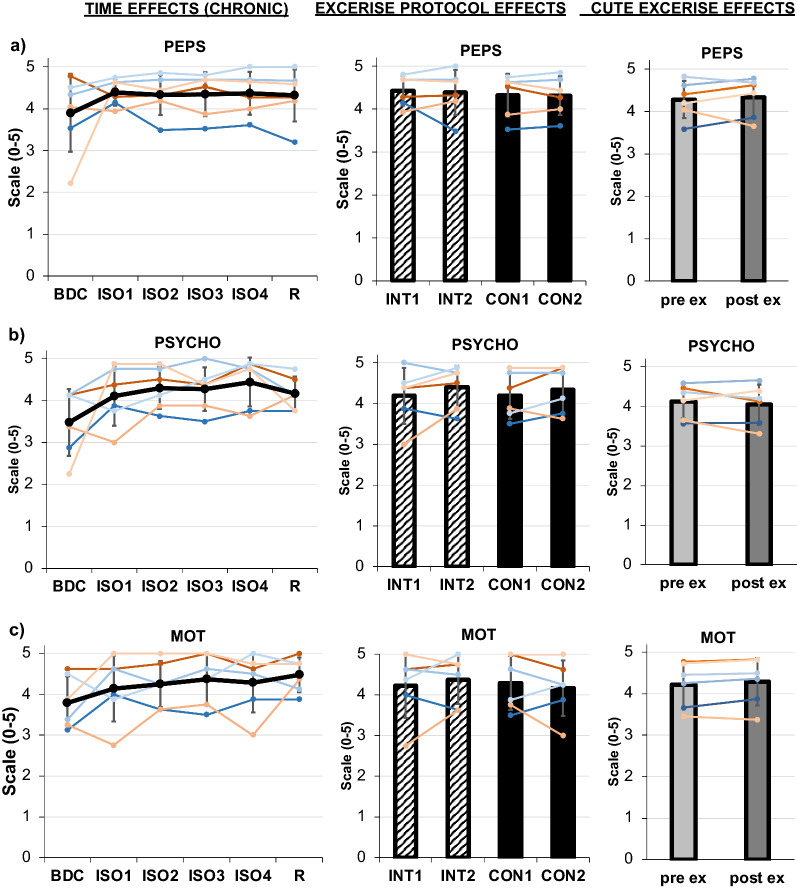
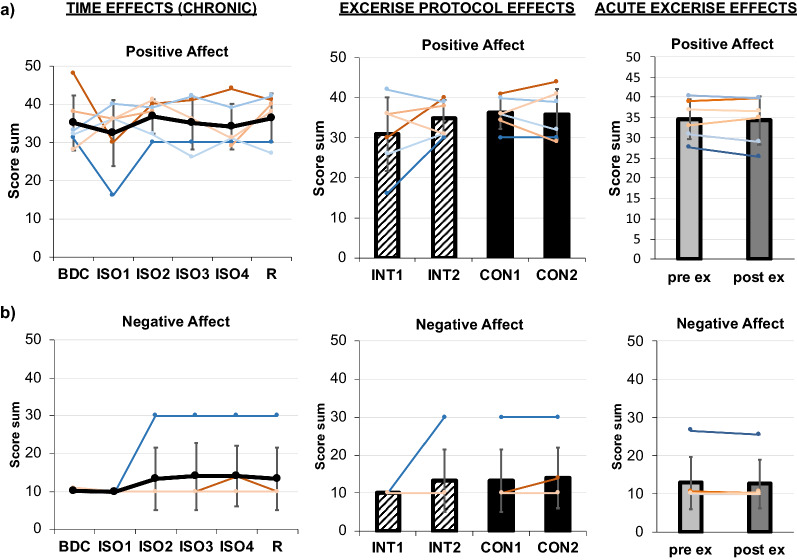
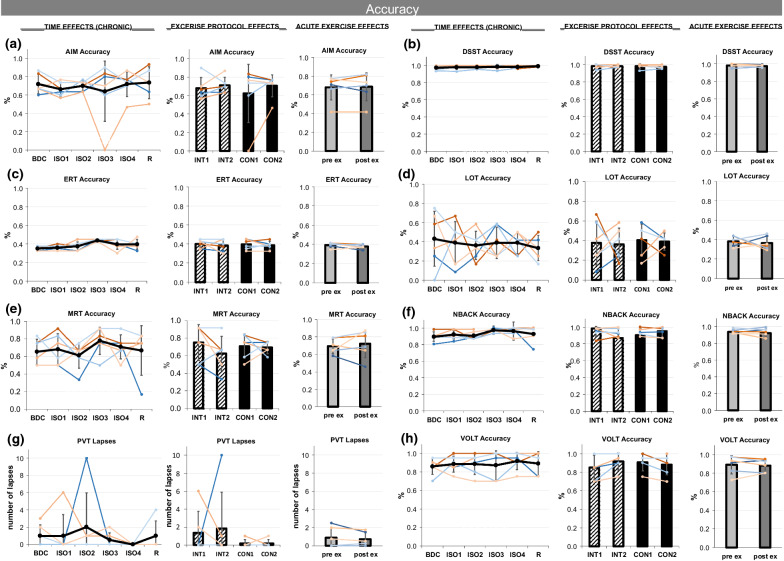
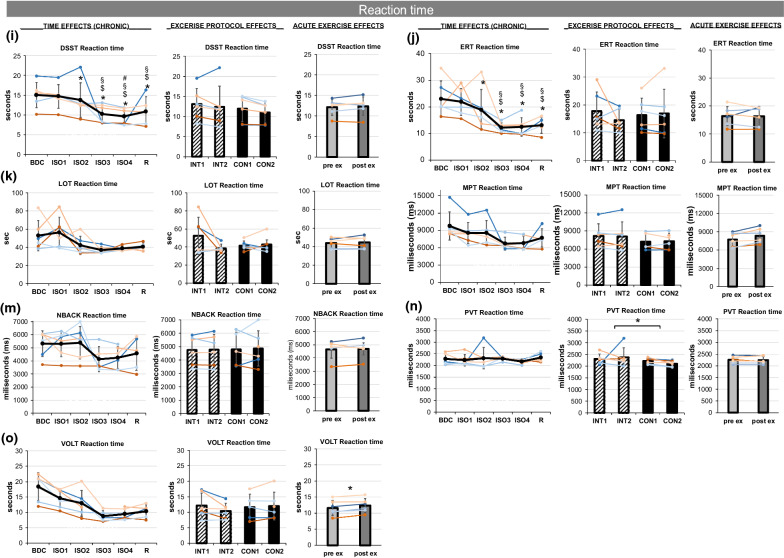
Exercise could prevent physical and psychological deteriorations, especially during pandemic times of lock-down scenarios and social isolation. But to meet both, the common exercise protocols require optimization based on holistic investigations and with respect to underlying processes. This study aimed to explore individual chronic and acute effects of continuous and interval running exercise on physical and cognitive performance, mood, and affect and underlying neurophysiological factors during a terrestrial simulated space mission. Six volunteers (three females) were isolated for 120 days. Accompanying exercise training consisted of a continuous and interval running protocol in a cross-over design. Incremental stage tests on a treadmill were done frequently to test physical performance. Actigraphy was used to monitor physical activity level. Cognitive performance, mood (MoodMeter®), affect (PANAS), brain-derived neurotrophic factor (BDNF), insulin-like growth factor 1 (IGF-1), vascular-endothelial growth factor (VEGF), and saliva cortisol were investigated prior to, four times during, and after isolation, pre- and post-exercise on two separate days, respectively. As a chronic effect, physical performance increased (and IGF-1 tended) in the course of isolation and training until the end of isolation. Subjective mood and affect state, as well as cognitive performance, basal BDNF and VEGF levels, were well-preserved across the intervention. No acute effects of exercise were detected, besides slower reaction time after exercise in two out of nine cognitive tests, testing sensorimotor speed and memory of complex figures. Consistently higher basal IGF-1 concentrations and faster reaction time in the psychomotor vigilance test were found for the continuous compared to the interval running protocol. The results suggest that 120 days of isolation and confinement can be undergone without cognitive and mental deteriorations. Regular, individual aerobic running training supporting physical fitness is hypothesized to play an important role in this regard. Continuous running exercise seems to trigger higher IGF-1 levels and vigilance compared to interval running. Systematic and prolonged investigations and larger sample size are required to follow up on exercise-protocol specific differences in order to optimize the exercise intervention for long-term psycho-physiological health and well-being.

Keywords: Affect; Cognitive performance; Cortisol; Mental Health; Mood; Neurotrophic Factors; Physical Activity.


Conflict of interest statement

The authors declare no competing interests.

Figures

Fig. 1
Fig. 1
Schematic of test design and timeline of physical training. Exercise as subject of the current study is indicated in red (interval exercise, INT) and blue (continuous exercise, CON) or violet (physical performance tests). Other physical exercise tests are indicated in grey or stripped. Black arrows indicate the assessment days (BDC: baseline data collection, ISO1-4: four quarter during isolation, R: recovery period after isolation) either pre- or post-exercise. White areas indicate phases of “pure” isolation without physical tests or training. The green area is showing the period when landing on the Lunar surface and on-surface operations took place
Fig. 2
Fig. 2
Results of actigraphy: Mean steps per day for four individuals (blue male, red females) and mean (black) for periods during baseline data collection (BDC), during the first two (ISO1-2) and last two (ISO3-4) quarters of isolation and during the recovery phase (R). Error bars indicate standard deviation
Fig. 3:
Fig. 3:
a Results of physical performance test regarding peak oxygen uptake (VO2peak), b peak respiratory exchange ratio (RERpeak), c heart rate @ 9 km/h and 3d) lactate @ 9 km/h. Chronic effects over TIME are displayed on the left, exercise PROTOCOL effects on the right, respectively. Means are indicated in black line or bar graphs, female individuals are shown in red shades, male individuals in blue shades. TIME effects are presented for assessments during baseline data collection (BDC), at the beginning of isolation (ISO1), at midterm (ISO2/3), at the end (ISO4) and during the recovery phase (R). For exercise PROTOCOL effects comparing interval (INT, stripped bars) and continuous (CON, full bars) protocols, the mean at the beginning (INT1, CON1) and end (INT2, CON2) of each protocol is displayed. Error bars indicate standard deviation. Significant differences to BDC are indicated by *, to ISO1 by $, and to R by
Fig. 4
Fig. 4
Results of growth factors BDNF (a), IGF-1 (b), and VEGF (c). Chronic effects over TIME are displayed on the left, exercise PROTOCOL effects in the middle, and acuteEXERCISE effect on the right. Means are indicated in black line or bar graphs, female individuals are shown in red shades, male individuals in blue shades. TIME effects are presented for assessments during baseline data collection (BDC), during isolation (ISO1-4), and during the recovery phase (R). For exercise PROTOCOL effects comparing interval (INT, stripped bars) and continuous (CON, full bars) protocols, the mean at the beginning (INT1, CON1) and end (INT2, CON2) of each protocol is displayed. AcuteEXERCISE effects from pre- (light grey) to post-exercise (dark grey) are shown. Error bars indicate standard deviation. Significant differences are indicated by *
Fig. 5
Fig. 5
a Mean cortisol profile analyzed from saliva samples in two-hour intervals from 8:00 AM to 10:00 PM for the assessments over time during BDC (black dotted line), ISO1-4 (grey continuous lines), and R (black dashed line). b Mean area under the curve (AUC) of the cortisol profiles over time (BDC, ISO1-4, R). c For exercise PROTOCOL effects comparing interval (INT, stripped bars) and continuous (CON, full bars) protocols, the mean at the beginning (INT1, CON1) and end (INT2, CON2) of each protocol is displayed. d AcuteEXERCISE effects from pre- (light grey) to post-exercise (dark grey) are shown. Means in (bd) are indicated in black line or bar graphs, female individuals are shown in red shades, male individuals in blue shades. Error bars indicate standard deviation
Fig. 6
Fig. 6
a Results of MoodMeter®: Physical state (PEPS), b psychological strain (PSYCHO), and c motivational state (MOT). Chronic effects over TIME are displayed in the left column, exercise PROTOCOL effects in the middle column, and acuteEXERCISE effect in the right column. Means are indicated in black line or bar graphs, female individuals are shown in red shades, male individuals in blue shades. TIME effects are presented for assessments during baseline data collection (BDC), during isolation (ISO1-4), and during the recovery phase (R). For exercise PROTOCOL effects comparing interval (INT, stripped bars) and continuous (CON, full bars) protocols, the mean at the beginning (INT1, CON1) and end (INT2, CON2) of each protocol is displayed. AcuteEXERCISE effects from pre- (light grey) to post-exercise (dark grey) are shown. Error bars indicate standard deviation
Fig. 7
Fig. 7
Results of the PANAS questionnaire: Positive Affect (a), Negative Affect (b). Chronic effects over TIME are displayed on the left, exercise PROTOCOL effects in the middle, and acuteEXERCISE effect on the right. Means are indicated in black line or bar graphs, female individuals are shown in red shades, male individuals in blue shades. TIME effects are presented for assessments during baseline data collection (BDC), during isolation (ISO1-4), and during recovery phase (R). For exercise PROTOCOL effects comparing interval (INT, stripped bars) and continuous (CON, full bars) protocols, the mean at the beginning (INT1, CON1) and end (INT2, CON2) of each protocol is displayed. AcuteEXERCISE effects from pre- (light grey) to post-exercise (dark grey) are shown. Error bars indicate standard deviation
Fig. 8
Fig. 8
ah Accuracy within the Cognition tests in alphabetical order: a AIM accuracy, b DSST accuracy, c ERT accuracy, d LOT accuracy, e MRT accuracy, f NBACK accuracy, g PVT lapses, h VOLT accuracy. Presented in each figure in columns are chronic effects over TIME, exercise PROTOCOL effects, and acute EXERCISE effects. TIME effects are presented for assessments during baseline data collection (BDC), during isolation (ISO1-4), and during the recovery phase (R). For exercise PROTOCOL effects comparing interval (INT, stripped bars) and continuous (CON, full bars) protocols, the mean at the beginning (INT1, CON1) and end (INT2, CON2) of each protocol is displayed. Acute EXERCISE effects from pre- (light grey) to post-exercise (dark grey) are shown. Means are indicated in black line or bar graphs, female individuals are shown in red shades, male individuals in blue shades. Error bars indicate standard deviation.  8io Reaction times within the Cognition tests in alphabetical order: i DSST reaction time, j ERT reaction time, k LOT reaction time, l MPT reaction time, m NBACK reaction time, n PVT reaction time, o VOLT reaction time. Presented in each figure in columns are chronic effects over TIME, exercise PROTOCOL effects, and acute EXERCISE effects. TIME effects are presented for assessments during baseline data collection (BDC), during isolation (ISO1-4), and during the recovery phase (R). For exercise PROTOCOL effects comparing interval (INT, stripped bars) and continuous (CON, full bars) protocols, the mean at the beginning (INT1, CON1) and end (INT2, CON2) of each protocol is displayed. Acute EXERCISE effects from pre- (light grey) to post-exercise (dark grey) are shown. Means are indicated in black line or bar graphs, female individuals are shown in red shades, male individuals in blue shades. Error bars indicate standard deviation. For TIME effects, significant differences to BDC are indicated by *, to ISO1 by $, to ISO2 by §, and to ISO3 by #. For exercise PROTOCOL and acuteEXERCISE effects, significant differences are marked by *.
Fig. 8
Fig. 8
ah Accuracy within the Cognition tests in alphabetical order: a AIM accuracy, b DSST accuracy, c ERT accuracy, d LOT accuracy, e MRT accuracy, f NBACK accuracy, g PVT lapses, h VOLT accuracy. Presented in each figure in columns are chronic effects over TIME, exercise PROTOCOL effects, and acute EXERCISE effects. TIME effects are presented for assessments during baseline data collection (BDC), during isolation (ISO1-4), and during the recovery phase (R). For exercise PROTOCOL effects comparing interval (INT, stripped bars) and continuous (CON, full bars) protocols, the mean at the beginning (INT1, CON1) and end (INT2, CON2) of each protocol is displayed. Acute EXERCISE effects from pre- (light grey) to post-exercise (dark grey) are shown. Means are indicated in black line or bar graphs, female individuals are shown in red shades, male individuals in blue shades. Error bars indicate standard deviation.  8io Reaction times within the Cognition tests in alphabetical order: i DSST reaction time, j ERT reaction time, k LOT reaction time, l MPT reaction time, m NBACK reaction time, n PVT reaction time, o VOLT reaction time. Presented in each figure in columns are chronic effects over TIME, exercise PROTOCOL effects, and acute EXERCISE effects. TIME effects are presented for assessments during baseline data collection (BDC), during isolation (ISO1-4), and during the recovery phase (R). For exercise PROTOCOL effects comparing interval (INT, stripped bars) and continuous (CON, full bars) protocols, the mean at the beginning (INT1, CON1) and end (INT2, CON2) of each protocol is displayed. Acute EXERCISE effects from pre- (light grey) to post-exercise (dark grey) are shown. Means are indicated in black line or bar graphs, female individuals are shown in red shades, male individuals in blue shades. Error bars indicate standard deviation. For TIME effects, significant differences to BDC are indicated by *, to ISO1 by $, to ISO2 by §, and to ISO3 by #. For exercise PROTOCOL and acuteEXERCISE effects, significant differences are marked by *.

References

    1. De La Torre GG, van Baarsen B, Ferlazzo F, Kanas N, Weiss K, Schneider S, et al. Future perspectives on space psychology: Recommendations on psychosocial and neurobehavioural aspects of human spaceflight. Acta Astronaut. 2012;81(2):587–599. doi: 10.1016/j.actaastro.2012.08.013. - DOI
    1. Affect NK. In: Encyclopedia of Behavioral Medicine. Gellman MD, Turner JR, editors. New York: Springer; 2013. pp. 49–50.
    1. Tugade MM, Fredrickson BL. Resilient individuals use positive emotions to bounce back from negative emotional experiences. J Pers Soc Psychol. 2004;86(2):320–333. doi: 10.1037/0022-3514.86.2.320. - DOI - PMC - PubMed
    1. Sauer J, Hockey GR, Wastell DG. Performance evaluation in analogue space environments: adaptation during an 8-month Antarctic wintering-over expedition. Aviat Space Environ Med. 1999;70(3 Pt 1):230–235. - PubMed
    1. Reed HL, Reedy KR, Palinkas LA, Van Do N, Finney NS, Case HS, et al. Impairment in cognitive and exercise performance during prolonged antarctic residence: effect of thyroxine supplementation in the polar triiodothyronine syndrome. J Clin Endocrinol Metab. 2001;86(1):110–116. - PubMed

Publication types

Substances