. 2022 Jun;27(6):065003.
doi: 10.1117/1.JBO.27.6.065003.

Development and validation of quantitative optical index of skin blood content

Affiliations

Development and validation of quantitative optical index of skin blood content

Yu-Hao Peng et al. J Biomed Opt. 2022 Jun.

Abstract

Significance: We present an approach to estimate with simple instrumentation the amount of red blood cells in the skin microvasculature, designated as parameter LRBC. Variations of parameter LRBC are shown to reflect local changes in the quantity of skin red blood cells during a venous occlusion challenge.

Aim: To validate a simple algebraic model of light transport in skin using the Monte Carlo method and to develop a measure of the red blood cell content in skin microvessels using the Monte Carlo predictions; to guide the development of an instrument to measure experimentally variations of the amount of red blood cells in the skin.

Approach: Monte Carlo simulations were carried out in a multilayer model of the skin to compute remitted light intensities as a function of distance from the illumination locus for different values of the skin blood content. The simulation results were used to compute parameter LRBC and its variations with local skin blood content. An experimental setup was developed to measure parameter LRBC in human volunteers in whom skin blood content of the forearm increased during temporary interruption of the venous outflow.

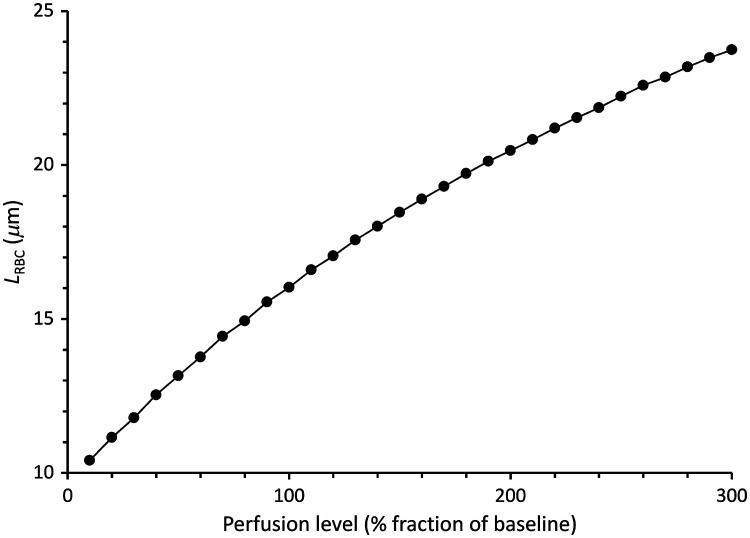
Results: In the simulations, parameter LRBC was ∼16 μm in baseline conditions, and it increased in near proportion with the blood content of the skin layers. Measuring the diffusely reflected light intensity 0.5 to 1.2 mm away from the illumination locus was optimal to detect appreciable changes of the reflected light intensity as skin blood content was altered. Parameter LRBC measured experimentally on the human forearm was 17 ± 2 μm in baseline conditions it increased at a rate of 4 ± 2 μm / min when venous outflow was temporarily interrupted.

Conclusion: Parameter LRBC derived experimentally with a two-wavelength diffuse reflectometer can be used to measure local variations of the amount of red blood cells in skin microvessels.

Keywords: Monte Carlo simulation; quantitative skin blood content; reflectance spectroscopy; tissue optics; venous occlusion.


Figures

Fig. 1
Fig. 1
Experimental setup for measurement of parameter LRBC. Computer-generated sinusoidal current waveforms at 1100 and 1000 Hz modulated the intensity outputs of high-power LEDs emitting at 590 and 780 nm, respectively. DC offset LED currents guaranteed the LEDs never turned off and operated linearly. The LED emissions were forwarded to the skin measurement site on the forearm with a multifiber optical bundle held in secure contact with the skin by means of a plastic holder. Optic fibers in the measurement probe collected the diffusely reflected lights at the two wavelengths which were converted into electrical signals by means of PIN diodes, amplified, and high pass filtered to eliminate the DC components and preserve the sinusoidal components. The LED currents converted into voltage signals were processed in the same manner to produce reference signals at the two frequencies. The four waveforms digitized by means of a DAQ device at a rate of 50  k-samples/s were processed with a lock-in software algorithm to compute parameter LRBC at a rate of 50  samples/s.
Fig. 2
Fig. 2
(a) Differences between the reflected light intensities computed in conditions in which the blood content of the skin layers was decreased (hypoperfusion = 0.1 × baseline) or increased (hyperemia = 2 × baseline and 3 × baseline) minus the reflected light intensities estimated in baseline conditions. Reflected light intensity at each location was computed as the sum of weighted photons emerging from the medium in an annulus 0.1 mm wide starting from 0.15 mm from the locus of entry of the illumination photons divided by the number of illumination photons. Changing the blood content of the skin layers modified the diffusely reflected light intensity more markedly near the point of entry of the illumination photons compared to baseline conditions when the optical properties of the medium corresponded to 590 nm illumination (dashed lines). When the optical properties of the medium corresponded to 780 nm illumination (solid lines), changing the blood content of the skin layers had little effect on the reflected light intensity at all distances from the locus of illumination. (b) Data from Fig. 2(a) expressed as relative intensity difference that is after division by the sum of weighted photon packets emerging in each annulus in baseline conditions. For 590 nm photons, reducing the blood content of the skin layers reduces the absorption events and increases the distances between scattering events such that the relative intensity difference “(hypoperfusion – baseline)/baseline” becomes more positive at longer distances from the locus of illumination. The opposite effect is observed when the blood content is increased such that the relative intensity difference “(hyperemia – baseline)/baseline” becomes more negative when the distance to the locus of illumination increases. Changing the blood content has no appreciable effect on the relative intensity differences at 780 nm.
Fig. 3
Fig. 3
Parameter LRBC expressed as a function of the % fraction of blood content in the skin layers relative to baseline (100%). Parameter LRBC was equal to 16  μm in baseline conditions and decreased or increased to reflect corresponding variations of the blood content in the skin layers from 10% of baseline to 300% of baseline.
Fig. 4
Fig. 4
Sample traces of the diffusely reflected light intensities measured on the forearm in baseline conditions and during a 3-min venous occlusion. A blood pressure cuff placed around the arm was temporarily inflated to the level of the subject’s diastolic blood pressure to interrupt venous outflow. Diffusely reflected 590 nm light intensity decreased immediately from the instant of occlusion and rapidly returned to baseline when the occlusion ended due to the high absorption of 590 nm light by blood hemoglobin which accumulated in the skin vasculature when venous outflow stopped. Much fainter variations of the 780 nm light were concurrently observed.
Fig. 5
Fig. 5
Experimental estimation of differential pathlength factor (RPF) between 780 and 590 nm light measured on the frontal forearm [Eq. (8)]. Data from 15 tests performed on seven subjects are represented. Individual data points (decimated for readability) and best fit line are shown for one test (slope=1.63). Only the best line fit is shown for the other tests with the value of the slope indicated for each trace.
Fig. 6
Fig. 6
Experimentally measured parameter LRBC in baseline conditions and during a venous occlusion challenge in two sample human volunteer tests. Parameter LRBC increased from the instant the blood pressure cuff was manually inflated and returned to its baseline level when the cuff was deflated. In a 4 of 15 tests, an inflection in the trend was noticed giving the appearance of a biphasic rise of LRBC with a rapid jump followed by a more gradual rise.

References

    1. Lima A., Bakker J., “Noninvasive monitoring of peripheral perfusion,” Intensive Care Med. 31(10), 1316–1326 (2005).ICMED910.1007/s00134-005-2790-2 - DOI - PubMed
    1. Tsuchida Y., “The effect of aging and arteriosclerosis on human skin blood flow,” J. Dermatol. Sci. 5(3), 175–181 (1993).JDSCEI10.1016/0923-1811(93)90764-G - DOI - PubMed
    1. Flower R. W., Kling R., “A clinical method for quantification of tissue microvascular blood perfusion in absolute terms [blood-volume / (time tissue-area)],” Microvasc. Res. 114, 92–100 (2017).10.1016/j.mvr.2017.05.009 - DOI - PubMed
    1. Maarek J. M. I., et al. , “Measurement of cardiac output and blood volume during hemodialysis with fluorescent dye dilution technique,” Ann. Biomed. Eng. 45(3), 580–591 (2017).ABMECF10.1007/s10439-016-1711-6 - DOI - PMC - PubMed
    1. Maarek J.-M. I., et al. , “Transcutaneous fluorescence dilution cardiac output and circulating blood volume during hemorrhagic hypovolemia,” Anesthesiology 102(4), 774–782 (2005).ANESAV10.1097/00000542-200504000-00013 - DOI - PubMed

Publication types