

Functional imaging with dynamic quantitative oblique back-illumination microscopy
- PMID: 35773755
- PMCID: PMC9243522
- DOI: 10.1117/1.JBO.27.6.066502
Functional imaging with dynamic quantitative oblique back-illumination microscopy
Abstract
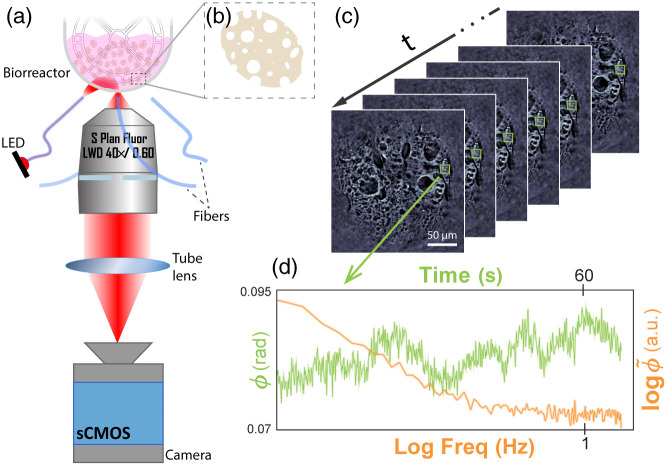
Significance: Quantitative oblique back-illumination microscopy (qOBM) is a recently developed label-free imaging technique that enables 3D quantitative phase imaging of thick scattering samples with epi-illumination. Here, we propose dynamic qOBM to achieve functional imaging based on subcellular dynamics, potentially indicative of metabolic activity. We show the potential utility of this novel technique by imaging adherent mesenchymal stromal cells (MSCs) grown in bioreactors, which can help address important unmet needs in cell manufacturing for therapeutics.
Aim: We aim to develop dynamic qOBM and demonstrate its potential for functional imaging based on cellular and subcellular dynamics.
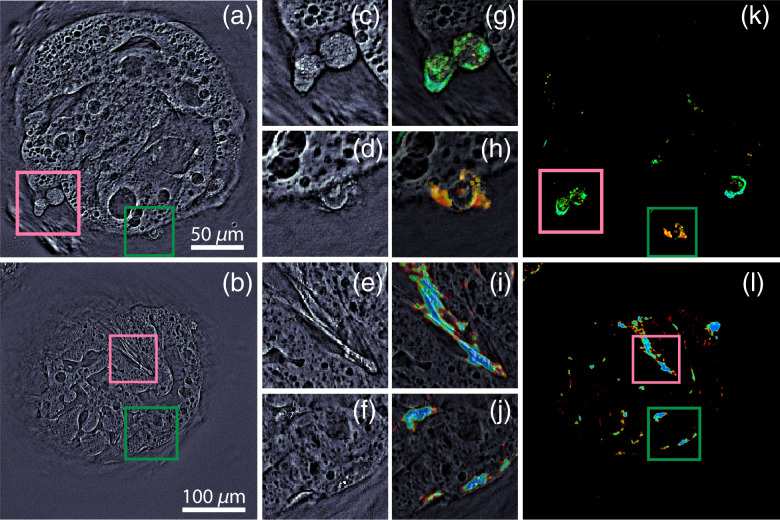
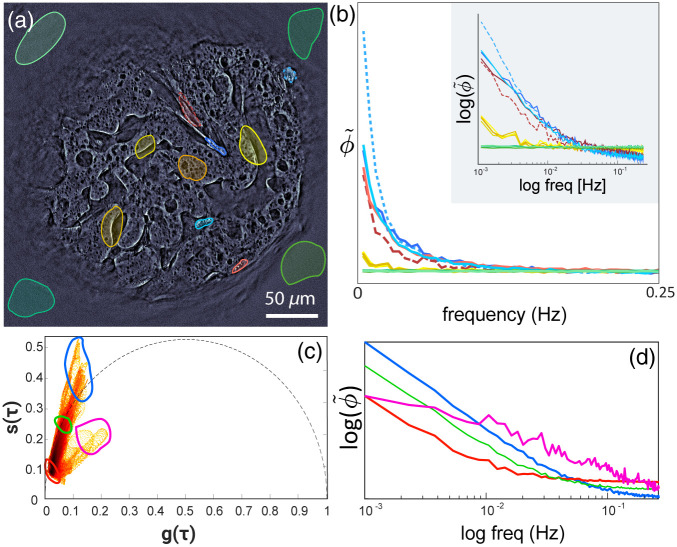
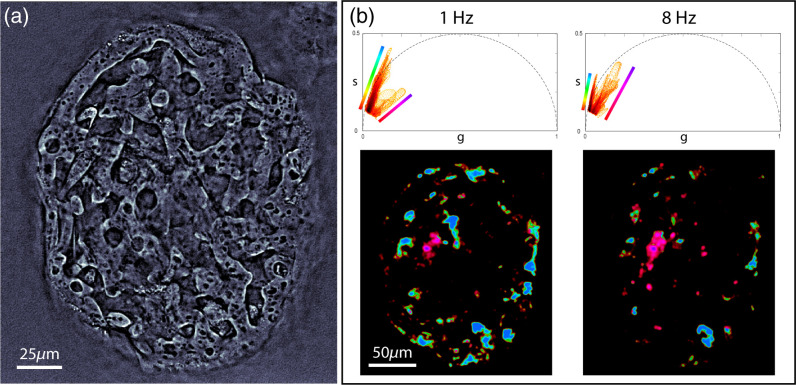
Approach: To obtain functional images with dynamic qOBM, a sample is imaged over a period of time and its temporal signals are analyzed. The dynamic signals display an exponential frequency response that can be analyzed with phasor analysis. Functional images of the dynamic signatures are obtained by mapping the frequency dynamic response to phasor space and color-coding clustered signals.
Results: Functional imaging with dynamic qOBM provides unique information related to subcellular activity. The functional qOBM images of MSCs not only improve conspicuity of cells in complex environments (e.g., porous micro-carriers) but also reveal two distinct cell populations with different dynamic behavior.
Conclusions: In this work we present a label-free, fast, and scalable functional imaging approach to study and intuitively display cellular and subcellular dynamics. We further show the potential utility of this novel technique to help monitor adherent MSCs grown in bioreactors, which can help achieve quality-by-design of cell products, a significant unmet need in the field of cell therapeutics. This approach also has great potential for dynamic studies of other thick samples, such as organoids.
Keywords: dynamic; functional imaging; label-free; microscopy; quantitative phase imaging; stem cells.
Figures
Similar articles
-
Optimization of a flexible fiber-optic probe for epi-mode quantitative phase imaging.Opt Express. 2022 May 23;30(11):17713-17729. doi: 10.1364/OE.454997. Opt Express. 2022. PMID: 36221587 Free PMC article.
-
Towards in-vivo label-free detection of brain tumor margins with epi-illumination tomographic quantitative phase imaging.Biomed Opt Express. 2021 Feb 25;12(3):1621-1634. doi: 10.1364/BOE.416731. eCollection 2021 Mar 1. Biomed Opt Express. 2021. PMID: 33796377 Free PMC article.
-
Label-free quantitative imaging of conjunctival goblet cells.Ocul Surf. 2025 Apr;36:156-163. doi: 10.1016/j.jtos.2025.01.009. Epub 2025 Jan 23. Ocul Surf. 2025. PMID: 39862966
-
Quantitative 3D structured illumination microscopy of nuclear structures.Nat Protoc. 2017 May;12(5):1011-1028. doi: 10.1038/nprot.2017.020. Epub 2017 Apr 13. Nat Protoc. 2017. PMID: 28406495 Review.
-
Potential and limitations of microscopy and Raman spectroscopy for live-cell analysis of 3D cell cultures.J Biotechnol. 2015 Jul 10;205:70-81. doi: 10.1016/j.jbiotec.2015.02.007. Epub 2015 Feb 14. J Biotechnol. 2015. PMID: 25687101 Review.
Cited by
-
Acetic acid enabled nuclear contrast enhancement in epi-mode quantitative phase imaging.J Biomed Opt. 2025 Feb;30(2):026501. doi: 10.1117/1.JBO.30.2.026501. Epub 2025 Feb 4. J Biomed Opt. 2025. PMID: 39906483 Free PMC article.
-
Label-free functional analysis of root-associated microbes with dynamic quantitative oblique back-illumination microscopy.Sci Rep. 2024 Mar 9;14(1):5812. doi: 10.1038/s41598-024-56443-1. Sci Rep. 2024. PMID: 38461279 Free PMC article.
-
Label-Free Functional Analysis of Root-Associated Microbes with Dynamic Quantitative Oblique Back-illumination Microscopy.Res Sq [Preprint]. 2023 Nov 2:rs.3.rs-3517586. doi: 10.21203/rs.3.rs-3517586/v1. Res Sq. 2023. Update in: Sci Rep. 2024 Mar 9;14(1):5812. doi: 10.1038/s41598-024-56443-1. PMID: 37961396 Free PMC article. Updated. Preprint.
-
Non-Invasive Label-free Analysis Pipeline for In Situ Characterization of Differentiation in 3D Brain Organoid Models.Res Sq [Preprint]. 2024 Apr 1:rs.3.rs-4049577. doi: 10.21203/rs.3.rs-4049577/v1. Res Sq. 2024. Update in: Sci Rep. 2024 Sep 27;14(1):22331. doi: 10.1038/s41598-024-72038-2. PMID: 38645145 Free PMC article. Updated. Preprint.
-
Real-time semantic segmentation and anomaly detection of functional images for cell therapy manufacturing.Cytotherapy. 2023 Dec;25(12):1361-1369. doi: 10.1016/j.jcyt.2023.08.011. Epub 2023 Sep 18. Cytotherapy. 2023. PMID: 37725031 Free PMC article.
References
-
- Park Y., Depeursinge C., Popescu G., “Quantitative phase imaging in biomedicine,” Nat. Photon. 12(10), 578–589 (2018).NPAHBY10.1038/s41566-018-0253-x - DOI
