. 2022 Sep 30;41(22):4311-4339.
doi: 10.1002/sim.9511. Epub 2022 Jun 30.

Analysis of stepped wedge cluster randomized trials in the presence of a time-varying treatment effect

Affiliations

Analysis of stepped wedge cluster randomized trials in the presence of a time-varying treatment effect

Avi Kenny et al. Stat Med. .

Abstract

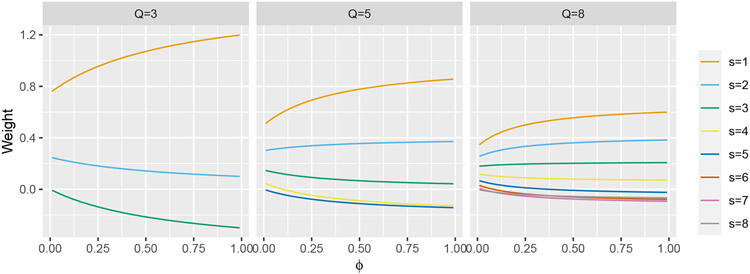
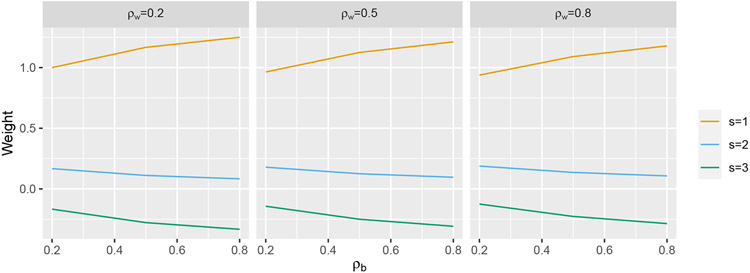
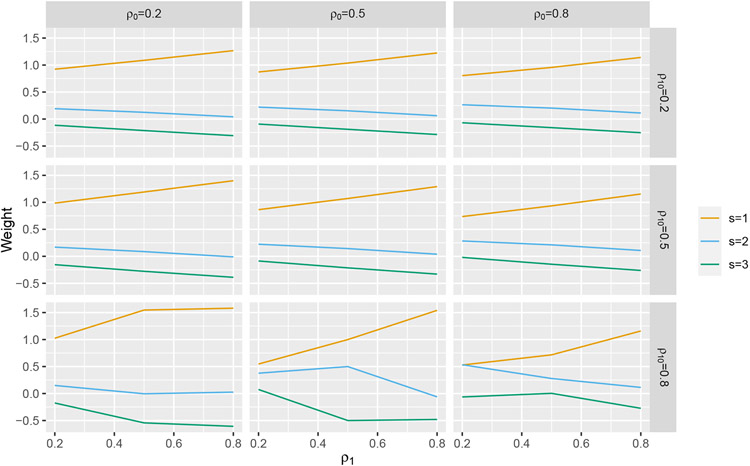
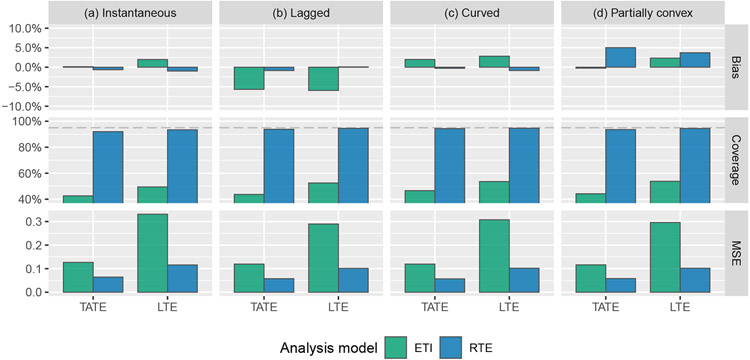
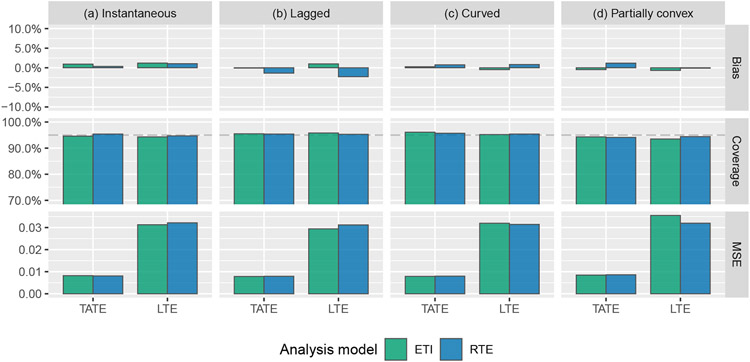
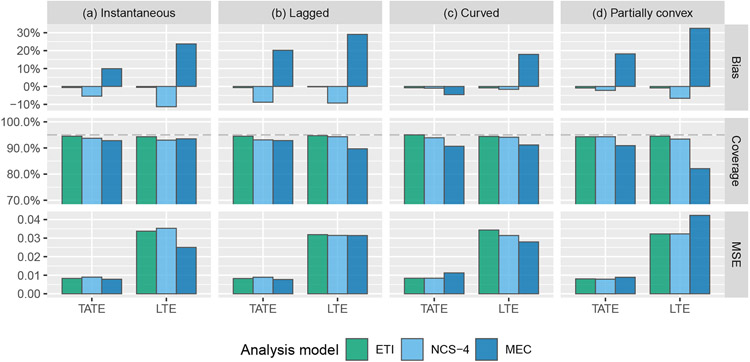
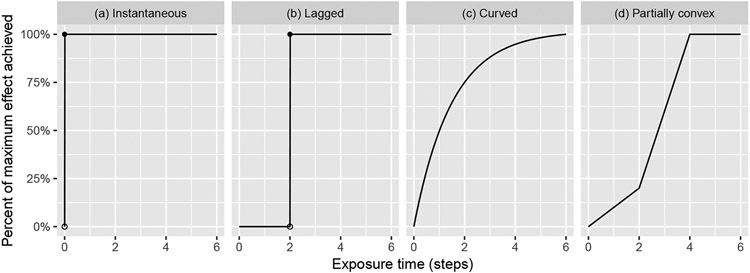
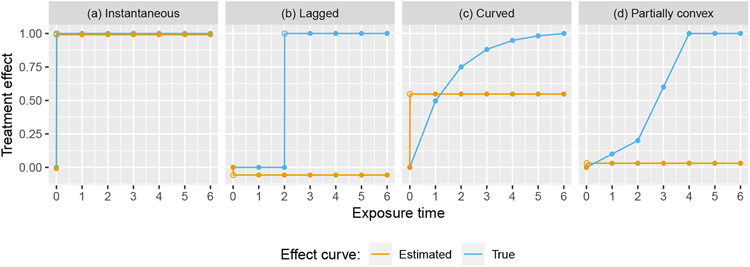
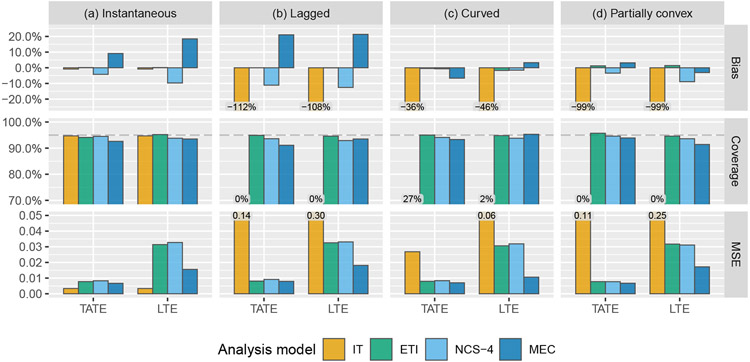
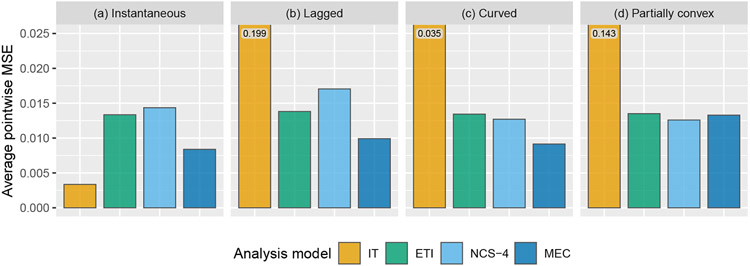
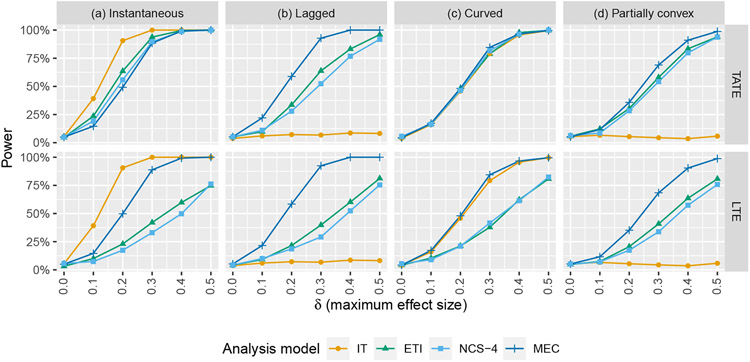
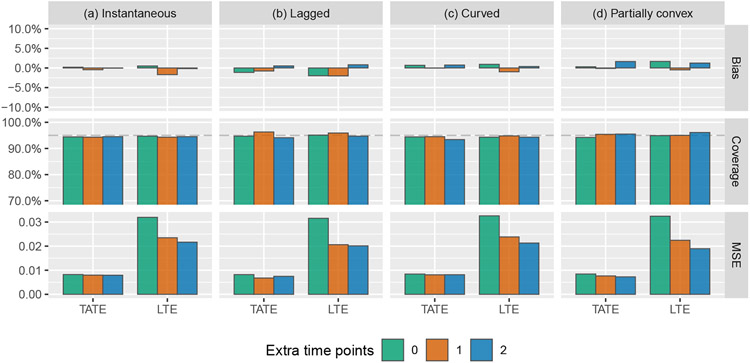
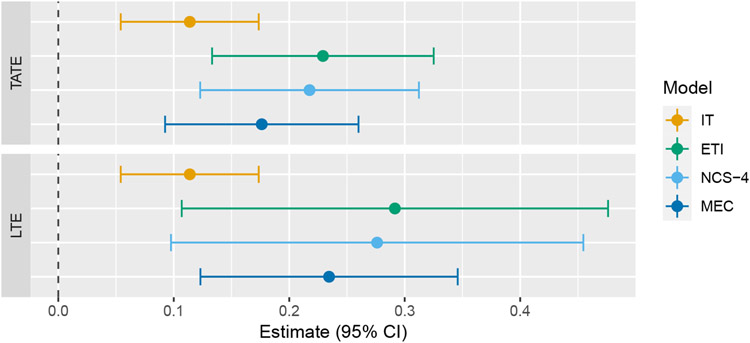
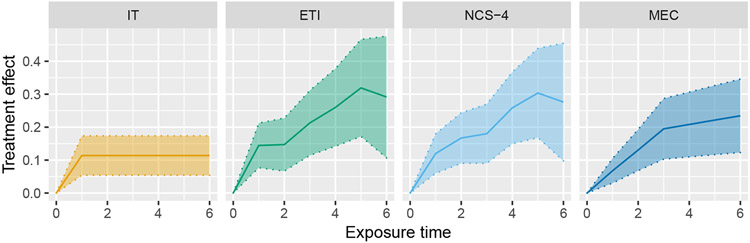
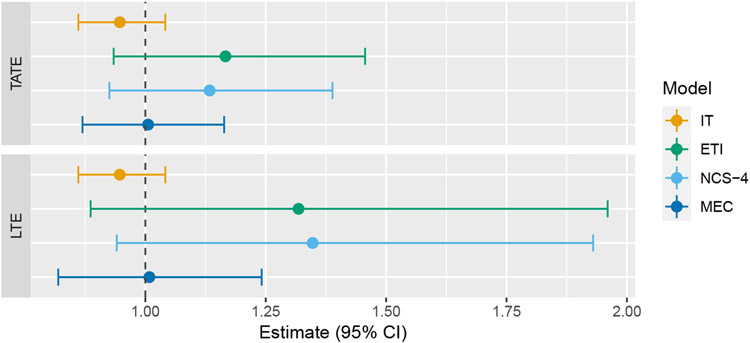
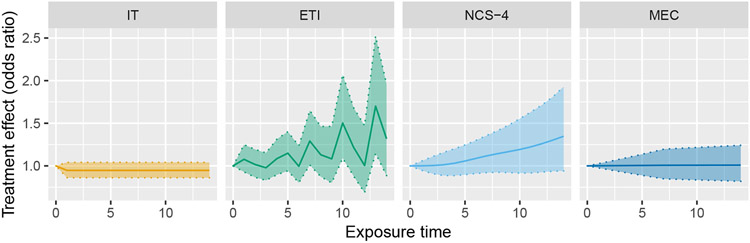
Stepped wedge cluster randomized controlled trials are typically analyzed using models that assume the full effect of the treatment is achieved instantaneously. We provide an analytical framework for scenarios in which the treatment effect varies as a function of exposure time (time since the start of treatment) and define the "effect curve" as the magnitude of the treatment effect on the linear predictor scale as a function of exposure time. The "time-averaged treatment effect" (TATE) and "long-term treatment effect" (LTE) are summaries of this curve. We analytically derive the expectation of the estimator δ ^ $$ \hat{\delta} $$ resulting from a model that assumes an immediate treatment effect and show that it can be expressed as a weighted sum of the time-specific treatment effects corresponding to the observed exposure times. Surprisingly, although the weights sum to one, some of the weights can be negative. This implies that δ ^ $$ \hat{\delta} $$ may be severely misleading and can even converge to a value of the opposite sign of the true TATE or LTE. We describe several models, some of which make assumptions about the shape of the effect curve, that can be used to simultaneously estimate the entire effect curve, the TATE, and the LTE. We evaluate these models in a simulation study to examine the operating characteristics of the resulting estimators and apply them to two real datasets.

Keywords: cluster randomized trial; model misspecification; stepped wedge; time-varying treatment effect.


Conflict of interest statement

Conflict of interest

The authors declare no potential conflict of interests.

Figures

FIGURE A1
FIGURE A1
Weights w(Q, ϕ, s) plotted as a function of ϕ for Q ∈ {3, 5, 8}.
FIGURE A2
FIGURE A2
Weights plotted for select values of ρw and ρb for Q = 3.
FIGURE A3
FIGURE A3
Weights plotted for select values of ρ0, ρ1, and ρ10 for Q = 3.
FIGURE B4
FIGURE B4
Simulation results: bias, coverage, and mean squared error (MSE) for the estimation of the TATE (Ψ(0,J−1]) and LTE (ΨJ−1) when data are generated with random treatment effects, using the exposure time indicator model (ETI) and the exposure time indicator model with a random treatment effect (ETI-RTE)
FIGURE B5
FIGURE B5
Simulation results: bias, coverage, and mean squared error (MSE) for the estimation of the TATE (Ψ(0,J−1]) and LTE (ΨJ−1) when data are generated without random treatment effects, using the exposure time indicator model (ETI) and the exposure time indicator model with a random treatment effect (ETI-RTE)
FIGURE B6
FIGURE B6
Simulation results: bias, coverage, and mean squared error (MSE) for the estimation of the TATE (Ψ(0,J−1]) and LTE (ΨJ−1) using the following four models: exposure time indicator (ETI), natural cubic spline with 4 degrees of freedom (NCS-4), monotone effect curve with a symmetric Dirichlet prior (MEC)
FIGURE 1
FIGURE 1
Several possible effect curves: treatment effect as a function of exposure time
FIGURE 2
FIGURE 2
Four possible true effect curves plotted against the expected effect curves estimated from an IT model, for a design with Q = 6 sequences and ϕ = 0.5
FIGURE 3
FIGURE 3
Simulation results: bias, coverage, and mean squared error (MSE) for the estimation of the TATE (Ψ(0,J−1]) and LTE (ΨJ−1) using the following four models: immediate treatment effect (IT), exposure time indicator (ETI), natural cubic spline with 4 degrees of freedom (NCS-4), monotone effect curve (MEC). Numeric values displayed over graph bars represent the height of the bars that are cut off because of the scale of the axes; see Table E1 for results in tabular form.
FIGURE 4
FIGURE 4
Simulation results: average pointwise mean squared error for the estimation of the entire effect curve using the following four models: immediate treatment effect (IT), exposure time indicator (ETI), natural cubic spline with 4 degrees of freedom (NCS-4), monotone effect curve (MEC). Numeric values displayed over graph bars represent the height of the bars that are cut off because of the scale of the axes; see Table E2 for results in tabular form.
FIGURE 5
FIGURE 5
Simulation results: power of Wald-type hypothesis tests for testing null hypotheses related to the TATE (Ψ(0,J−1] = 0) and the LTE (ΨJ−1 = 0) using the following four models: immediate treatment effect (IT), exposure time indicator (ETI), natural cubic spline with 4 degrees of freedom (NCS-4), monotone effect curve (MEC)
FIGURE 6
FIGURE 6
Simulation results: bias, coverage, and mean squared error (MSE) for the estimation of the TATE (Ψ(0,j−1]) and LTE (Ψj−1) using the exposure time indicator (ETI) model with 0, 1, or 2 extra time points added to the end of the study
FIGURE 7
FIGURE 7
Forest plot of TATE and LTE estimates from the Australia disinvestment trial using the following four models: immediate treatment effect (IT), exposure time indicator (ETI), natural cubic spline with 4 degrees of freedom (NCS-4), monotone effect curve (MEC)
FIGURE 8
FIGURE 8
Estimation of the effect curve from the Australia disinvestment trial using the following four models: immediate treatment effect (IT), exposure time indicator (ETI), natural cubic spline with 4 degrees of freedom (NCS-4), monotone effect curve (MEC)
FIGURE 9
FIGURE 9
Forest plot of TATE and LTE estimates from the WA State EPT Trial (odds ratios) using the following four models: immediate treatment effect (IT), exposure time indicator (ETI), natural cubic spline with 4 degrees of freedom (NCS-4), monotone effect curve (MEC)
FIGURE 10
FIGURE 10
Estimation of the effect curve from the WA State EPT Trial using the following four models: immediate treatment effect (IT), exposure time indicator (ETI), natural cubic spline with 4 degrees of freedom (NCS-4), monotone effect curve (MEC)

Similar articles

Cited by

References

    1. Hughes JP, Granston TS, Heagerty PJ. Current issues in the design and analysis of stepped wedge trials. Contemporary clinical trials 2015; 45: 55–60. - PMC - PubMed
    1. Mdege ND, Man MS, Taylor CA, Torgerson DJ. Systematic review of stepped wedge cluster randomized trials shows that design is particularly used to evaluate interventions during routine implementation. Journal of clinical epidemiology 2011; 64(9): 936–948. - PubMed
    1. Kotz D, Spigt M, Arts IC, Crutzen R, Viechtbauer W. Use of the stepped wedge design cannot be recommended: a critical appraisal and comparison with the classic cluster randomized controlled trial design. Journal of clinical epidemiology 2012; 65(12): 1249–1252. - PubMed
    1. Mdege ND, Man MS, Taylor CA, Torgerson DJ. There are some circumstances where the stepped-wedge cluster randomized trial is preferable to the alternative: no randomized trial at all. Response to the commentary by Kotz and colleagues. Journal of clinical epidemiology 2012; 65(12): 1253. - PubMed
    1. Kotz D, Spigt M, Arts IC, Crutzen R, Viechtbauer W. Researchers should convince policy makers to perform a classic cluster randomized controlled trial instead of a stepped wedge design when an intervention is rolled out. Journal of clinical epidemiology 2012; 65(12): 1255. - PubMed

Publication types

LinkOut - more resources