

Improving foveal avascular zone segmentation in fluorescein angiograms by leveraging manual vessel labels from public color fundus pictures
- PMID: 35774310
- PMCID: PMC9203117
- DOI: 10.1364/BOE.452873
Improving foveal avascular zone segmentation in fluorescein angiograms by leveraging manual vessel labels from public color fundus pictures
Abstract
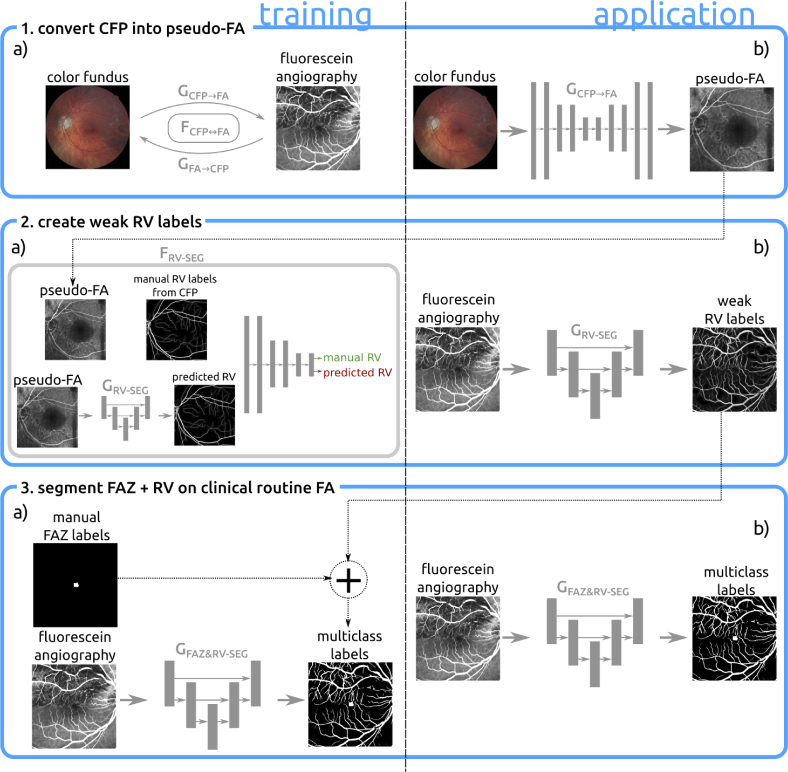
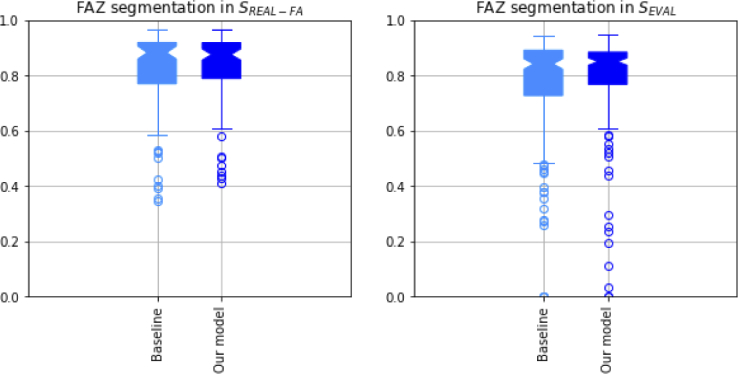
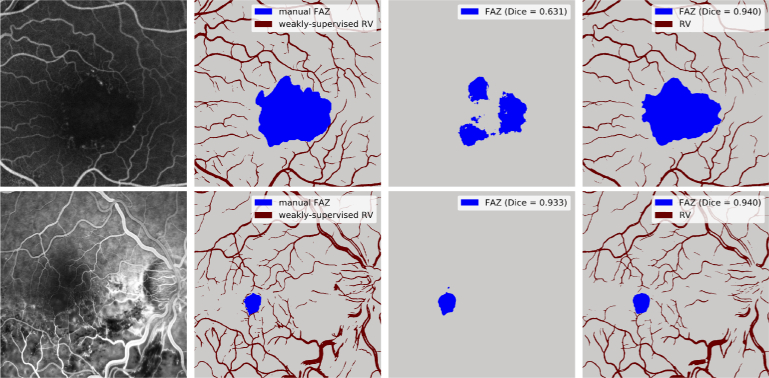
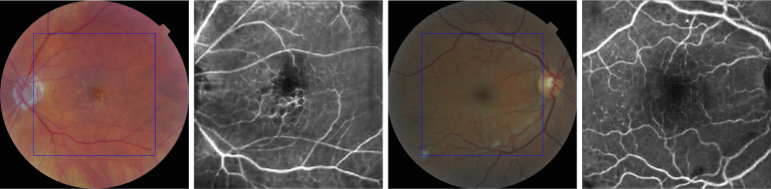
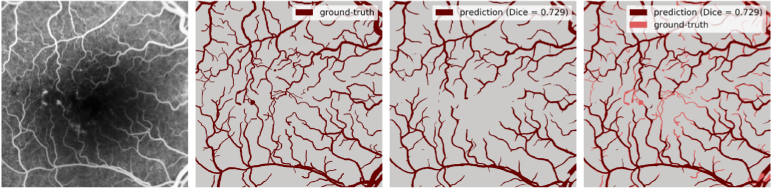
In clinical routine, ophthalmologists frequently analyze the shape and size of the foveal avascular zone (FAZ) to detect and monitor retinal diseases. In order to extract those parameters, the contours of the FAZ need to be segmented, which is normally achieved by analyzing the retinal vasculature (RV) around the macula in fluorescein angiograms (FA). Computer-aided segmentation methods based on deep learning (DL) can automate this task. However, current approaches for segmenting the FAZ are often tailored to a specific dataset or require manual initialization. Furthermore, they do not take the variability and challenges of clinical FA into account, which are often of low quality and difficult to analyze. In this paper we propose a DL-based framework to automatically segment the FAZ in challenging FA scans from clinical routine. Our approach mimics the workflow of retinal experts by using additional RV labels as a guidance during training. Hence, our model is able to produce RV segmentations simultaneously. We minimize the annotation work by using a multi-modal approach that leverages already available public datasets of color fundus pictures (CFPs) and their respective manual RV labels. Our experimental evaluation on two datasets with FA from 1) clinical routine and 2) large multicenter clinical trials shows that the addition of weak RV labels as a guidance during training improves the FAZ segmentation significantly with respect to using only manual FAZ annotations.
© 2022 Optica Publishing Group under the terms of the Optica Open Access Publishing Agreement.
Conflict of interest statement
DH, PS, JIO and FG declare no conflicts of interest. BSG: Roche (C), Bayer (C), Novartis (C), Digital Diagnostics (F). US-E: Genentech (C), Novartis (C), Roche (C), Heidelberg Engineering (C), Kodiak (C), RetInSight (C).
Figures
Similar articles
-
Foveal avascular zone segmentation using deep learning-driven image-level optimization and fundus photographs.Proc IEEE Int Symp Biomed Imaging. 2023 Apr;2023:10.1109/isbi53787.2023.10230410. doi: 10.1109/isbi53787.2023.10230410. Epub 2023 Sep 1. Proc IEEE Int Symp Biomed Imaging. 2023. PMID: 37706193 Free PMC article.
-
RPS-Net: An effective retinal image projection segmentation network for retinal vessels and foveal avascular zone based on OCTA data.Med Phys. 2022 Jun;49(6):3830-3844. doi: 10.1002/mp.15608. Epub 2022 Mar 30. Med Phys. 2022. PMID: 35297061
-
Foveal avascular zone segmentation in optical coherence tomography angiography images using a deep learning approach.Sci Rep. 2021 Jan 13;11(1):1031. doi: 10.1038/s41598-020-80058-x. Sci Rep. 2021. PMID: 33441825 Free PMC article.
-
The association between the foveal avascular zone and retinal thickness.Invest Ophthalmol Vis Sci. 2014 Sep 30;55(10):6870-7. doi: 10.1167/iovs.14-15446. Invest Ophthalmol Vis Sci. 2014. PMID: 25270194 Free PMC article.
-
[Foveal avascular zone and OCT angiography. An overview of current knowledge].Ophthalmologe. 2019 Jul;116(7):610-616. doi: 10.1007/s00347-018-0838-2. Ophthalmologe. 2019. PMID: 30569234 Review. German.
References
LinkOut - more resources
Full Text Sources