. 2022 Jun 16:9:101760.
doi: 10.1016/j.mex.2022.101760. eCollection 2022.

Modularisation of published and novel models toward a complex KIR2DL4 pathway in pbNK cell

Affiliations

Modularisation of published and novel models toward a complex KIR2DL4 pathway in pbNK cell

Nurul Izza Ismail et al. MethodsX. .

Abstract

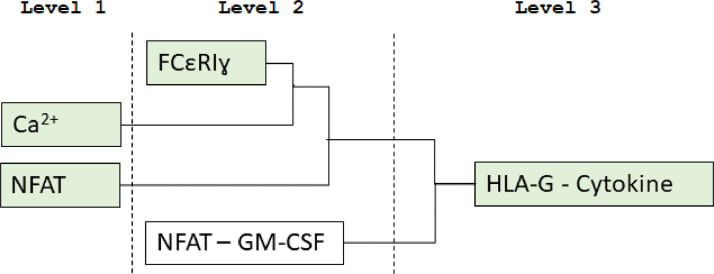
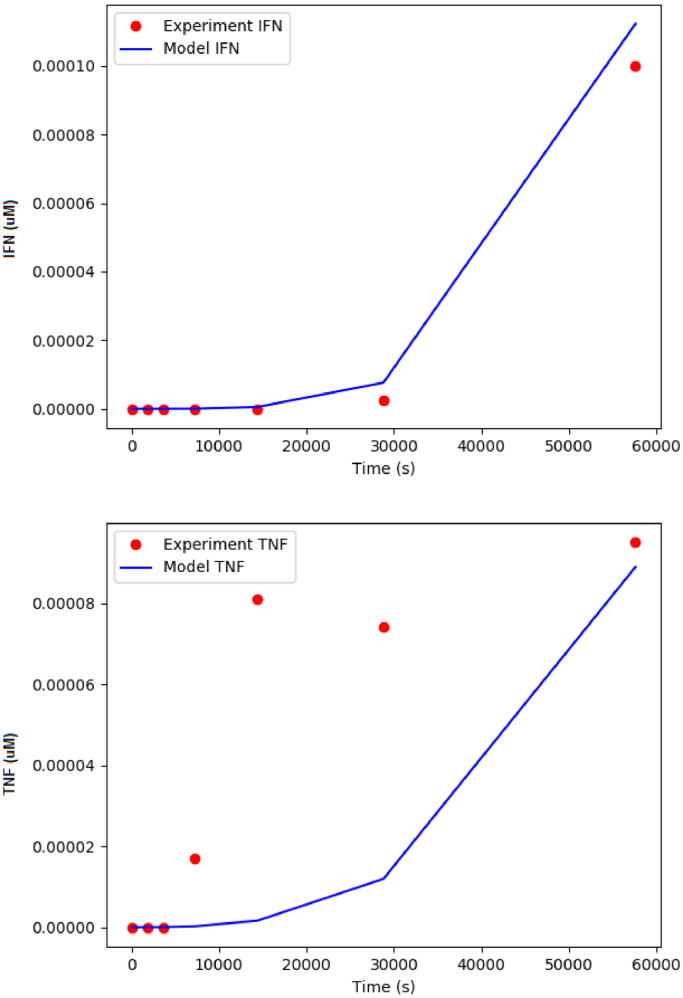
KIR2DL4 is an interesting receptor expressed on the peripheral blood natural killer (pbNK) cell as it can be either activating or inhibitory depending on the amino acid residues in the domain. This model uses mathematical modelling to investigate the downstream effects of natural killer cells' activation (KIR2DL4) receptor after stimulation by key ligand (HLA-G) on pbNK cells. Development of this large pathway is based on a comprehensive qualitative description of pbNKs' intracellular signalling pathways leading to chemokine and cytotoxin secretion, obtained from the KEGG database (https://www.genome.jp/pathway/hsa04650). From this qualitative description we built a quantitative model for the pathway, reusing existing curated models where possible and implementing new models as needed. This model employs a composite approach for generating modular models. The approach allows for the construction of large-scale complex model by combining component of sub-models that can be modified individually. This large pathway consists of two published sub-models; the Ca2+ model and the NFAT model, and a newly built FCεRIγ sub-model. The full pathway was fitted to published dataset and fitted well to one of two secreted cytokines. The model can be used to predict the production of IFNγ and TNFα cytokines.•Development of pathway and mathematical model•Reusing existing curated models and implementing new models•Model optimization and analysis.

Keywords: Intracellular signalling pathway; Mathematical model; Modularisation.


Conflict of interest statement

The authors declare that they have no known competing financial interests or personal relationships that could have appeared to influence the work reported in this paper.

Figures

Image, graphical abstract
Graphical abstract
Fig 1
Fig. 1
Schematic representation of TNFα and IFNγ secretions induced by HLA-G signalling pathway. Soluble HLA-G has been known to be a ligand for KIR2DL4. Soluble HLA-G originates from cell surface-bound HLA-G. Metalloproteinase (a protease enzyme) is responsible for the cleavage/release of HLA-G from the surface. The experimental setting used to fit the data also used soluble HLA-G to stimulate KIR2DL4. In our model, we assumed that the HLA-G that binds to KIR2DL4 is soluble HLA-G. The transient passage of endocytosed KIR2DL4 receptor at the cell surface occurs when an NK cell is activated by IL-2 is sufficient to capture soluble HLA-G and transport it to the endosomes. The endocytosed HLA-G/KIR2DL4 complex recruits FCεRIγ and aggregate FCεRIγ. FCεRIγ activation is known to induce phosphoinositide 3-kinase (PI3K) ,. PI3K-mediated production of phosphatidylinositol 3,4,5-triphosphate (PtdIns(3,4,5)P3) allosterically enhances PLC activity downstream. This early signalling pathway then activates the NFAT futile cycle and initiates the regulation of IFNγ and TNFα secretion in NK cells.
Fig 2
Fig. 2
A phylogenetic tree showing the evolutionary relationships among existing and new sub-models of the pathway. We consider three distinct levels of models. Level 1 modules are created from models of components of the signalling pathways that already exist in the literature. Level 2 modules are small connected components of the signalling pathway that determined by the availability of experimental data which allows the parameters of the modules to be define. Level 3 combined all sub-models together to create a whole model. Sub-models highlighted in green boxes mean experimental data exists.
Fig 3
Fig. 3
Flow chart of steps in re-using and importing components into a new model. Model components in CellML contain units, variables and equations and can be connected to other components through mapping to allow information to be shared between the components. The CellML encapsulation feature allows users to encapsulate components, either to hide the complexity of a model by creating submodels, or to provide mechanisms for plugging in different implementations of a particular detail of a model.
Fig 4
Fig. 4
Overall structure of the top level CellML model showing the encapsulation hierarchy, the CellML model imports and the other key parts (units, components, and mappings).
Fig 5
Fig. 5
Pathway of interest from Dupont & Erneux model . Activation of PLC synthesizes IP3, which then induces the release of Ca2+ from internal stores in the cell. IP3 is a protein known to stimulate the recruitment of Ca2+ from cellular stores. IP3 binds to IP3 receptors located on the membranes of intracellular stores of Ca2+ and stimulates the release of Ca2+ into the cytosol. Ca2+ activation happens rapidly in the system. At the same time, ATPases pump Ca2+ back from the cytosol to the stores.
Fig 6
Fig. 6
Pathway of interest from the Cooling et al. model . To illustrate the details of the reaction, we show the translocation reaction in this diagram. NFAT is stimulated by calcium signals. The activation and translocation of NFAT into the nucleus stimulate the production of cyokines. We replicated important regulation of calcium Ca2+ oscillations and calcineurin (CaN) to downstream NFAT cycling.
Fig 7
Fig. 7
Schematic diagram of the FCεRIγ signalling pathways. Two sets of experimental data were available in the literature for this pathway; Tsang et al. (2008) and Faeder et al. (2003) . In this model, we simulated the phosphorylation of Grb2 and Syk downstream to the activation of FCεRIγ.
Fig 8
Fig. 8
Oscillations for (a) Ca2+ and (b) Ins-1,4,5-P3 (IP3) metabolism without the production of IP4 for the Dupont and Erneux model. The graphs are simulated in OpenCOR. The simulation retained the oscillation of Ca2+ and the oscillation of IP3 disappeared without the changes of IP3 into IP4. The SED-ML associated with this model is available at https://github.com/Nurulizza/HLAG_to_cytokine/blob/master/dupont_Ca/dupont_erneux_1997_fig2.sedml.
Fig 9
Fig. 9
The best fit for phosphorylation of Grb2 with the experimental observations of Tsang et al. . The simulation time was 3500 s. The RMSE for the model is 0.0695 μM. The model predictions represented the experimental data very well. Blue curves show model predictions and red points are observed experimental data in Tsang et al. . The SED-ML associated with this model can be found at https://github.com/Nurulizza/FCepsilonRI/blob/master/FCepsilonRI_Tsangdata.sedml.
Fig 10
Fig. 10
The best fit for phosphorylation of FCεRIγ (pFC) (top) and phosphorylation of Syk (bottom). The simulation time was 4000 s. The RMSEs are 0.0089 μM for FC phosphorylation and 0.0022 μM for Syk phosphorylation. These best fits are not perfect representations of the data, however, the available data are relatively sparse in time, and appear to contain more noise, so it may not be possible to obtain a clearly better fit to these data points. Blue curves show model predictions and red points are observed experimental data from Faeder et al. . The SED-ML associated with this model is available at https://github.com/Nurulizza/FCepsilonRI/blob/master/FCepsilonRI_Faederdata.sedml.
Fig 11
Fig. 11
Fitted model to data from Rajagopalan et al. of (a) IFNγ and (b) TNFα intracellular cytokine production. The simulation time was 60000 s. The model prediction represented IFNγ cytokine secretion experimental data well, however the model did not represented TNFα secretion very well. Blue curves show model predictions and red points are observed experimental data from Rajagopalan et al. . The SED-ML associated with this model is available at https://github.com/Nurulizza/HLAG_to_cytokine/blob/master/dl4cytokines.sedml.

Similar articles

References

    1. Azzoni L., Kamoun M., Salcedo T.W., Kanakaraj P., Perussia B. Stimulation of fc gamma riiia results in phospholipase C-gamma 1 tyrosine phosphorylation and p56lck activation. J. Exp. Med. 1992;176(6):1745–1750. - PMC - PubMed
    1. Ting A.T., Karnitz L.M., Schoon R.A., Abraham R.T., Leibson P.J. Fc gamma receptor activation induces the tyrosine phosphorylation of both phospholipase c (PLC)-gamma 1 and PLC-gamma 2 in natural killer cells. J. Exp. Med. 1992;176(6):1751–1755. - PMC - PubMed
    1. Aramburu J., Azzoni L., Rao A., Perussia B. Activation and expression of the nuclear factors of activated t cells, NFATp and NFATc, in human natural killer cells: regulation upon CD16 ligand binding. J. Exp. Med. 1995;182(3):801–810. - PMC - PubMed
    1. Sica A., Dorman L., Viggiano V., Cippitelli M., Ghosh P., Rice N., Young H.A. Interaction of nf-κb and nfat with the interferon-γ promoter. J. Biol. Chem. 1997;272(48):30412–30420. - PubMed
    1. Pfeiffer J.R., Oliver J.M. Tyrosine kinase-dependent assembly of actin plaques linking fc epsilon R1 cross-linking to increased cell substrate adhesion in RBL-2H3 tumor mast cells. J. Immunol. 1994;152(1):270–279. - PubMed