. 2022 Jun 14:13:871972.
doi: 10.3389/fgene.2022.871972. eCollection 2022.

Differentially Expressed Bone Marrow microRNAs Are Associated With Soluble HLA-G Bone Marrow Levels in Childhood Leukemia

Affiliations

Differentially Expressed Bone Marrow microRNAs Are Associated With Soluble HLA-G Bone Marrow Levels in Childhood Leukemia

Renata Santos Almeida et al. Front Genet. .

Abstract

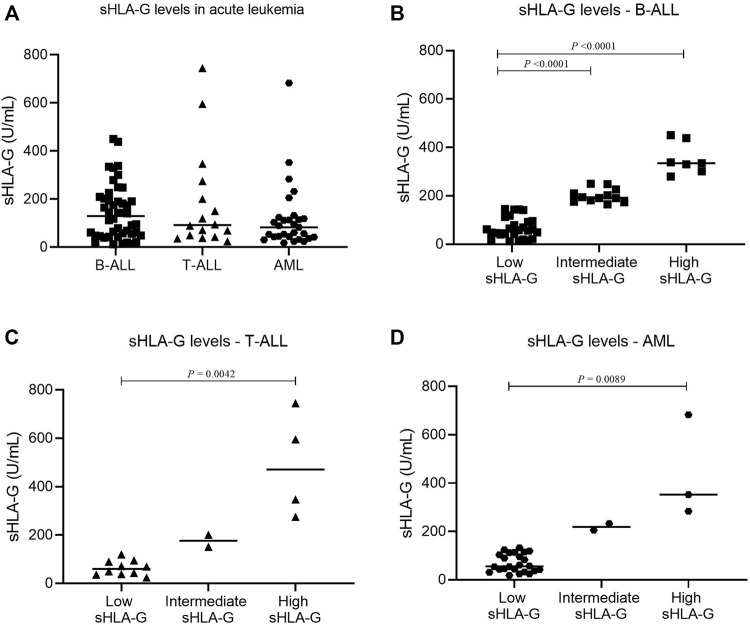
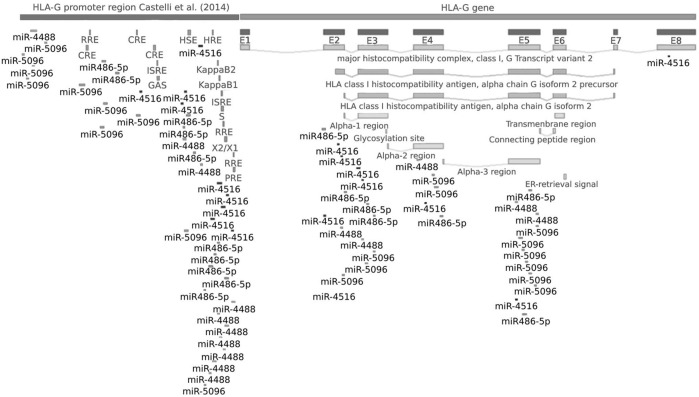
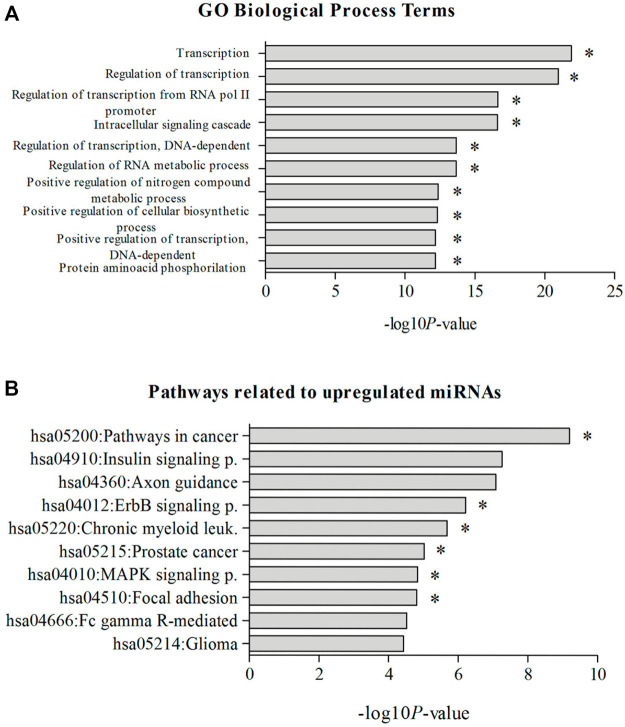
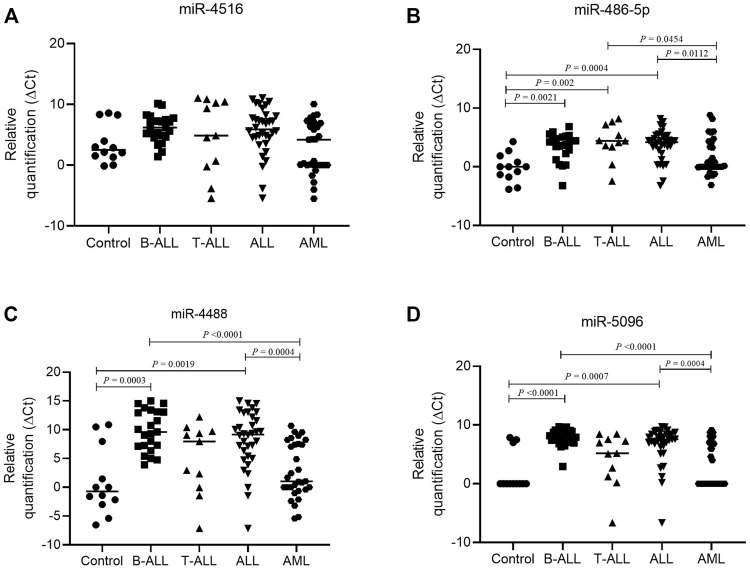
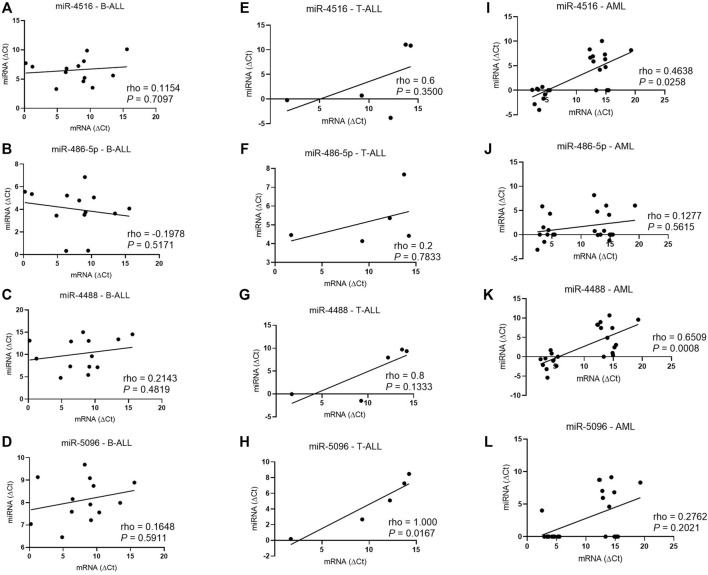
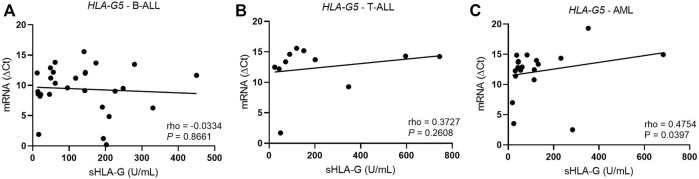
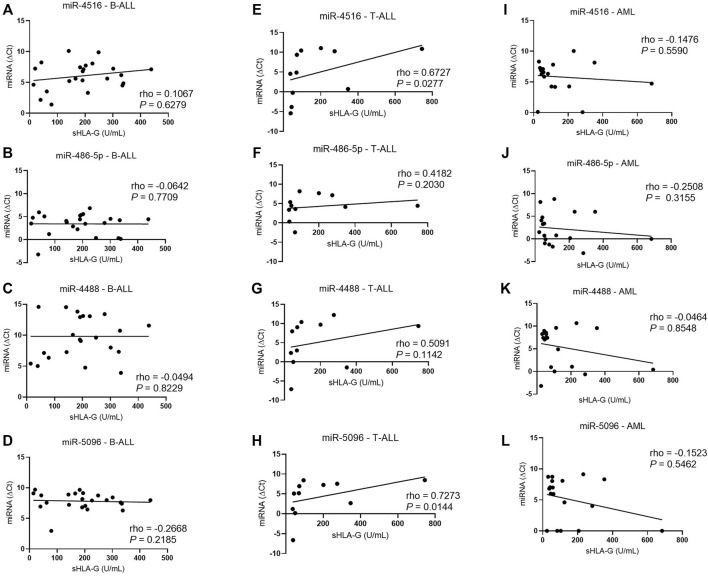
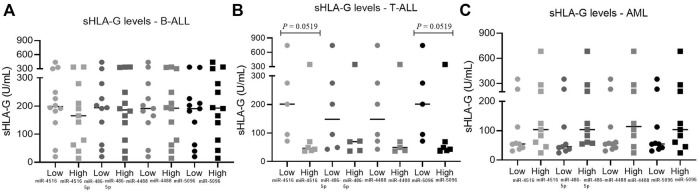
HLA-G is a nonclassical histocompatibility class I molecule that plays a role in immune vigilance in cancer and infectious diseases. We previously reported that highly soluble HLA-G (sHLA-G) levels in the bone marrow were associated with a high blood cell count in T-acute lymphoblastic leukemia, a marker associated with a poor prognosis. To understand the posttranscriptional HLA-G gene regulation in leukemia, we evaluated the bone marrow microRNA profile associated with the HLA-G bone marrow mRNA expression and sHLA-G bone marrow levels in children exhibiting acute leukemia (B-ALL, T-ALL, and AML) using massively parallel sequencing. Ten differentially expressed miRNAs were associated with high sHLA-G bone marrow levels, and four of them (hsa-miR-4516, hsa-miR-486-5p, hsa-miR-4488, and hsa-miR-5096) targeted HLA-G, acting at distinct HLA-G gene segments. For qPCR validation, these miRNA expression levels (ΔCt) were correlated with HLA-G5 and RREB1 mRNA expressions and sHLA-G bone marrow levels according to the leukemia subtype. The hsa-miR-4488 and hsa-miR-5096 expression levels were lower in B-ALL than in AML, while that of hsa-miR-486-5p was lower in T-ALL than in AML. In T-ALL, hsa-miR-5096 correlated positively with HLA-G5 and negatively with sHLA-G. In addition, hsa-miR-4516 correlated negatively with sHLA-G levels. In AML, hsa-miR-4516 and hsa-miR-4488 correlated positively with HLA-G5 mRNA, but the HLA-G5 negatively correlated with sHLA-G. Our findings highlight the need to validate the findings of massively parallel sequencing since the experiment generally uses few individuals, and the same type of leukemia can be molecularly quite variable. We showed that miRNA's milieu in leukemia's bone marrow environment varies according to the type of leukemia and that the regulation of sHLA-G expression exerted by the same miRNA may act by a distinct mechanism in different types of leukemia.

Keywords: ALL; AML; HLA-G; bone marrow; leukemia; microRNA; posttranscriptional regulation.


Conflict of interest statement

The authors declare that the research was conducted in the absence of any commercial or financial relationships that could be construed as a potential conflict of interest.

Figures

FIGURE 1
FIGURE 1
Comparison of sHLA-G levels in the bone marrow stroma of pediatric acute leukemia. (A) sHLA-G in B-ALL (square, n = 46), T-ALL (triangle, n = 16), and AML (hexagon, n = 29); (B) sHLA-G levels in B-ALL (square: low, n = 27; intermediate, n = 12; high, n = 7); (C) sHLA-G levels in T-ALL (triangle: low, n = 10; intermediate, n = 2; high, n = 4); and (D) sHLA-G levels in AML (hexagon: low, n = 24; intermediate, n = 2; high, n = 3). For comparison of the three groups, the Kruskal–Wallis test was used followed by Dunn’s multiple comparison for two groups.
FIGURE 2
FIGURE 2
HLA-G gene binding sites for hsa-miR-5096, hsa-miR-4516, hsa-miR-486-5p, and hsa-miR-4488. The miRNA cascade in the figure indicates putative binding sites in the target gene. Note: the promoter region was mapped and analyzed as described by Castelli et al. (2014). Coding sequence was considered as described by GenBank (<https:// www.ncbi.nlm.nih.gov/nuccore/NG_029039.1>), and exon 8 is considered as the HLA-G 3′UTR [5].
FIGURE 3
FIGURE 3
Most significant KEGG pathways. (A) GO, biological process terms; (B) related to upregulated miRNAs in childhood in ALL patients with high sHLA-G levels. Note: *pathways containing genes coding for positive or negative regulators of HLA-G expression. KEGG pathway categories: hsa05200:Pathways in cancer, hsa04910:Insulin signaling pathway, hsa04360:Axon guidance, hsa04012:ErbB signaling pathway, hsa05220:Chronic myeloid leukemia, hsa05215:Prostate cancer, hsa04010:MAPK signaling pathway, hsa04510:Focal adhesion, hsa04666:Fc gamma R–mediated phagocytosis, hsa05214:Glioma. GO, biological process terms: GO:0006350—transcription, GO:0045449—regulation of transcription, GO:0006357—regulation of transcription from RNA polymerase II promoter, GO:0007242—intracellular signaling cascade, GO:0006355—regulation of transcription, DNA dependent, GO:0051252—regulation of RNA metabolic process, GO:0051173—positive regulation of nitrogen compound metabolic process, GO:0031328—positive regulation of cellular biosynthetic process, GO:0045893—positive regulation of transcription, DNA dependent, GO:0006468—protein amino acid phosphorylation.
FIGURE 4
FIGURE 4
Difference in miRNA expression in lymphoid and myeloid leukemia. (A) Relative expression of hsa-miR-4516 in control (circle, n = 12), B-ALL (square, n = 23), T-ALL (triangle, n = 11), ALL (inverted triangle, n = 34), and AML (hexagon, n = 31) groups; (B) relative expression of hsa-miR-486-5p in control (circle, n = 12), B-ALL (square, n = 23), T-ALL (triangle, n = 11), ALL (inverted triangle, n = 34), and AML (hexagon, n = 31) groups; (C) relative expression of hsa-miR-4488 in control (circle, n = 12), B-ALL (square, n = 23), T-ALL (triangle, n = 11), ALL (inverted triangle, n = 34), and AML (hexagon, n = 31) groups; and (D) relative expression of hsa-miR-5096 in control (circle, n = 12), B-ALL (square, n = 23), T-ALL (triangle, n = 11), ALL (inverted triangle, n = 34), and AML (hexagon, n = 31) groups. For comparing three or more groups, the Kruskal–Wallis test was used followed by Dunn’s multiple comparison for two groups. Note: For delta Ct, the higher the values, the lower the miRNA expression.
FIGURE 5
FIGURE 5
Correlation coefficient analysis between miRNAs and HLA-G5 mRNA levels in the bone marrow from patients with untreated leukemia. (A) Correlation coefficient analysis between hsa-miR-4516 and HLA-G5 in B-ALL (n = 13); (B) correlation coefficient analysis between hsa-miR-486-5p and HLA-G5 in B-ALL (n = 13); (C) correlation coefficient analysis between hsa-miR-4488 and HLA-G5 in B-ALL (n = 13); (D) correlation coefficient analysis between hsa-miR-5096 and HLA-G5 in B-ALL (n = 13); (E) correlation coefficient analysis between hsa-miR-4516 and HLA-G5 in T-ALL (n = 5); (F) correlation coefficient analysis between hsa-miR-486-5p and HLA-G5 in T-ALL (n = 5); (G) correlation coefficient analysis between hsa-miR-4488 and HLA-G5 in T-ALL (n = 5); (H) correlation coefficient analysis between hsa-miR-5096 and HLA-G5 in T-ALL (n = 5); (I) correlation coefficient analysis between hsa-miR-4516 and HLA-G5 in AML (n = 23); (J) correlation coefficient analysis between hsa-miR-486-5p and HLA-G5 in AML (n = 23); (K) correlation coefficient analysis between hsa-miR-4488 and HLA-G5 in AML (n = 23); and (L) correlation coefficient analysis between hsa-miR-5096 and HLA-G5 in AML (n = 23). For the correlation analysis, the Spearman’s correlation coefficient was used.
FIGURE 6
FIGURE 6
Correlation coefficient analysis between HLA-G5 mRNA and sHLA-G levels in the bone marrow from patients with untreated leukemia. (A) Correlation coefficient analysis between HLA-G5 and sHLA-G in B-ALL (n = 28); (B) correlation coefficient analysis between HLA-G5 and sHLA-G in T-ALL (n = 11); and (C) correlation coefficient analysis between HLA-G5 and sHLA-G in AML (n = 19). For the correlation analysis, the Spearman’s correlation coefficient was used.
FIGURE 7
FIGURE 7
Correlation coefficient analysis between miRNAs expression and sHLA-G levels in the bone marrow from patients with untreated leukemia. (A) Correlation between hsa-miR-4516 and sHLA-G in B-ALL (n = 23); (B) correlation between hsa-miR-486-5p and sHLA-G in B-ALL (n = 23); (C) correlation between hsa-miR-4488 and sHLA-G in B-ALL (n = 23); (D) correlation between hsa-miR-5096 and sHLA-G in B-ALL (n = 23); (E) correlation between hsa-miR-4516 and sHLA-G in T-ALL (n = 11); (F) correlation between hsa-miR-486-5p and sHLA-G in T-ALL (n = 11); (G) correlation between hsa-miR-4488 and sHLA-G in T-ALL (n = 11); (H) correlation between hsa-miR-5096 and sHLA-G in T-ALL (n = 11); (I) correlation between hsa-miR-4516 and sHLA-G in AML (n = 18); (J) correlation between hsa-miR-486-5p and sHLA-G in AML (n = 18); (K) correlation between hsa-miR-4488 and sHLA-G in AML (n = 18); and (L) correlation between hsa-miR-5096 and sHLA-G in AML (n = 18). For the correlation analysis, the Spearman’s correlation coefficient was used.
FIGURE 8
FIGURE 8
Relationship between sHLA-G with miRNAs expression in leukemic bone marrow. (A) Relationship between sHLA-G and miRNAs expression in B-ALL: low miR-4516, n = 12; high miR-4516, n = 11; low miR-486-5p, n = 11, high miR-486-5p, n = 12; low miR-4488, n = 11, high miR-4488, n = 12; low miR-5096, n = 11, high miR-5096, n = 12; (B) relationship between sHLA-G and miRNAs expression in T-ALL: low miR-4516, n = 5, high miR-4516, n = 6; low miR-486-5p, n = 6, high miR-486-5p, n = 5; low miR-4488, n = 6, high miR-4488, n = 5; low miR-5096, n = 5, high miR-5096, n = 6; (C) relationship between sHLA-G and miRNAs expression in AML: low miR-4516, n = 9, high miR-4516, n = 9; low miR-486-5p, n = 9, high miR-486-5p, n = 9; low miR-4488, n = 10, high miR-4488, n = 8; low miR-5096, n = 9, high miR-5096, n = 9. For comparison of two groups, the Mann–Whitney test was used.

Similar articles

Cited by

References

    1. Agaugué S., Carosella E. D., Rouas-Freiss N. (2011). Role of HLA-G in Tumor Escape through Expansion of Myeloid-Derived Suppressor Cells and Cytokinic Balance in Favor of Th2 versus Th1/Th17. J. Am. Soc. Hematol. 117 (26), 7021–7031. 10.1182/blood-2010-07-294389 - DOI - PubMed
    1. Almeida R. S., Araújo F. S., Oliveira S. A. V., Coutinho L. L., Donadi E. A., Lucena‐Silva N. (2018). “Mirnome Analysis of Brazilian Childhood Acute Lymphoblastic Leukemia Reveals an Association of 10 miRNAs with Increased Soluble HLA-G Levels,” in Abstracts from the 50th Congress of the International Society of Paediatric Oncology (SIOP) Kyoto, Japan November 16-19, 2018 (Pediatr: Blood Cancer; ). 10.1002/pbc.27455 - DOI - PubMed
    1. Almeida R. S., Costa E Silva M., Coutinho L. L., Garcia Gomes R., Pedrosa F., Massaro J. D., et al. (2019). MicroRNA Expression Profiles Discriminate Childhood T‐ from B‐acute Lymphoblastic Leukemia. Hematological Oncol. 37 (1), 103–112. 10.1002/hon.2567 - DOI - PubMed
    1. Amodio G., Gregori S. (2020). HLA-G Genotype/expression/disease Association Studies: success, Hurdles, and Perspectives. Front. Immunol. 11, 1178. 10.3389/fimmu.2020.01178 - DOI - PMC - PubMed
    1. Barroilhet L., Yang J., Hasselblatt K., Paranal R. M., Ng S. K., Rauh-Hain J. A., et al. (2013). C-terminal Binding Protein-2 Regulates the Response of Epithelial Ovarian Cancer Cells to Histone Deacetylase Inhibitors. Oncogene 32 (33), 3896–3903. 10.1038/onc.2012.380 - DOI - PubMed