. 2022 Jun 14:13:895587.
doi: 10.3389/fgene.2022.895587. eCollection 2022.

Identification of Immune-Related Hub Genes in Thymoma: Defects in CD247 and Characteristics of Paraneoplastic Syndrome

Affiliations

Identification of Immune-Related Hub Genes in Thymoma: Defects in CD247 and Characteristics of Paraneoplastic Syndrome

Lin-Fang Deng. Front Genet. .

Abstract

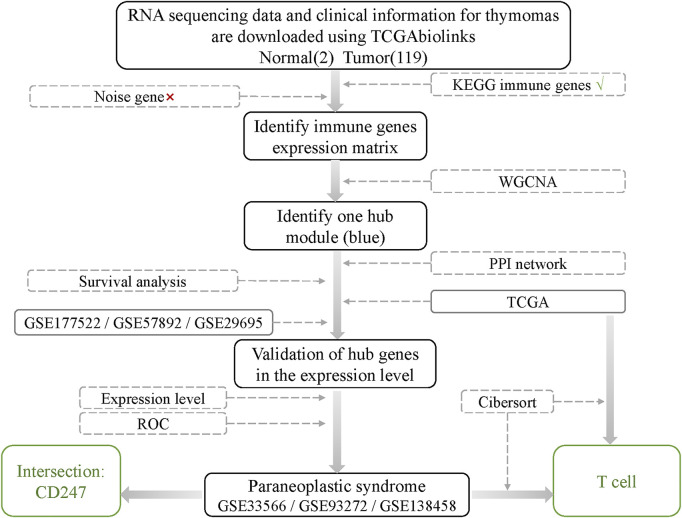
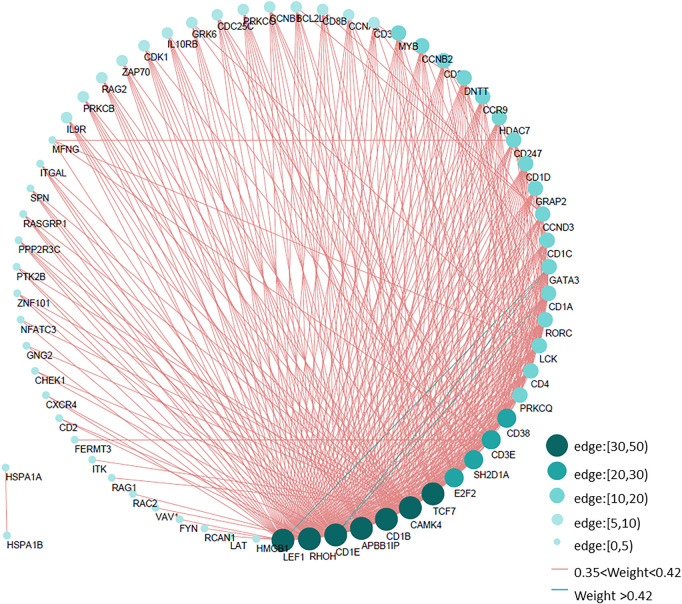
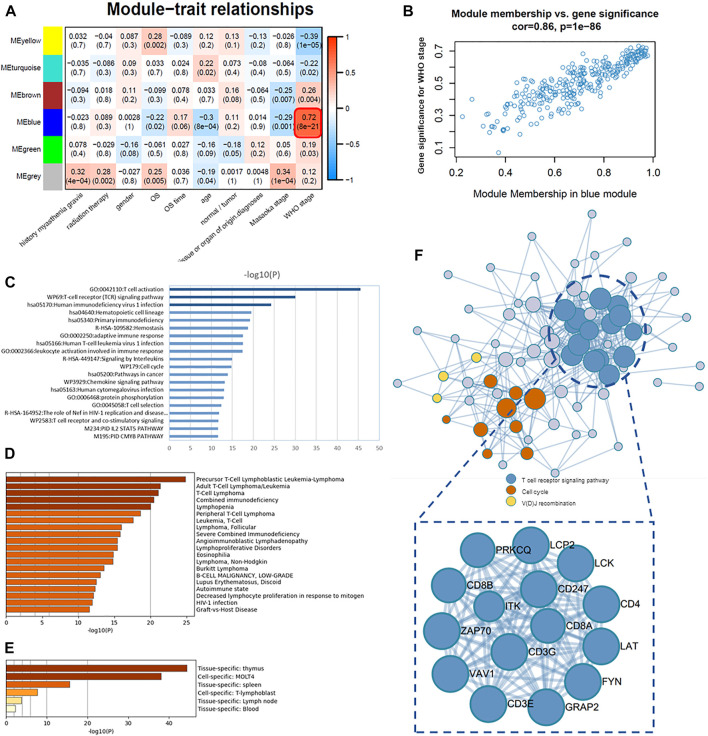
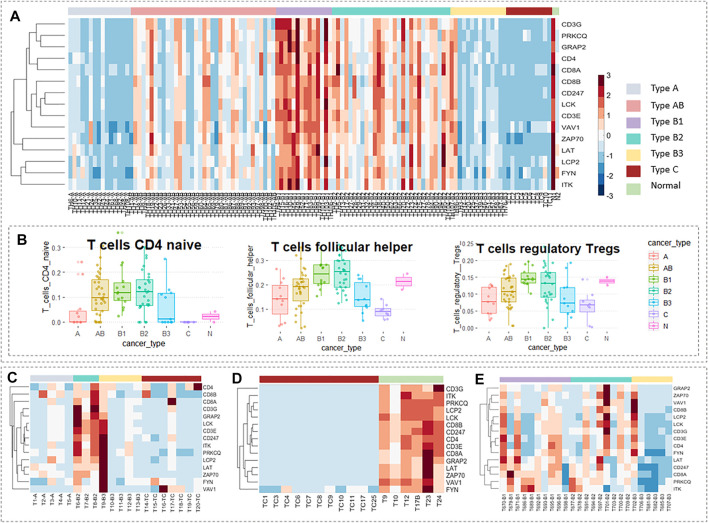
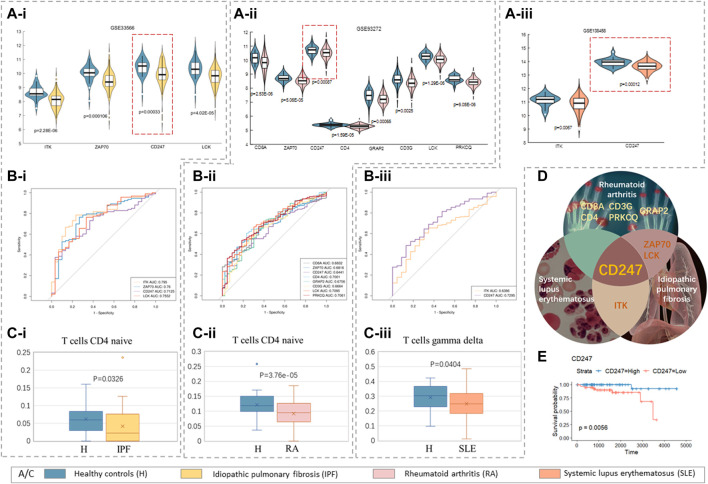
Background: Thymomas (Ts) and thymic carcinomas (TCs) are rare primary tumors of the mediastinum. Paraneoplastic syndrome (PNS) is an important feature of thymoma, which presents great challenges to clinicians. Methods: The present study uses the weighted gene co-expression network analysis (WGCNA) to identify possible immunologic mechanisms of thymoma. RNA sequencing data from thymoma samples were downloaded from the TCGA. Core genes were taken from the module that is closely related to the WHO's stage of classification. Enhanced analysis using the online database "Metascape" and an overall survival (OS) analysis were carried out via the Kaplan-Meier method. The hub genes were obtained from the protein-protein interaction (PPI) network. In addition, we jointly analyzed multiple sets of PNS data related to thymomas from other sources to verify the correlation between thymomas and PNS. The impact of hub genes on the prognosis of PNS was evaluated via the ROC curve, with simultaneous analysis of immune infiltration by CIBERSORT. Findings: The 14 immune hub genes closely related to thymomas were found to be jointly involved in the T-cell receptor signaling pathway. Compared to the normal thymus and type B1/B2 thymoma, there is a lower number of T-cells in type A/B3 thymoma and thymic carcinoma. The expression of genes related to the T-cell receptor signaling pathway appeared defective. The low expression of CD247 and the decrease in the number of mature T-cells are common features among thymomas, specific pulmonary fibrosis, rheumatoid arthritis, and systemic lupus erythematosus.

Keywords: CD247; Thymomas; WGCNA; immune; paraneoplastic syndrome (PNS).


Conflict of interest statement

The author declares that the research was conducted in the absence of any commercial or financial relationships that could be construed as a potential conflict of interest.

Figures

FIGURE 1
FIGURE 1
Workflow of searching hub genes in thymoma.
FIGURE 2
FIGURE 2
Heat map of immune gene correlation matrix clustering. (A) Correlation matrix clustering hot map of 2,247 immune genes in TCGA thymoma data. (B) The 2,023 immune gene correlation matrix clustering heat map. Of these, 224 noise genes are eliminated by the correlation method. Red means positive correlation, blue means negative correlation, and white means no correlation.
FIGURE 3
FIGURE 3
WGCNA of immune genes in thymoma. (A) Cluster analysis of samples to detect outliers. (B) Determination of soft-thresholding power in weighted gene co-expression network analysis. The left shows the scale-free fit index (y-axis) as a function of the soft-thresholding power (x-axis). The right shows the average connectivity (degree, y-axis) as a function of the soft-thresholding power (x-axis). (C,D) Module eigengene dendrogram and heatmap of eigengene adjacency. (E) Clustering dendrogram of genes, with dissimilarity based on the topological overlap, together with assigned module colors.
FIGURE 4
FIGURE 4
Immune gene interaction network of thymoma. According to the gene interaction table obtained by WGCNA, the edges with a weight greater than 0.35 in five modules are selected to draw the immune network of thymoma. The size of the circle and the depth of the color indicate the different number of edges, cf. Table 3.XLSX of the Supplementary Material.
FIGURE 5
FIGURE 5
Association of modules with clinical traits and determination of core genes. (A) Module–trait associations: each row corresponds to a module eigengene and each column to a trait. Each cell contains the corresponding correlation and p-value. (B) Scatter plots of GS score and MM for genes in the blue module. (C) Pathway and process enrichment analysis: bar graph of enriched terms across 87 core genes (intramodular connectivity >0.7) in the blue module, colored by p-values. (D) Summary of enrichment analysis in DisGeNET, colored by p-values. (E) Summary of enrichment analysis in PaGenBase, colored by p-values. (F) Protein–protein interaction (PPI) network of 87 core genes.
FIGURE 6
FIGURE 6
Validation of hub genes in the expression level. Expression levels of 15 hub genes in TCGA data. (B) The proportion of T-cells of each thymic tumor subtype in TCGA data obtained by the CIBERSORT algorithm. (C) Expression levels of 15 hub genes in GSE57892 data. There are 25 samples in total, including two cases of type AB thymoma, five of type A thymoma, three of type B2 thymoma, five of type B3 thymoma, seven of thymic carcinomas, and three of cell line. (D) Expression levels of 15 hub genes in GSE177522 data. There are 19 samples in total, including 11 cases of thymic carcinoids, two cases of thymoma, and six cases of the normal thymus. (E) Expression levels of 15 hub genes in GSE29695 data. There are 41 samples in total, including nine cases of type AB thymoma, one of type A thymoma, 10 of type B1 thymoma, nine of type B2 thymoma, six of type B3 thymoma, one of type A/B thymoma, one of type B1/B2 thymoma, and four of the cell line. In particular, cell lines and subtypes of less than three samples were not included in the study.
FIGURE 7
FIGURE 7
Paraneoplastic syndrome. (A–i) Idiopathic pulmonary fibrosis, GSE33566; (A–ii) rheumatoid arthritis, GSE93272; (Aiii) systemic lupus erythematosus, GSE138458; (A–i,ii,iii) violin maps of hub genes with significant differences in expression in three PNS. (B–i,ii,iii) The area under the curve of these significant genes (AUC) by receiver operating characteristics (ROC) analysis. (C–i,ii,iii) The box patterns of T-cells with significant differences in the proportions of three PNS. (D) Outline map of intersection genes of three PNS (cf. Table 2.XLSX of the Supplementary Materials). (E) The Kaplan–Meier survival curves of CD247.

Similar articles

Cited by

References

    1. Blum T. G., Misch D., Kollmeier J., Thiel S., Bauer T. T. (2020). Autoimmune Disorders and Paraneoplastic Syndromes in Thymoma. J. Thorac. Dis. 12 (12), 7571–7590. 10.21037/jtd-2019-thym-10 - DOI - PMC - PubMed
    1. Call M. E., Schnell J. R., Xu C., Lutz R. A., Chou J. J., Wucherpfennig K. W. (2006). The Structure of the ζζ Transmembrane Dimer Reveals Features Essential for its Assembly with the T Cell Receptor. Cell 127 (2), 355–368. 10.1016/j.cell.2006.08.044 - DOI - PMC - PubMed
    1. Christopoulos P., Chung I., Bozorgmehr F., Muley T., Meister M., Kobinger S., et al. (2018). Deficient CD247 Expression Is a Typical Histopathological Characteristic of Thymomas with Cortical Features. Histopathology 73 (6), 1040–1043. 10.1111/his.13724 - DOI - PubMed
    1. Christopoulos P., Dopfer E. P., Malkovsky M., Esser P. R., Schaefer H.-E., Marx A., et al. (2015). A Novel Thymoma-Associated Immunodeficiency with Increased Naive T Cells and Reduced CD247 Expression. J. Immunol. 194 (7), 3045–3053. 10.4049/jimmunol.1402805 - DOI - PubMed
    1. Colaprico A., Silva T. C., Olsen C., Garofano L., Cava C., Garolini D., et al. (2016). TCGAbiolinks: an R/Bioconductor Package for Integrative Analysis of TCGA Data. Nucleic Acids Res. 44 (8), e71. 10.1093/nar/gkv1507 - DOI - PMC - PubMed

LinkOut - more resources