. 2022 Jun 14:9:865102.
doi: 10.3389/fnut.2022.865102. eCollection 2022.

Efficacy of Glutamine in Treating Severe Acute Pancreatitis: A Systematic Review and Meta-Analysis

Affiliations

Efficacy of Glutamine in Treating Severe Acute Pancreatitis: A Systematic Review and Meta-Analysis

Shi Dong et al. Front Nutr. .

Abstract

Objectives: The prognosis of severe acute pancreatitis (SAP) patients is closely related to early nutritional support. It is well-established that changes in glutamine (Gln), an important amino acid and nutritional supplement, can reflect disease severity. However, no consensus has been reached on the role of Gln nutrition therapy for SAP patients. We conducted this systematic review and meta-analysis to summarize and evaluate the advantages of Gln supplementation in SAP.

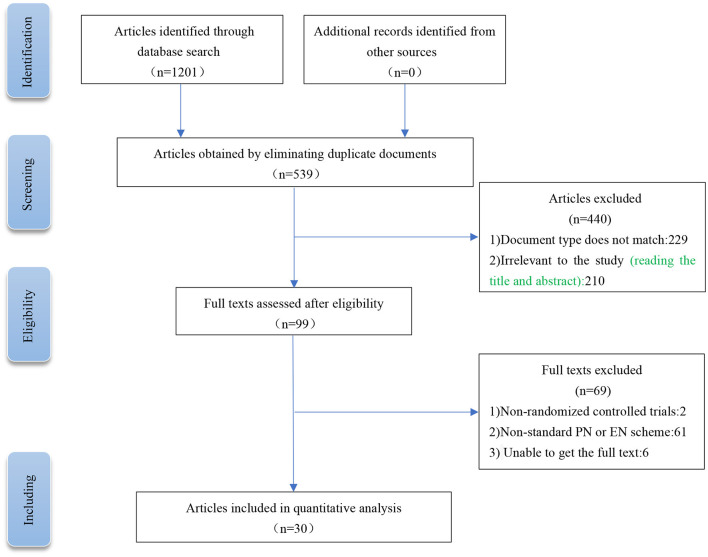
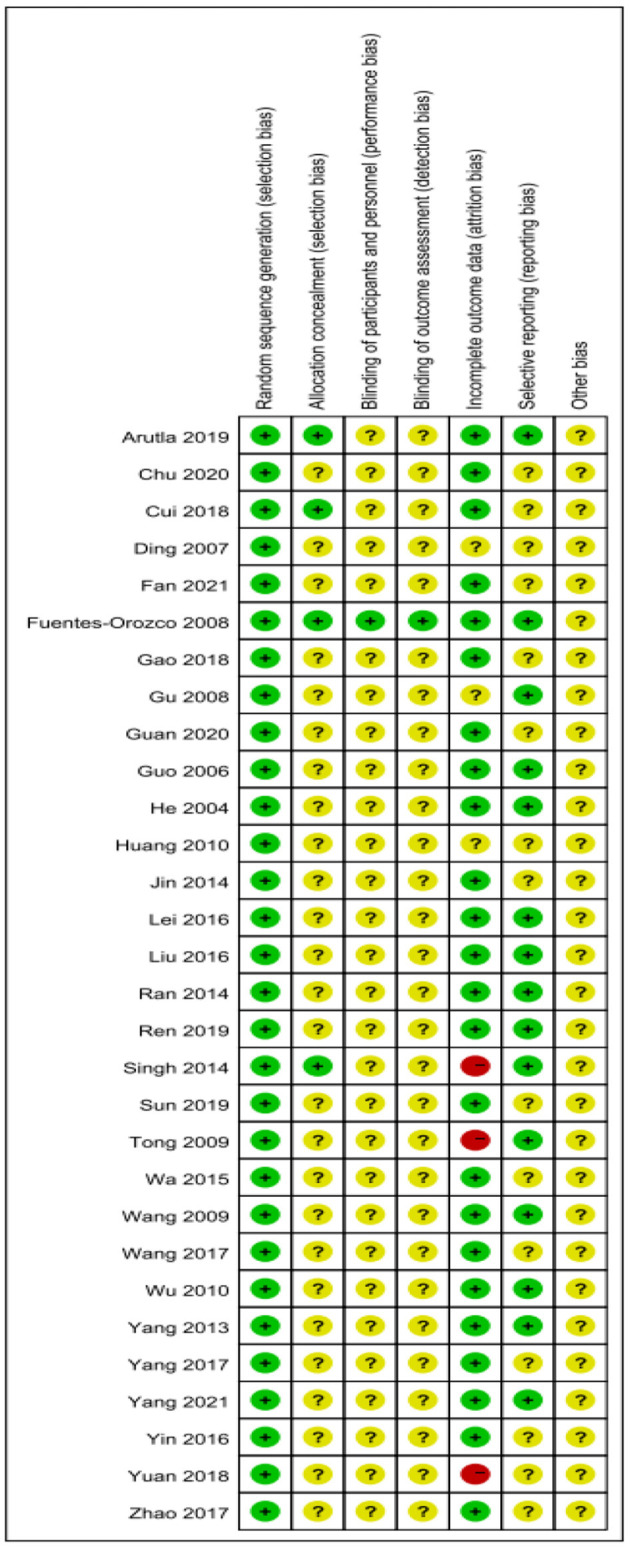
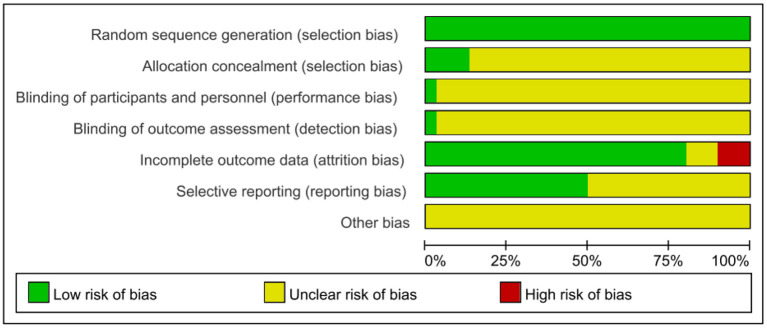
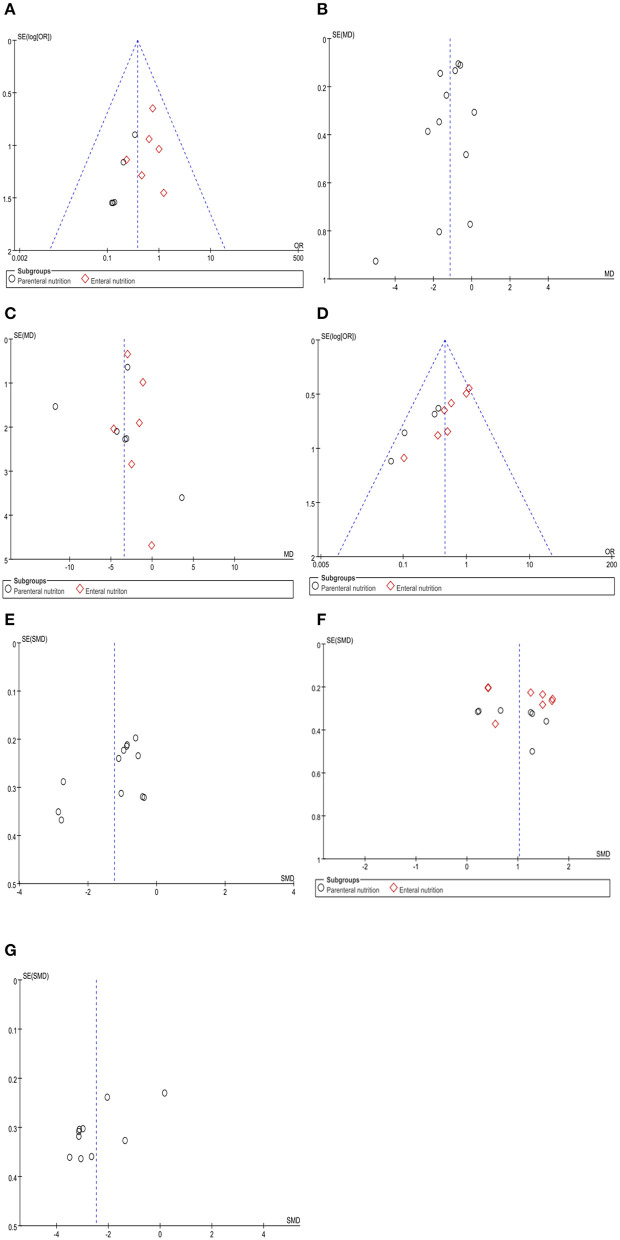
Methods: PubMed, Web of Science, the Embase, Cochrane Library, and Chinese databases (CNKI, SinoMed, Wanfang, and VIP) were systematically searched for eligible studies that included glutamine supplementation in SAP patients from inception to October 31 2021, excluding non-SAP studies. Primary outcome measures included mortality, APACHE II score, complications, and length of hospital stay. The meta-analysis was registered with PROSPERO (CRD42021288371) and was conducted using Review Manager and Stata softwares.

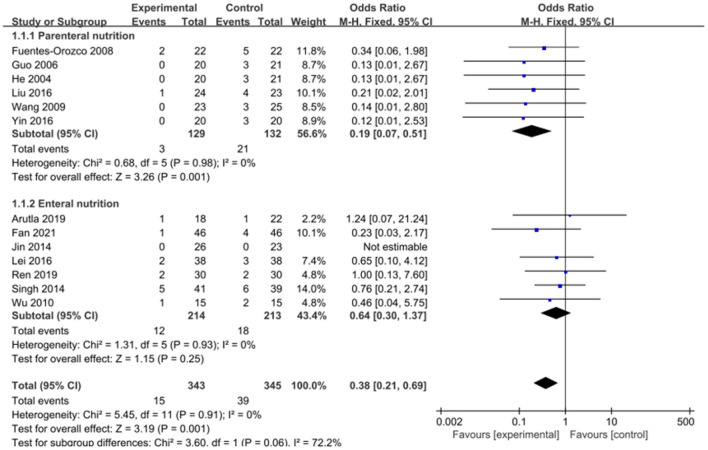
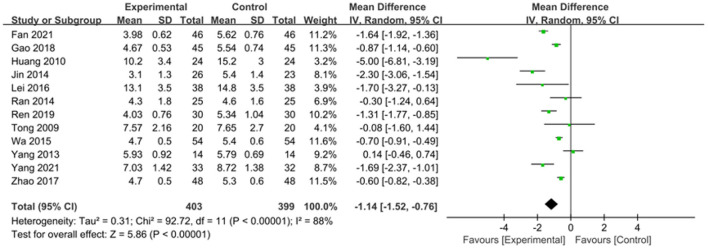
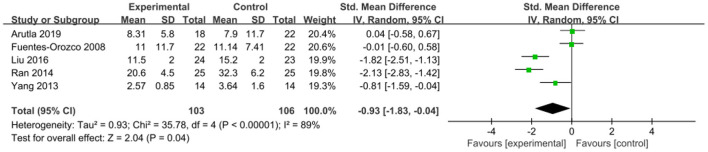
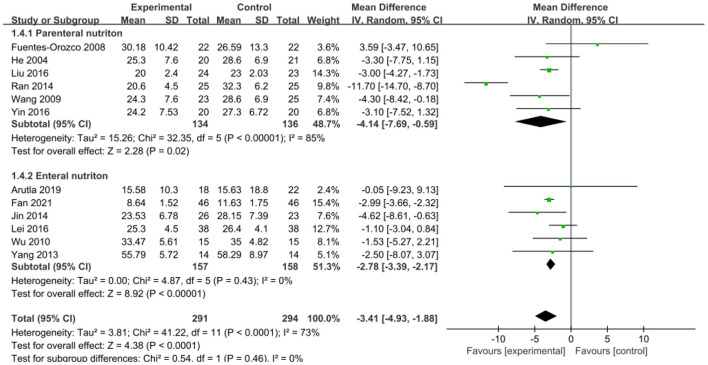
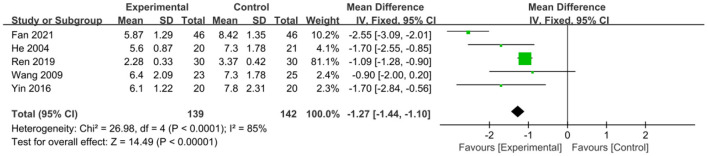
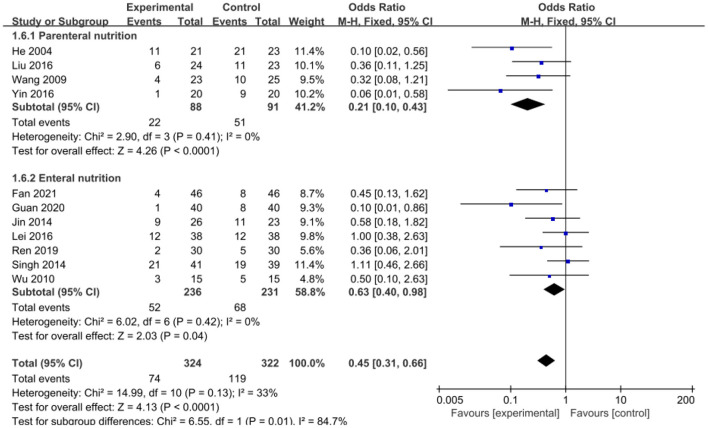
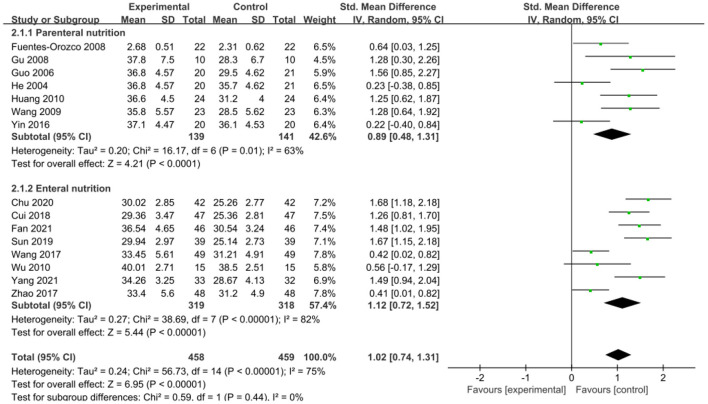
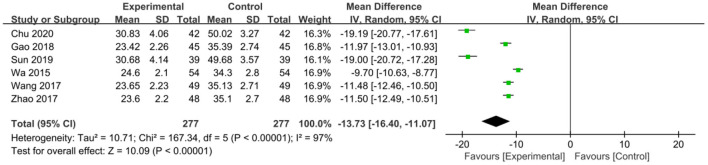
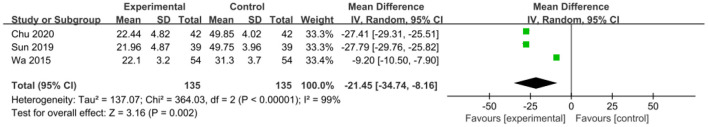
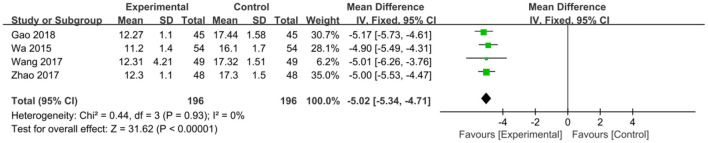
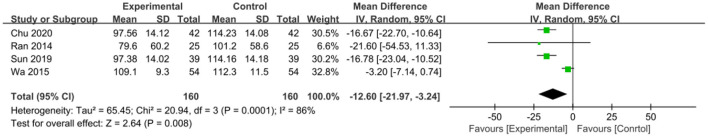
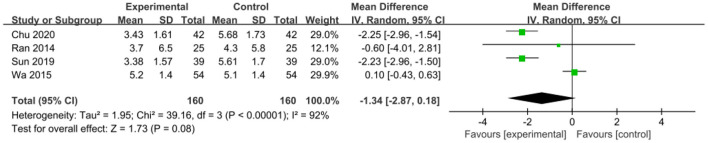
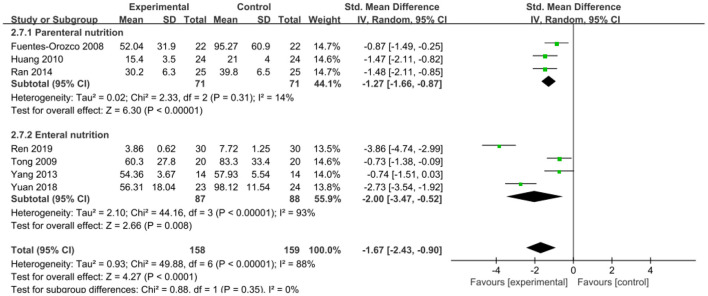
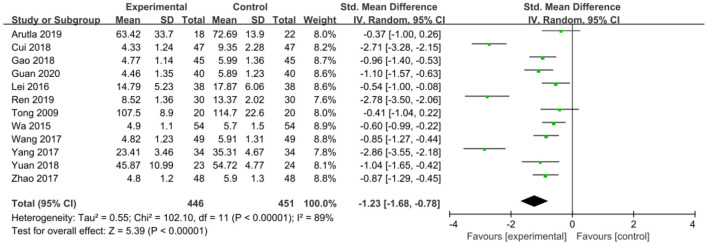
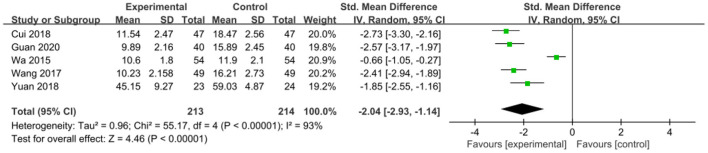
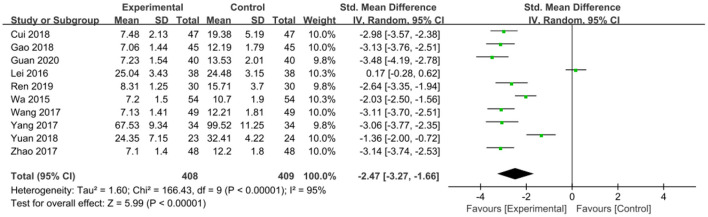
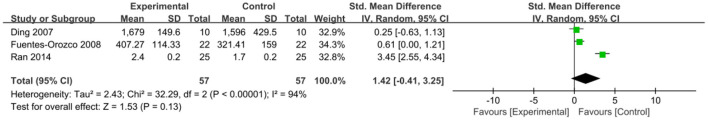
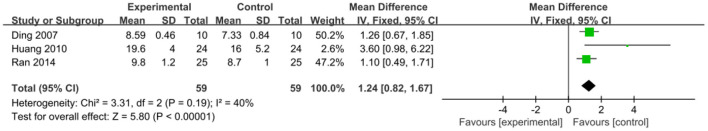
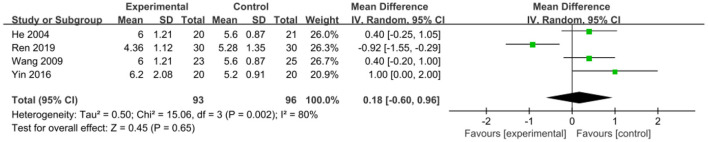
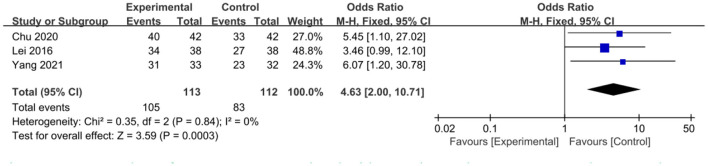
Results: This meta-analysis included 30 randomized controlled trials (RCTs) with a total of 1,201 patients. Six primary outcomes and six secondary outcomes were analyzed. For the primary outcomes, Gln supplementation was associated with lower mortality (OR = 0.38, 95% CI: 0.21-0.69, P = 0.001), total hospital stay (MD = -3.41, 95% CI: -4.93 to -1.88, P < 0.0001) and complications (OR = 0.45, 95% CI: 0.31-0.66, P < 0.0001) compared with conventional nutrition. Further subgroup analysis found that parenteral glutamine was more effective in reducing mortality. In terms of secondary outcomes, Gln supplementation helped restore liver, kidney and immune function, with significantly increased serum albumin (SMD = 1.02, 95% CI: 0.74-1.31, P < 0.00001) and IgG levels (MD = 1.24, 95% CI: 0.82-1.67, P < 0.00001), and decreased serum creatinine (Scr) (MD = -12.60, 95% CI: -21.97 to -3.24, P = 0.008), and inflammatory indicators such as C-reaction protein (CRP) (SMD = -1.67, 95% CI: -2.43 to -0.90, P < 0.0001).

Conclusion: Although Gln supplementation is not routinely recommended, it is beneficial for SAP patients. Indeed, glutamine nutrition has little effect on some indicator outcomes but contributes to improving the prognosis of this patient population.Systematic Review Registration: PROSPERO (york.ac.uk). Unique Identifier: CRD42021288371.

Keywords: glutamine; meta-analysis; prognosis; severe acute pancreatitis; treatment.


Conflict of interest statement

The authors declare that the research was conducted in the absence of any commercial or financial relationships that could be construed as a potential conflict of interest.

Figures

Figure 1
Figure 1
Current meta-analysis article searching and screening strategies.
Figure 2
Figure 2
Risk of bias summary.
Figure 3
Figure 3
Risk of bias graph.
Figure 4
Figure 4
Forest plots of mortality associated with experimental group (parenteral or enteral nutrition group supplemented with Gln) vs. control group (conventional nutrition group). I2 tests and P are the criteria for the heterogeneity test, ♦, pooled odds ratio; —■—, odds ratio, and the edges of ♦, 95% CI.
Figure 5
Figure 5
Forest plots of APACHE II score associated with experimental group (parenteral or enteral nutrition group supplemented with Gln) vs. control group (conventional nutrition group). I2 tests and P are the criteria for the heterogeneity test, ♦, pooled mean difference; —■—, mean difference, and the edges of ♦, 95% CI.
Figure 6
Figure 6
Forest plots of ICU hospital stay associated with experimental group (parenteral or enteral nutrition group supplemented with Gln) vs. control group (conventional nutrition group). I2 tests and P are the criteria for the heterogeneity test, ♦, pooled standard mean difference; —■—, standard mean difference, and the edges of ♦, 95% CI.
Figure 7
Figure 7
Forest plots of total length of hospital stay associated with experimental group (parenteral or enteral nutrition group supplemented with Gln) vs. control group (conventional nutrition group). I2 tests and P are the criteria for the heterogeneity test, ♦, pooled mean difference; —■—, mean difference, and the edges of ♦, 95% CI.
Figure 8
Figure 8
Forest plots of bloating recovery time associated with experimental group (parenteral or enteral nutrition group supplemented with Gln) vs. control group (conventional nutrition group). I2 tests and P are the criteria for the heterogeneity test, ♦, pooled mean difference; —■—, mean difference, and the edges of ♦, 95% CI.
Figure 9
Figure 9
Forest plots of complications associated with experimental group (parenteral or enteral nutrition group supplemented with Gln) vs. control group (conventional nutrition group). I2 tests and P are the criteria for the heterogeneity test, ♦, pooled odds ratio; —■—, odds ratio, and the edges of ♦, 95% CI.
Figure 10
Figure 10
Forest plots of serum albumin associated with experimental group (parenteral or enteral nutrition group supplemented with Gln) vs. control group (conventional nutrition group). I2 tests and P are the criteria for the heterogeneity test, ♦, pooled standard mean difference; —■—, standard mean difference, and the edges of ♦, 95% CI.
Figure 11
Figure 11
Forest plots of ALT associated with experimental group (parenteral or enteral nutrition group supplemented with Gln) vs. control group (conventional nutrition group). I2 tests and P are the criteria for the heterogeneity test, ♦, pooled mean difference; —■—, mean difference, and the edges of ♦, 95% CI.
Figure 12
Figure 12
Forest plots of AST associated with experimental group (parenteral or enteral nutrition group supplemented with Gln) vs. control group (conventional nutrition group). I2 tests and P are the criteria for the heterogeneity test, ♦, pooled mean difference; —■—, mean difference, and the edges of ♦, 95% CI.
Figure 13
Figure 13
Forest plots of TBIL associated with experimental group (parenteral or enteral nutrition group supplemented with Gln) vs. control group (conventional nutrition group). I2 tests and P are the criteria for the heterogeneity test, ♦, pooled mean difference; —■—, mean difference, and the edges of ♦, 95% CI.
Figure 14
Figure 14
Forest plots of Scr associated with experimental group (parenteral or enteral nutrition group supplemented with Gln) vs. control group (conventional nutrition group). I2 tests and P are the criteria for the heterogeneity test, ♦, pooled mean difference; —■—, mean difference, and the edges of ♦, 95% CI.
Figure 15
Figure 15
Forest plots of BUN associated with experimental group (parenteral or enteral nutrition group supplemented with Gln) vs. control group (conventional nutrition group). I2 tests and P are the criteria for the heterogeneity test, ♦, pooled mean difference; —■—, mean difference, and the edges of ♦, 95% CI.
Figure 16
Figure 16
Forest plots of CRP associated with experimental group (parenteral or enteral nutrition group supplemented with Gln) vs. control group (conventional nutrition group). I2 tests and P are the criteria for the heterogeneity test, ♦, pooled standard mean difference; —■—, standard mean difference, and the edges of ♦, 95% CI.
Figure 17
Figure 17
Forest plots of IL-6 associated with experimental group (parenteral or enteral nutrition group supplemented with Gln) vs. control group (conventional nutrition group). I2 tests and P are the criteria for the heterogeneity test, ♦, pooled standard mean difference; —■—, standard mean difference, and the edges of ♦, 95% CI.
Figure 18
Figure 18
Forest plots of IL-8 associated with experimental group (parenteral or enteral nutrition group supplemented with Gln) vs. control group (conventional nutrition group). I2 tests and P are the criteria for the heterogeneity test, ♦, pooled standard mean difference; —■—, standard mean difference, and the edges of ♦, 95% CI.
Figure 19
Figure 19
Forest plots of TNF-α associated with experimental group (parenteral or enteral nutrition group supplemented with Gln) vs. control group (conventional nutrition group). I2 tests and P are the criteria for the heterogeneity test, ♦, pooled standard mean difference; —■—, standard mean difference, and the edges of ♦, 95% CI.
Figure 20
Figure 20
Forest plots of IgA associated with experimental group (parenteral or enteral nutrition group supplemented with Gln) vs. control group (conventional nutrition group). I2 tests and P are the criteria for the heterogeneity test, ♦, pooled standard mean difference; —■—, standard mean difference, and the edges of ♦, 95% CI.
Figure 21
Figure 21
Forest plots of IgG associated with experimental group (parenteral or enteral nutrition group supplemented with Gln) vs. control group (conventional nutrition group). I2 tests and P are the criteria for the heterogeneity test, ♦, pooled mean difference; —■—, mean difference, and the edges of ♦, 95% CI.
Figure 22
Figure 22
Forest plots of serum amylase recovery time associated with experimental group (parenteral or enteral nutrition group supplemented with Gln) vs. control group (conventional nutrition group). I2 tests and P are the criteria for the heterogeneity test, ♦, pooled mean difference; —■—, mean difference, and the edges of ♦, 95% CI.
Figure 23
Figure 23
Forest plots of response rate associated with experimental group (parenteral or enteral nutrition group supplemented with Gln) vs. control group (conventional nutrition group). I2 tests and P are the criteria for the heterogeneity test, ♦, pooled odds ratio; —■—, odds ratio, and the edges of ♦, 95% CI.
Figure 24
Figure 24
Funnel plots of the included studies for mortality (A), APACHE II score (B), total length of hospital stay (C), complications (D), serum albumin (F), IL-6 (E), and TNF-α (G).

Similar articles

Cited by

References

    1. Banks PA, Bollen TL, Dervenis C, Gooszen HG, Johnson CD, Sarr MG, et al. Classification of acute pancreatitis−2012: revision of the Atlanta classification and definitions by international consensus. Gut. (2013) 62:102–11. 10.1136/gutjnl-2012-302779 - DOI - PubMed
    1. Pagliari D, Brizi MG, Saviano A, Mancarella FA, Dal Lago AA, Serricchio ML, et al. Clinical assessment and management of severe acute pancreatitis: a multi-disciplinary approach in the XXI century. Eur Rev Med Pharmacol Sci. (2019) 23:771–87. 10.26355/eurrev_201901_16892 - DOI - PubMed
    1. Heckler M, Hackert T, Hu K, Halloran CM, Büchler MW, Neoptolemos JP. Severe acute pancreatitis: surgical indications and treatment. Langenbecks Arch Surg. (2021) 406:521–35. 10.1007/s00423-020-01944-6 - DOI - PMC - PubMed
    1. Mofidi R, Duff MD, Wigmore SJ, Madhavan KK, Garden OJ, Parks RW. Association between early systemic inflammatory response, severity of multiorgan dysfunction and death in acute pancreatitis. Br J Surg. (2006) 93:738–44. 10.1002/bjs.5290 - DOI - PubMed
    1. Garg PK, Singh VP. Organ failure due to systemic injury in acute pancreatitis. Gastroenterology. (2019) 156:2008–23. 10.1053/j.gastro.2018.12.041 - DOI - PMC - PubMed

Publication types