

Integrative mRNA and Long Noncoding RNA Analysis Reveals the Regulatory Network of Floral Bud Induction in Longan (Dimocarpus longan Lour.)
- PMID: 35774802
- PMCID: PMC9237614
- DOI: 10.3389/fpls.2022.923183
Integrative mRNA and Long Noncoding RNA Analysis Reveals the Regulatory Network of Floral Bud Induction in Longan (Dimocarpus longan Lour.)
Abstract
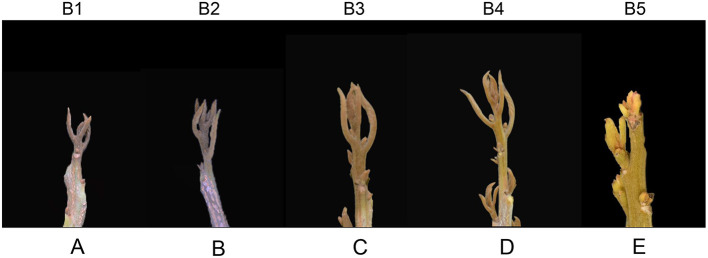
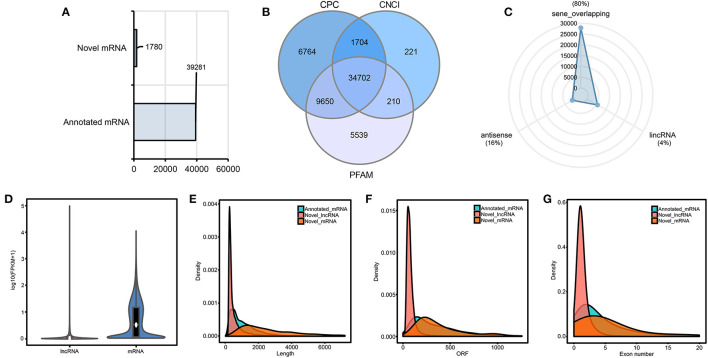
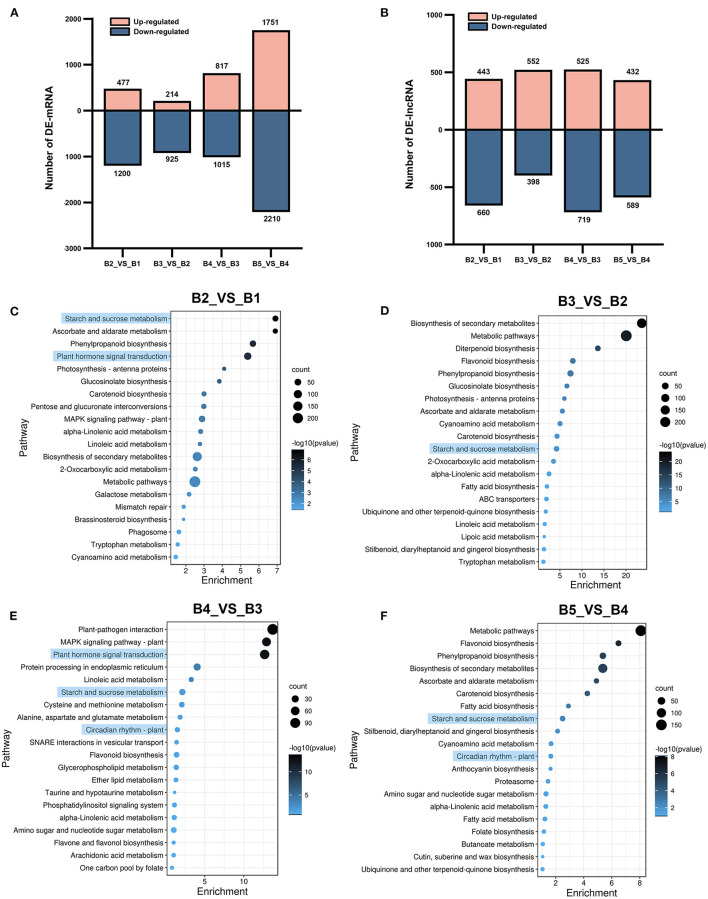
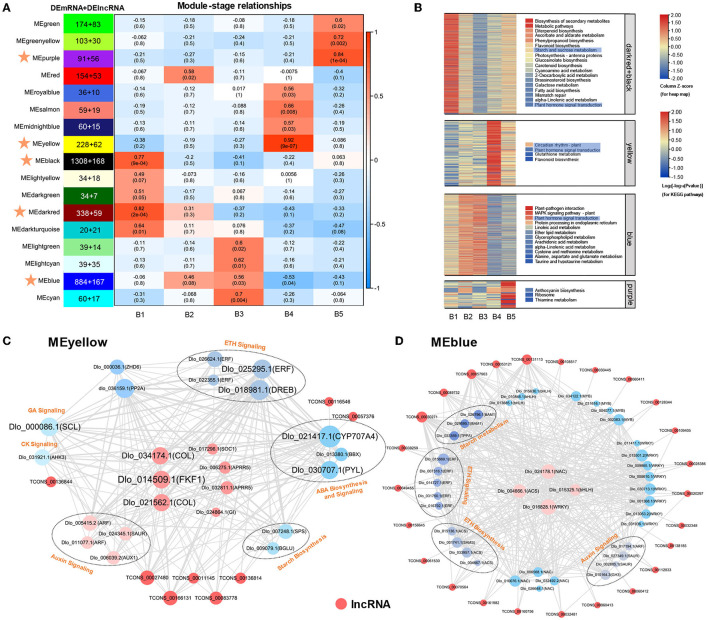
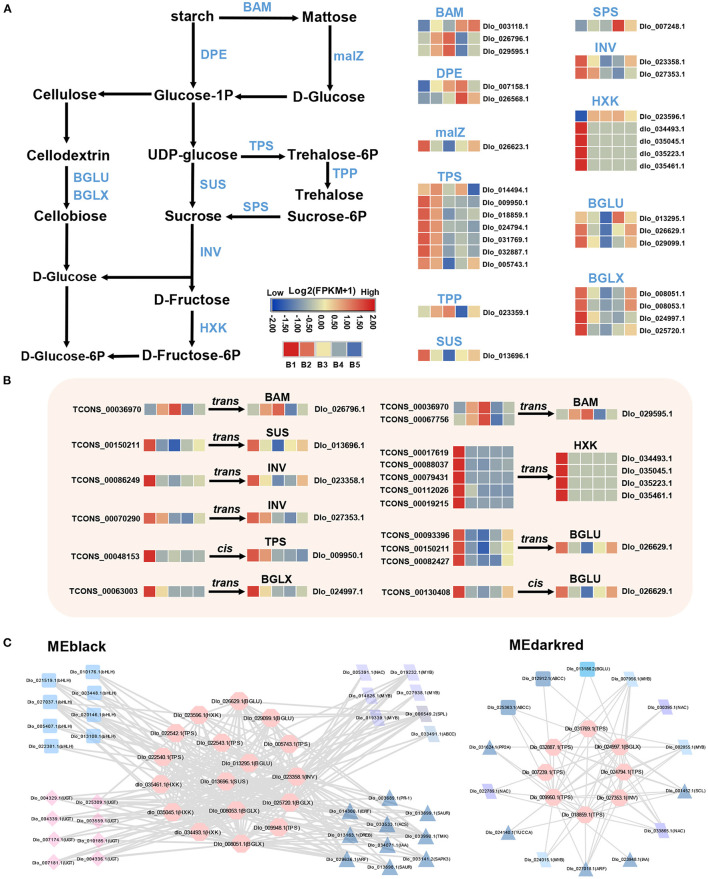
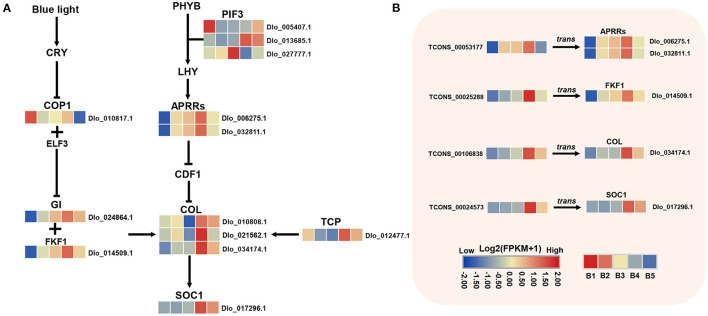
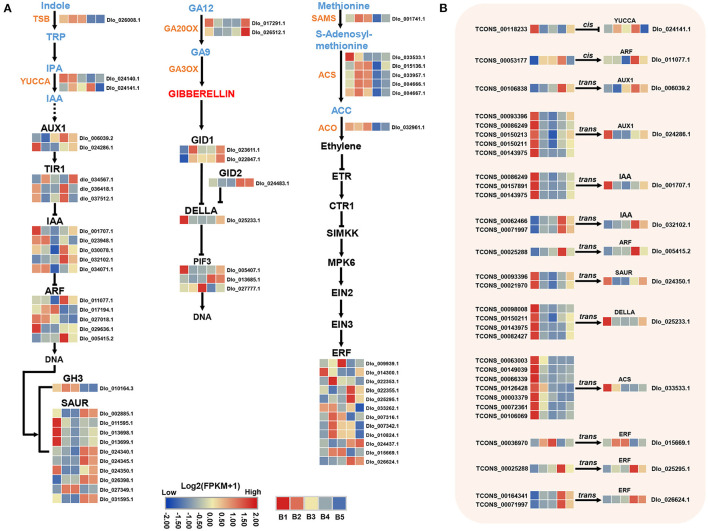
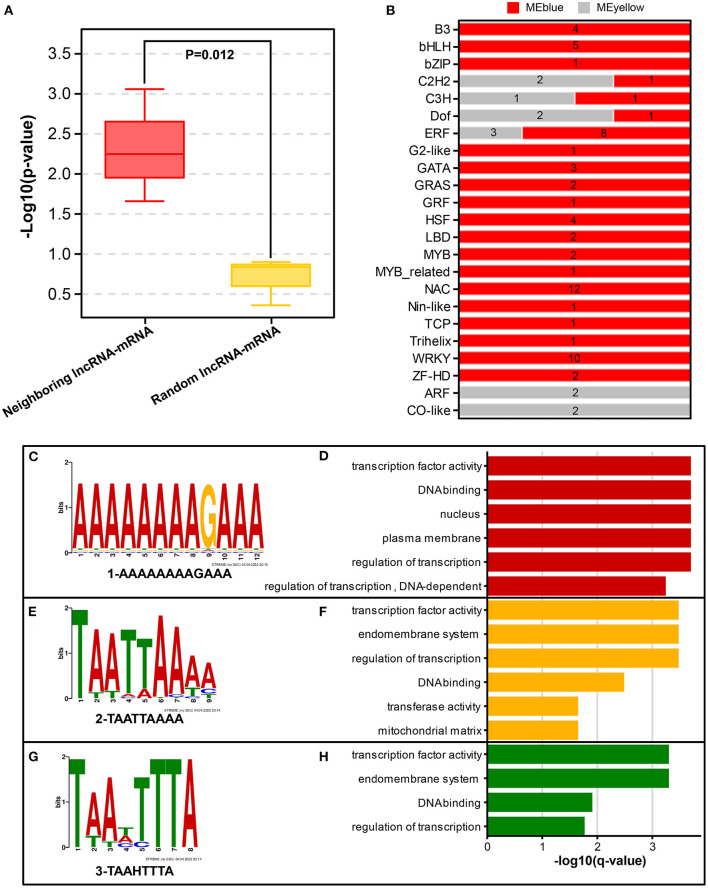
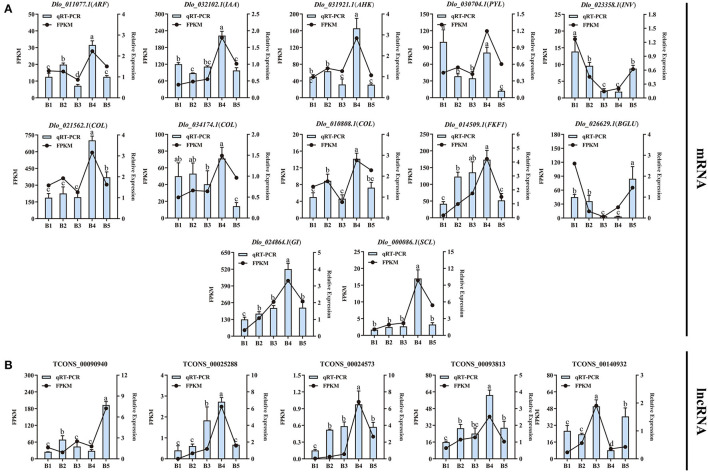
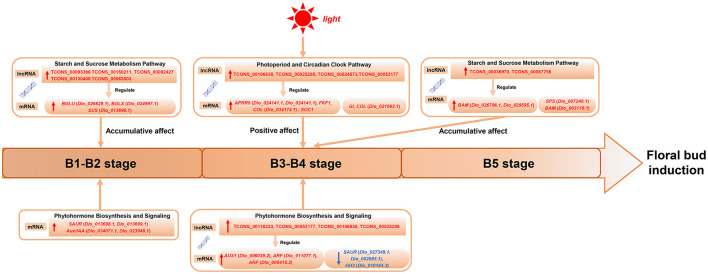
Longan (Dimocarpus longan Lour.) is a tropical/subtropical fruit tree of significant economic importance. Floral induction is an essential process for longan flowering and plays decisive effects on the longan yield. Due to the instability of flowering, it is necessary to understand the molecular mechanisms of floral induction in longan. In this study, mRNA and long noncoding RNA (lncRNA) transcriptome sequencing were performed using the apical buds of fruiting branches as materials. A total of 7,221 differential expressions of mRNAs (DEmRNAs) and 3,238 differential expressions of lncRNAs (DElncRNAs) were identified, respectively. KEGG enrichment analysis of DEmRNAs highlighted the importance of starch and sucrose metabolic, circadian rhythms, and plant hormone signal transduction pathways during floral induction. Combining the analysis of weighted gene co-expression network (WGCNA) and expression pattern of DEmRNAs in the three pathways, specific transcriptional characteristics at each stage during floral induction and regulatory network involving co-expressed genes were investigated. The results showed that sucrose metabolism and auxin signal transduction may be crucial for the growth and maturity of autumn shoots in September and October (B1-B2 stage); starch and sucrose metabolic, circadian rhythms, and plant hormone signal transduction pathways participated in the regulation of floral bud physiological differentiation together in November and December (B3-B4 stage) and the crosstalk among three pathways was also found. Hub genes in the co-expression network and key DEmRNAs in three pathways were identified. The circadian rhythm genes FKF1 and GI were found to activate SOC1gene through the photoperiod core factor COL genes, and they were co-expressed with auxin, gibberellin, abscisic acid, ethylene signaling genes, and sucrose biosynthesis genes at B4 stage. A total of 12 hub-DElncRNAs had potential for positively affecting their distant target genes in three putative key pathways, predominantly in a co-transcriptional manner. A hypothetical model of regulatory pathways and key genes and lncRNAs during floral bud induction in longan was proposed finally. Our studies will provide valuable clues and information to help elucidate the potential molecular mechanisms of floral initiation in longan and woody fruit trees.
Keywords: WGCNA; floral bud induction; long noncoding RNA; longan; mRNA; transcriptome.
Copyright © 2022 Liang, Zhang, Wang, Yang, Fang, Zheng and Zeng.
Conflict of interest statement
The authors declare that the research was conducted in the absence of any commercial or financial relationships that could be construed as a potential conflict of interest.
Figures
Similar articles
-
Comprehensive analysis of the longan transcriptome reveals distinct regulatory programs during the floral transition.BMC Genomics. 2019 Feb 11;20(1):126. doi: 10.1186/s12864-019-5461-3. BMC Genomics. 2019. PMID: 30744552 Free PMC article.
-
Genome-wide identification of CONSTANS-like genes in Dimocarpus longan and functional characterization of DlCOL9 revealing its role in floral induction.Plant Physiol Biochem. 2025 Aug;225:110017. doi: 10.1016/j.plaphy.2025.110017. Epub 2025 May 12. Plant Physiol Biochem. 2025. PMID: 40381360
-
Comparative RNA-sequencing-based transcriptome profiling of buds from profusely flowering 'Qinguan' and weakly flowering 'Nagafu no. 2' apple varieties reveals novel insights into the regulatory mechanisms underlying floral induction.BMC Plant Biol. 2018 Dec 22;18(1):370. doi: 10.1186/s12870-018-1555-3. BMC Plant Biol. 2018. PMID: 30577771 Free PMC article.
-
Floral Induction of Longan (Dimocarpus longan) by Potassium Chlorate: Application, Mechanism, and Future Perspectives.Front Plant Sci. 2021 Jun 7;12:670587. doi: 10.3389/fpls.2021.670587. eCollection 2021. Front Plant Sci. 2021. PMID: 34163509 Free PMC article. Review.
-
Identification of MFI2-AS1, a Novel Pivotal lncRNA for Prognosis of Stage III/IV Colorectal Cancer.Dig Dis Sci. 2020 Dec;65(12):3538-3550. doi: 10.1007/s10620-020-06064-1. Epub 2020 Jan 20. Dig Dis Sci. 2020. PMID: 31960204 Review.
Cited by
-
Comprehensive Genome-Wide Analysis of the Receptor-like Protein Gene Family and Functional Analysis of PeRLP8 Associated with Crown Rot Resistance in Passiflora edulis.Plants (Basel). 2024 Nov 21;13(23):3264. doi: 10.3390/plants13233264. Plants (Basel). 2024. PMID: 39683056 Free PMC article.
-
Illumina RNA and SMRT Sequencing Reveals the Mechanism of Uptake and Transformation of Selenium Nanoparticles in Soybean Seedlings.Plants (Basel). 2023 Feb 9;12(4):789. doi: 10.3390/plants12040789. Plants (Basel). 2023. PMID: 36840137 Free PMC article.
-
Comprehensive Analysis of lncRNA-mRNA Expression Profiles in Depression-like Responses of Mice Related to Polystyrene Nanoparticle Exposure.Toxics. 2023 Jul 10;11(7):600. doi: 10.3390/toxics11070600. Toxics. 2023. PMID: 37505566 Free PMC article.
-
Construction of chronic glomerulonephritis‑related lncRNA‑mRNA regulatory network and lncRNA‑-miRNA‑mRNA ceRNA network by bioinformatics analysis.Exp Ther Med. 2023 Jul 7;26(2):403. doi: 10.3892/etm.2023.12102. eCollection 2023 Aug. Exp Ther Med. 2023. PMID: 37522060 Free PMC article.
References
LinkOut - more resources
Full Text Sources