Comparative Transcriptomic Analyses of Nitrate-Response in Rice Genotypes With Contrasting Nitrogen Use Efficiency Reveals Common and Genotype-Specific Processes, Molecular Targets and Nitrogen Use Efficiency-Candidates
- PMID: 35774823
- PMCID: PMC9237547
- DOI: 10.3389/fpls.2022.881204
Comparative Transcriptomic Analyses of Nitrate-Response in Rice Genotypes With Contrasting Nitrogen Use Efficiency Reveals Common and Genotype-Specific Processes, Molecular Targets and Nitrogen Use Efficiency-Candidates
Abstract
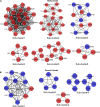
The genetic basis for nitrogen (N)-response and N use efficiency (NUE) must be found in N-responsive gene expression or protein regulation. Our transcriptomic analysis of nitrate response in two contrasting rice genotypes of Oryza sativa ssp. Indica (Nidhi with low NUE and Panvel1 with high NUE) revealed the processes/functions underlying differential N-response/NUE. The microarray analysis of low nitrate response (1.5 mM) relative to normal nitrate control (15 mM) used potted 21-days old whole plants. It revealed 1,327 differentially expressed genes (DEGs) exclusive to Nidhi and 666 exclusive to Panvel1, apart from 70 common DEGs, of which 10 were either oppositely expressed or regulated to different extents. Gene ontology analyses revealed that photosynthetic processes were among the very few processes common to both the genotypes in low N response. Those unique to Nidhi include cell division, nitrogen utilization, cytoskeleton, etc. in low N-response, whereas those unique to Panvel1 include signal transduction, protein import into the nucleus, and mitochondria. This trend of a few common but mostly unique categories was also true for transporters, transcription factors, microRNAs, and post-translational modifications, indicating their differential involvement in Nidhi and Panvel1. Protein-protein interaction networks constructed using DEG-associated experimentally validated interactors revealed subnetworks involved in cytoskeleton organization, cell wall, etc. in Nidhi, whereas in Panvel1, it was chloroplast development. NUE genes were identified by selecting yield-related genes from N-responsive DEGs and their co-localization on NUE-QTLs revealed the differential distribution of NUE-genes between genotypes but on the same chromosomes 1 and 3. Such hotspots are important for NUE breeders.
Keywords: QTLs; networks; nitrate; nitrogen use efficiency; rice; transcriptome.
Copyright © 2022 Sharma, Kumari, Jaiswal and Raghuram.
Conflict of interest statement
The authors declare that the research was conducted in the absence of any commercial or financial relationships that could be construed as a potential conflict of interest.
Figures


Similar articles
-
Nitrate-responsive transcriptome analysis of rice RGA1 mutant reveals the role of G-protein alpha subunit in negative regulation of nitrogen-sensitivity and use efficiency.Plant Cell Rep. 2023 Dec;42(12):1987-2010. doi: 10.1007/s00299-023-03078-7. Epub 2023 Oct 24. Plant Cell Rep. 2023. PMID: 37874341
-
Genome-Wide Urea Response in Rice Genotypes Contrasting for Nitrogen Use Efficiency.Int J Mol Sci. 2023 Mar 23;24(7):6080. doi: 10.3390/ijms24076080. Int J Mol Sci. 2023. PMID: 37047052 Free PMC article.
-
Nitrate-responsive transcriptome analysis reveals additional genes/processes and associated traits viz. height, tillering, heading date, stomatal density and yield in japonica rice.Planta. 2022 Jan 17;255(2):42. doi: 10.1007/s00425-021-03816-9. Planta. 2022. PMID: 35038039
-
Transporters and transcription factors gene families involved in improving nitrogen use efficiency (NUE) and assimilation in rice (Oryza sativa L.).Transgenic Res. 2022 Feb;31(1):23-42. doi: 10.1007/s11248-021-00284-5. Epub 2021 Sep 15. Transgenic Res. 2022. PMID: 34524604 Review.
-
Nitrogen use efficiency in crops: lessons from Arabidopsis and rice.J Exp Bot. 2017 May 1;68(10):2477-2488. doi: 10.1093/jxb/erx101. J Exp Bot. 2017. PMID: 28419301 Review.
Cited by
-
Nitrate-responsive transcriptome analysis of rice RGA1 mutant reveals the role of G-protein alpha subunit in negative regulation of nitrogen-sensitivity and use efficiency.Plant Cell Rep. 2023 Dec;42(12):1987-2010. doi: 10.1007/s00299-023-03078-7. Epub 2023 Oct 24. Plant Cell Rep. 2023. PMID: 37874341
-
Weighted gene co-expression network analysis of nitrogen (N)-responsive genes and the putative role of G-quadruplexes in N use efficiency (NUE) in rice.Front Plant Sci. 2023 Jun 7;14:1135675. doi: 10.3389/fpls.2023.1135675. eCollection 2023. Front Plant Sci. 2023. PMID: 37351205 Free PMC article.
-
Genome-Wide Urea Response in Rice Genotypes Contrasting for Nitrogen Use Efficiency.Int J Mol Sci. 2023 Mar 23;24(7):6080. doi: 10.3390/ijms24076080. Int J Mol Sci. 2023. PMID: 37047052 Free PMC article.
-
Partial root-zone drying combined with nitrogen treatments mitigates drought responses in rice.Front Plant Sci. 2024 Apr 15;15:1381491. doi: 10.3389/fpls.2024.1381491. eCollection 2024. Front Plant Sci. 2024. PMID: 38685964 Free PMC article.
-
Effect of Nitrogen and Phosphorus Fertilizers on Dry Matter Accumulation and Translocation of Two Amylose Content Indica Rice on Yield.Plants (Basel). 2025 May 20;14(10):1536. doi: 10.3390/plants14101536. Plants (Basel). 2025. PMID: 40431101 Free PMC article.
References
LinkOut - more resources
Full Text Sources
Molecular Biology Databases

